
Different figures for Generation

6 comments started 2023-04-04 last 2023-04-05
Mobile AppForums/Meta
S
#1 Stew

Any idea why the dashboard (header bar info) and meter data for total generation (and daily generation) is different to the figures on the Energy Graph. Interestingly the Giv Energy iOS app shows the same figure as the energy graph?
Cheers.
C
#2 cluelesscris

What are the numbers and which meter are you talking about? What set up do you have Hybrid or AC?

T
#3 TX200

Mine are different too.

The top of the web portal shows one (lower) value, for generation today, which matches what is shown as the actual generation on the solar forecast card.

The above value also matches what's shown in "meter data" on the my inverter page.

The energy graph part way down the portal page shows a larger number for today's generation (which is the same value seen on the app).

So is the energy graph and the app wrong?

S
#4 Smk82

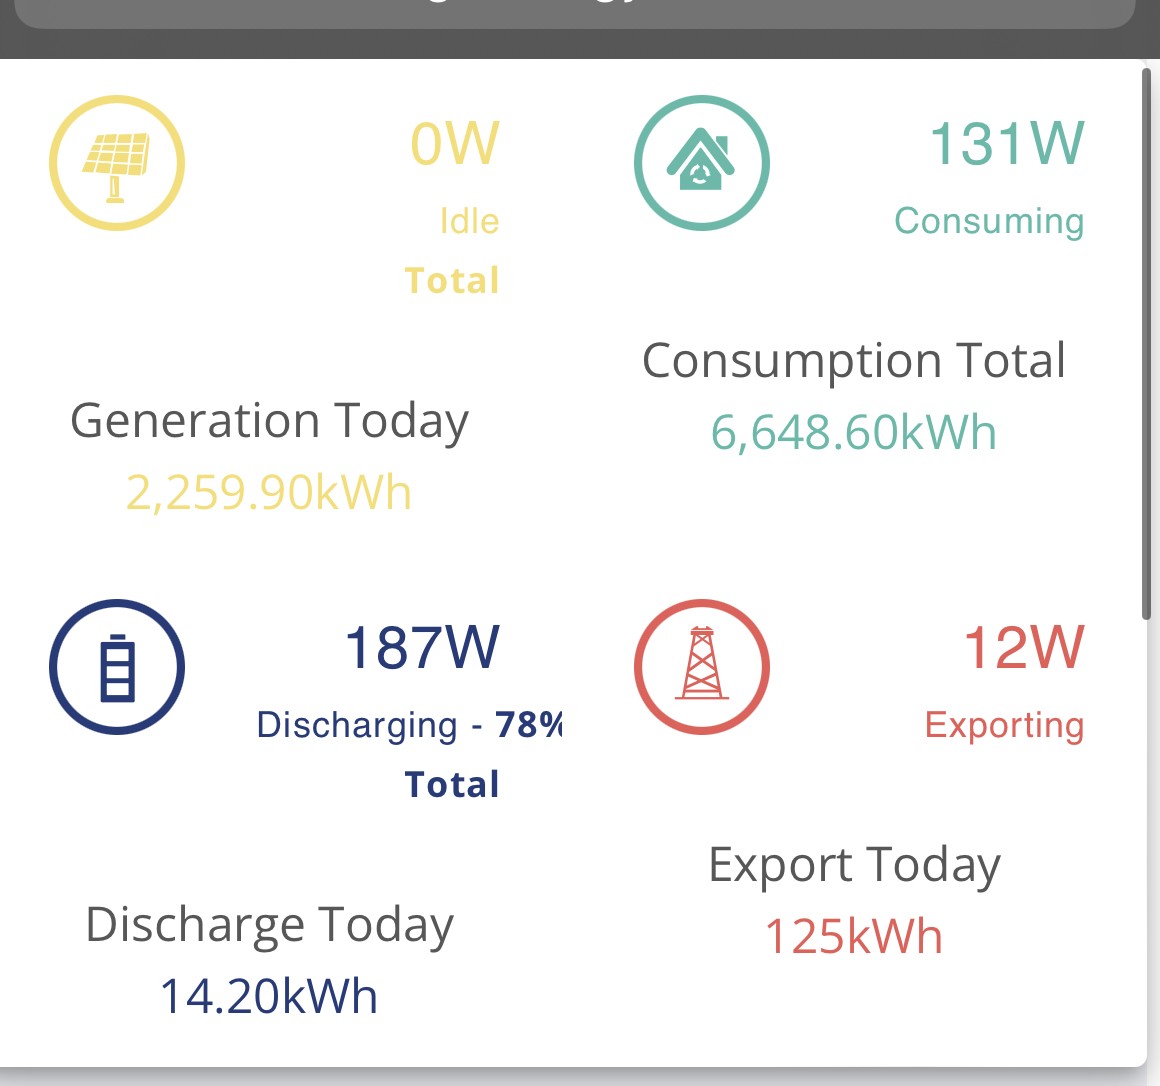
Mine are a complete work of fiction. When I had my two inverters in parallel separate, data made sense. Now they are master/slave, it’s garbage. I’ve been told it should be sorted by ems as it will allow a two inverter system to process data correctly

Apparently I’ve generated over 2000kw in a day😂

W
#5 wilfleek

If only.................

I
#6 igm83

Mine are different too, 17.9 on dashboard 16.9 on the app