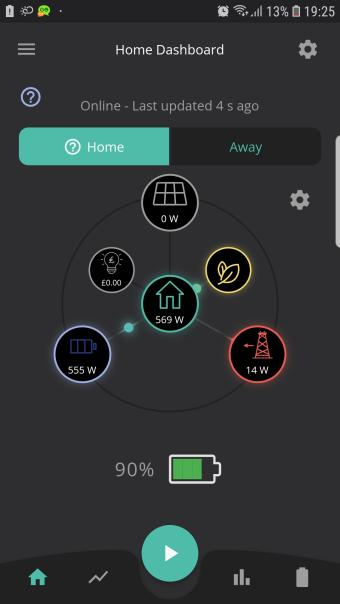
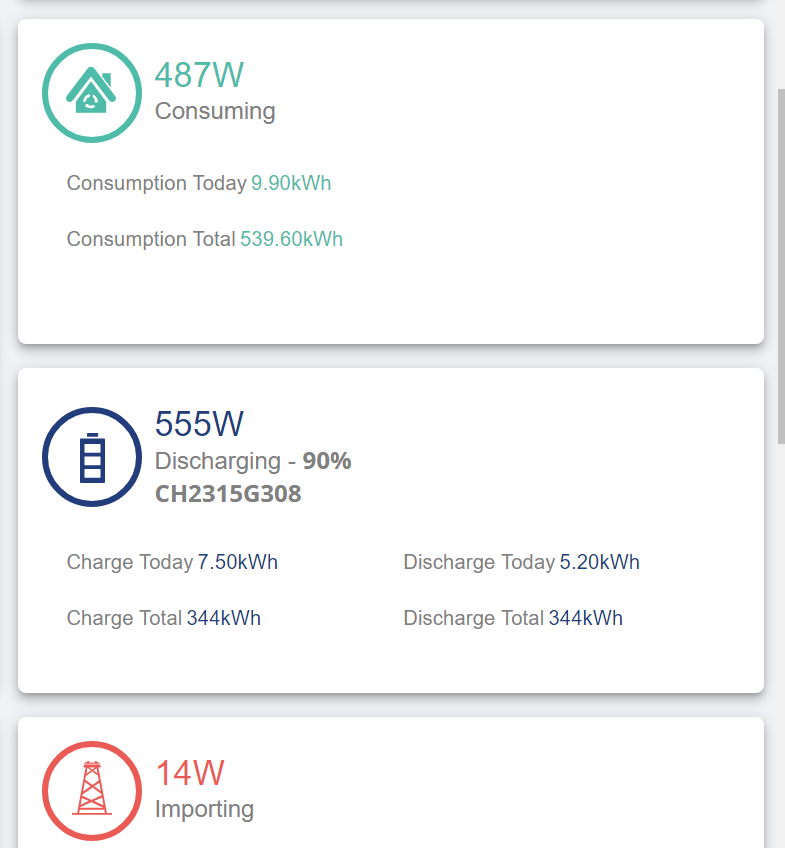
Strange figures for consumption/battery discharge currently.

3 comments started 2023-08-29 last 2023-08-29
GivEnergy Products
J
#1 Jellybaby

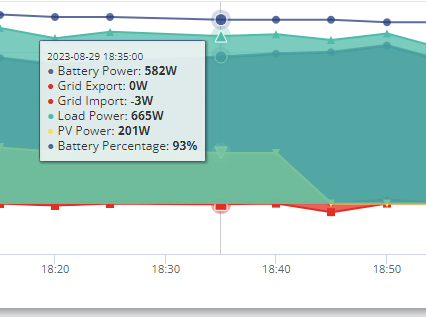
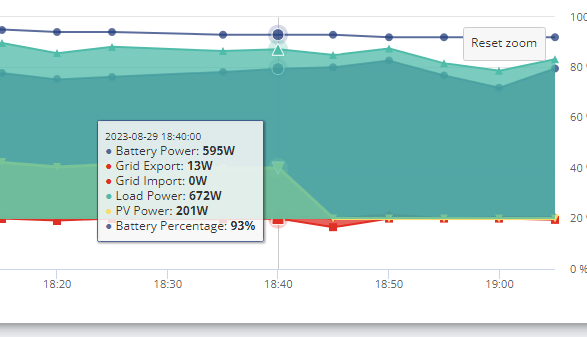
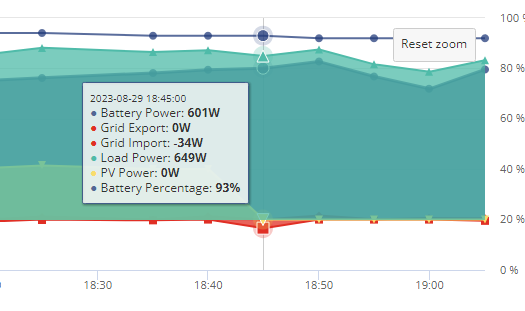
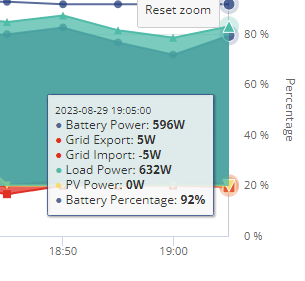
Not generating anything solar wise but this is extremely odd, for some reason the battery is drawing less than house load whilst drawing nothing from the grid as you see below.
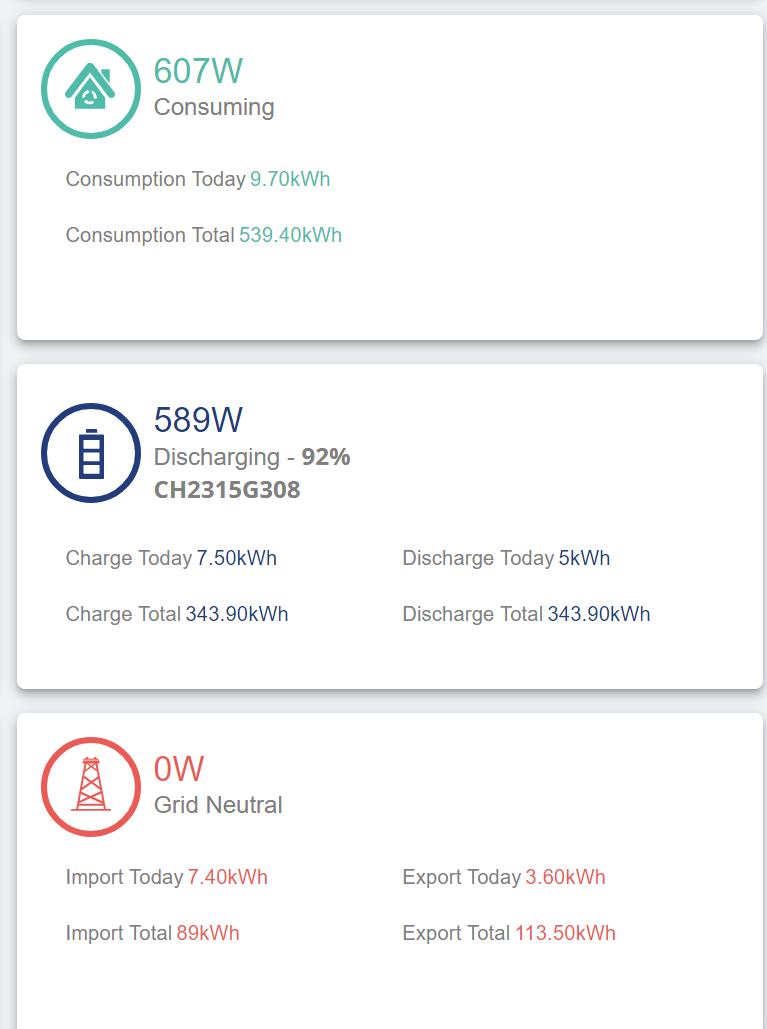
Usually battery discharge is 80-130w above house load but NEVER been below house load before,, anybody seeing similar?

Edit
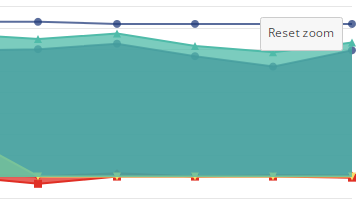
Also when selecting a timeframe manually to zoom into on graphs it keeps going blank and just has a reset zoom box?

Edit 2
This is typically what I see for load and battery

This is what I see now
T
#2 TX200

The web portal shows data every five minutes. It's a snapshot of what was happening at that exact moment.

Could be a chance that the data for one entry was captured, something changed (load increased/decreased) and another entry was captured. Thus it doesn't add up.

J
#3 Jellybaby

TX200 I went to the app and its reporting same behaviour on local connection, it seems that when the solar stopped the battery discharge isn't reporting the actual discharge properly.


Edit
LOL typical, I loaded it up on phone, waited for the update to tick over then hit F5 on keyboard to refresh website to get an up to date of app and website to see this

But the discarge still seems low compared to load compared to what I have been seeing for the past month.