
Hi there,
A topic that's been covered to death, I know, but I'm seeing a weird behaviour in the MyEnergi app and I'm wondering if anyone has any ideas as to what's causing it or, indeed, if my own logic is flawed.
I have a straightforward setup with the MyEnergi CT clamps on the supply from the grid (CT1) and the supply from the inverter (CT2). I can see the live values in the MyEnergi app and they seem correct and are more or less in line with what I see in the GivEnergy app.
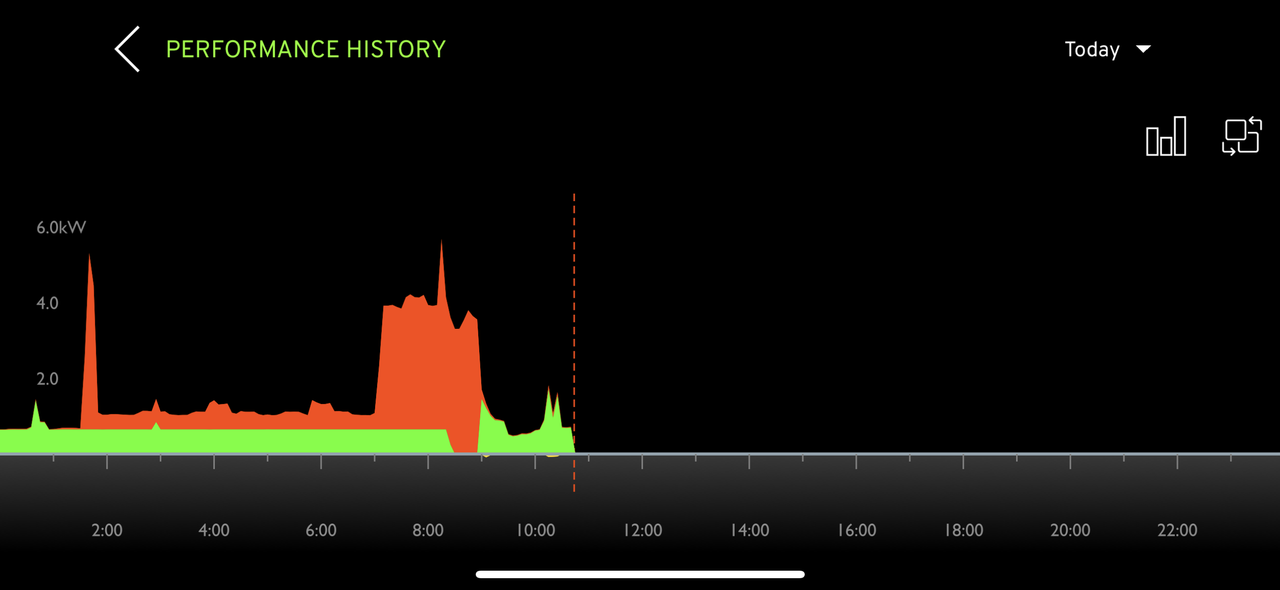
The problem is that when I set CT2 to "Generation + Battery" I see the live values I would expect, but in the Performance History graph I see a totally constant 1.2kW that doesn't seem to match any of the live data. If I switch the CT2 to "Generation Only" I still see the same live values, but the graph starts to behave as I'd expect.
In the attached image I changed "Generation + Battery" to "Generation Only" at around 08:30. The battery ran out at about 01:30. The battery was charging from 07:00 to 08:55.
Anyone have any ideas?
Beirigí bua,
James