
Extracting data into XLS for Analysis?

9 comments started 2023-01-10 last 2023-04-14
Cloud Portal
R
#1 rwallond

Hi all, new user here. Enjoying the Black Magic that is solar PV along with a 9.5Kw battery. Reports provide summary info and I can see half hourly info via "My Invertor" on the portal but I'd ideally like a method of downloading all data once a month to track and analyse in XLS. Apologies if this has been covered before but I couldn't seem to locate it.

R
#3 rwallond

OK, thanks. That shows me a summary for custom range which is useful but I was thinking of downloading the lower level data (maybe every 5 mins) for more detail analysis

T
#4 Tim

rwallond Simplest way is to go to the inverter card, select Inverter data and download the data for your chosen day. You can set the date at the top left and go back as far as you like. This process can be automated but it is a real faff and depending on how much you want the data, it might be quicker to do it manually.

The data is also likely to be incomplete as any data scheduled to be sent to the cloud when you had a local wifi problem, or the cloud servers were down is lost. Daily totals do roll over though.

J
#5 jimgardner

Tim So do you have to get the individual transactions day by day? You cant enter in a date range eg 24/3 to 12/4 and get all the individual export figures? For import analysis I simply go to my Octopus account , enter in a 'date from' and download the half hourly consumption figures

D
#6 dragon2905

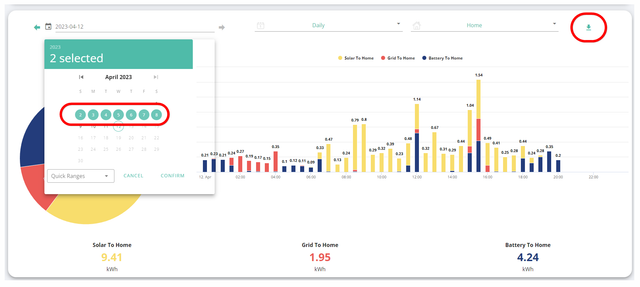
You can also go into your Power Card on your Dashboard and select a Start & End Date which will produce xls file you can import to your preference of spreadsheet.

You will get a daily total for each of these headers (00:00 to 00:00) and not the granular information daily information you would get using the longer method. Longer in that if you want granular info you have to copy past day by day and data by data.

J
#7 jimgardner

jimgardner The reason I need half hourly figures is to make comparisons of smart tariffs where the export credit varies depending on the time of day. I'm currently on Octopus Go and have applied for a SEG 4.1p /kwh tariff so that's easy to work out as I just need daily export totals BUT I can't compare for example to the benefit of transferring to the Flux tariff as I dont know how much export credit I would save until I'm actually on it!. I dont know why a date range isnt possible when downloading the daily granular figures - seems like a straightforward thing to do as the data must all be there!

S
#9 SilverArt

jimgardner Downloading the daily granular figures is easy, processing them is a bit more difficult perhaps.
1) My Inverter > Waffle > Download Data for Yesterday. gives you the data. > Rename the download file to a given name e.g. MyData
2) Master spreadsheet with Macro to:
a) Open MyData > Copy A2 to AO300
b) Goto Master spreadsheet > go to first blank row Col A> Paste
c) Sort on A2 to AOxxxxx where xxxxx is last data row (assumes row1 is titles)
