#1 Riscy
It'd be good to collect some ideas from everyone. Here's my starter for 10:

It'd be good to collect some ideas from everyone. Here's my starter for 10:
Riscy pvoutput.org.

Take it just using the HA API and pushing data elsewhere into a custom dash doesn't count - else anything on TerraVolt.co.uk I guess for me.
(Was never a fan of the lovelace type approach - are you forced to use it or can you start from a complete blank canvas and bring your own chart libraries in?)
Originally meant dashboards that are available to mere mortals via HA or other Home Automation platforms, but hey, come-one come-all.
stevelewis Thanks, I now feel utterly dejected at my pathetic PV output...
hoggy Terravolt: simply beautiful. So many questions. As for Lovelace: you've got to work within it, but can write completely customised components and add them via HACS. Or alternatively, some of my panels are just web parts rendered from Grafana via InfluxDB (different page - not shown above.)
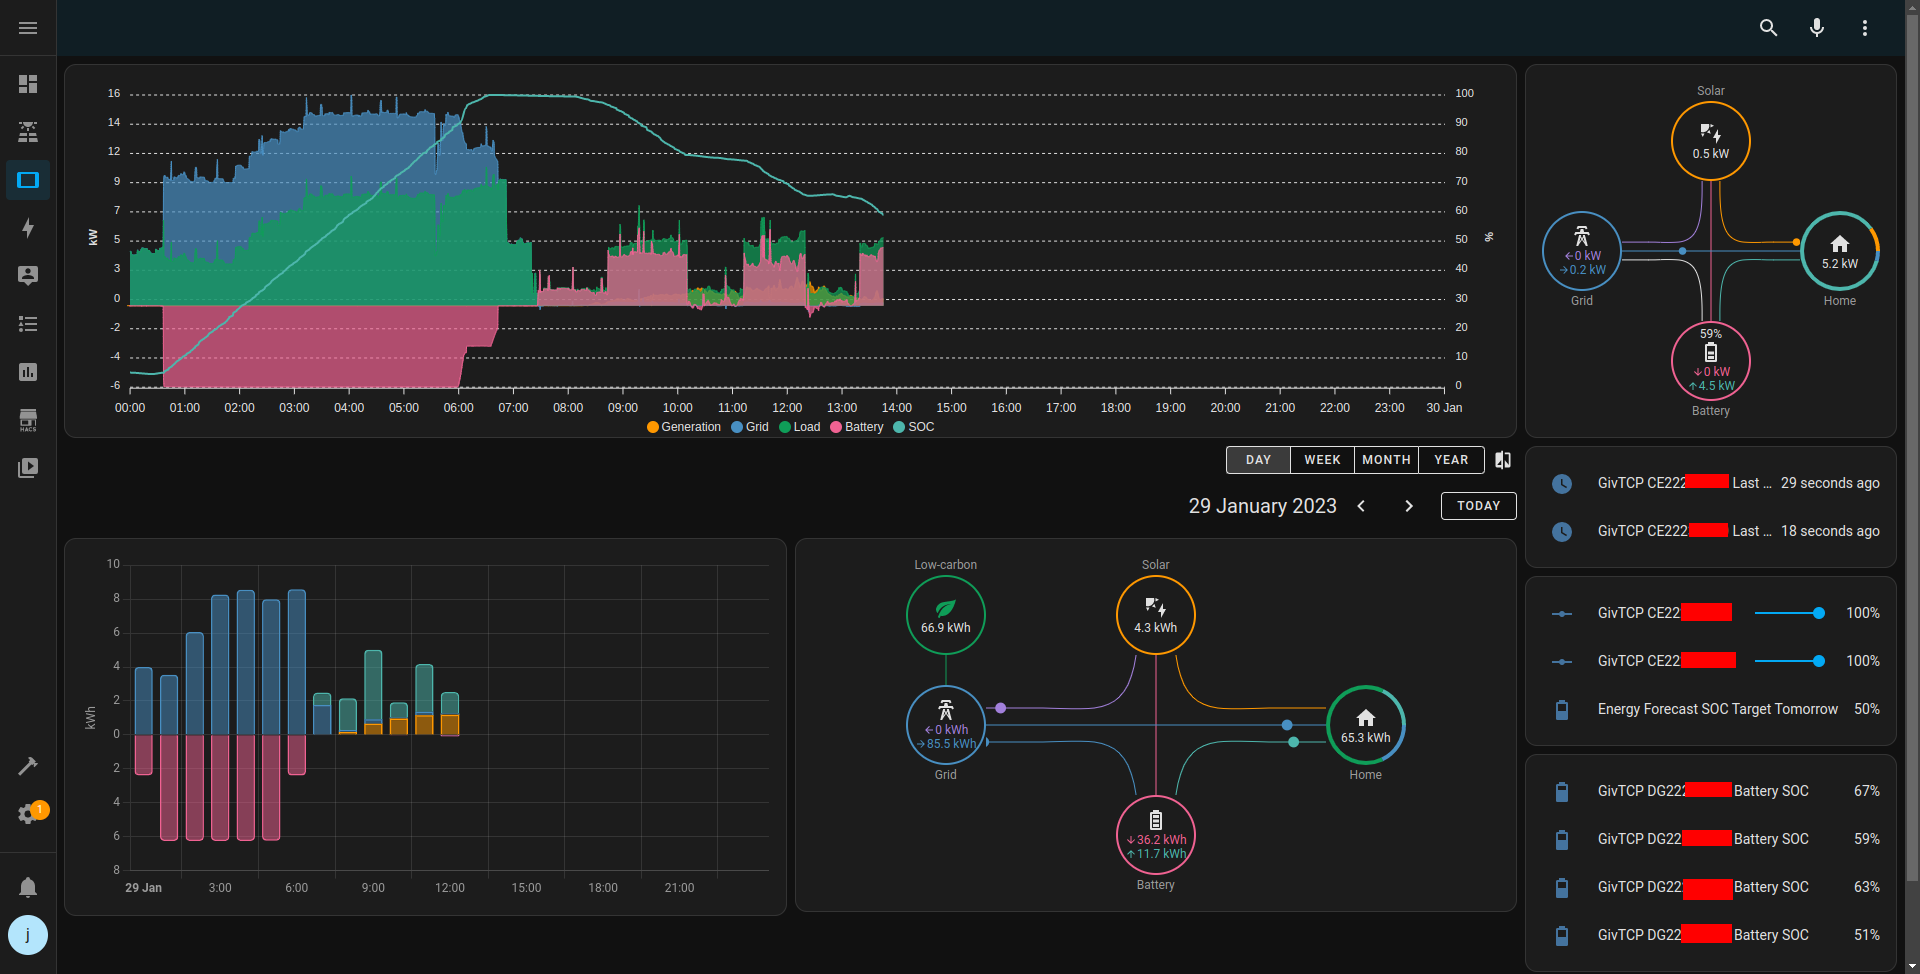

just installed HA, and added in GivTCP
About at the edge of my knowledge!
Any good resources that can inspire me with dashboards?
I have bought a Dell Wyse 5060 thin client terminal off Ebay for £35 and installed Home Assistant.
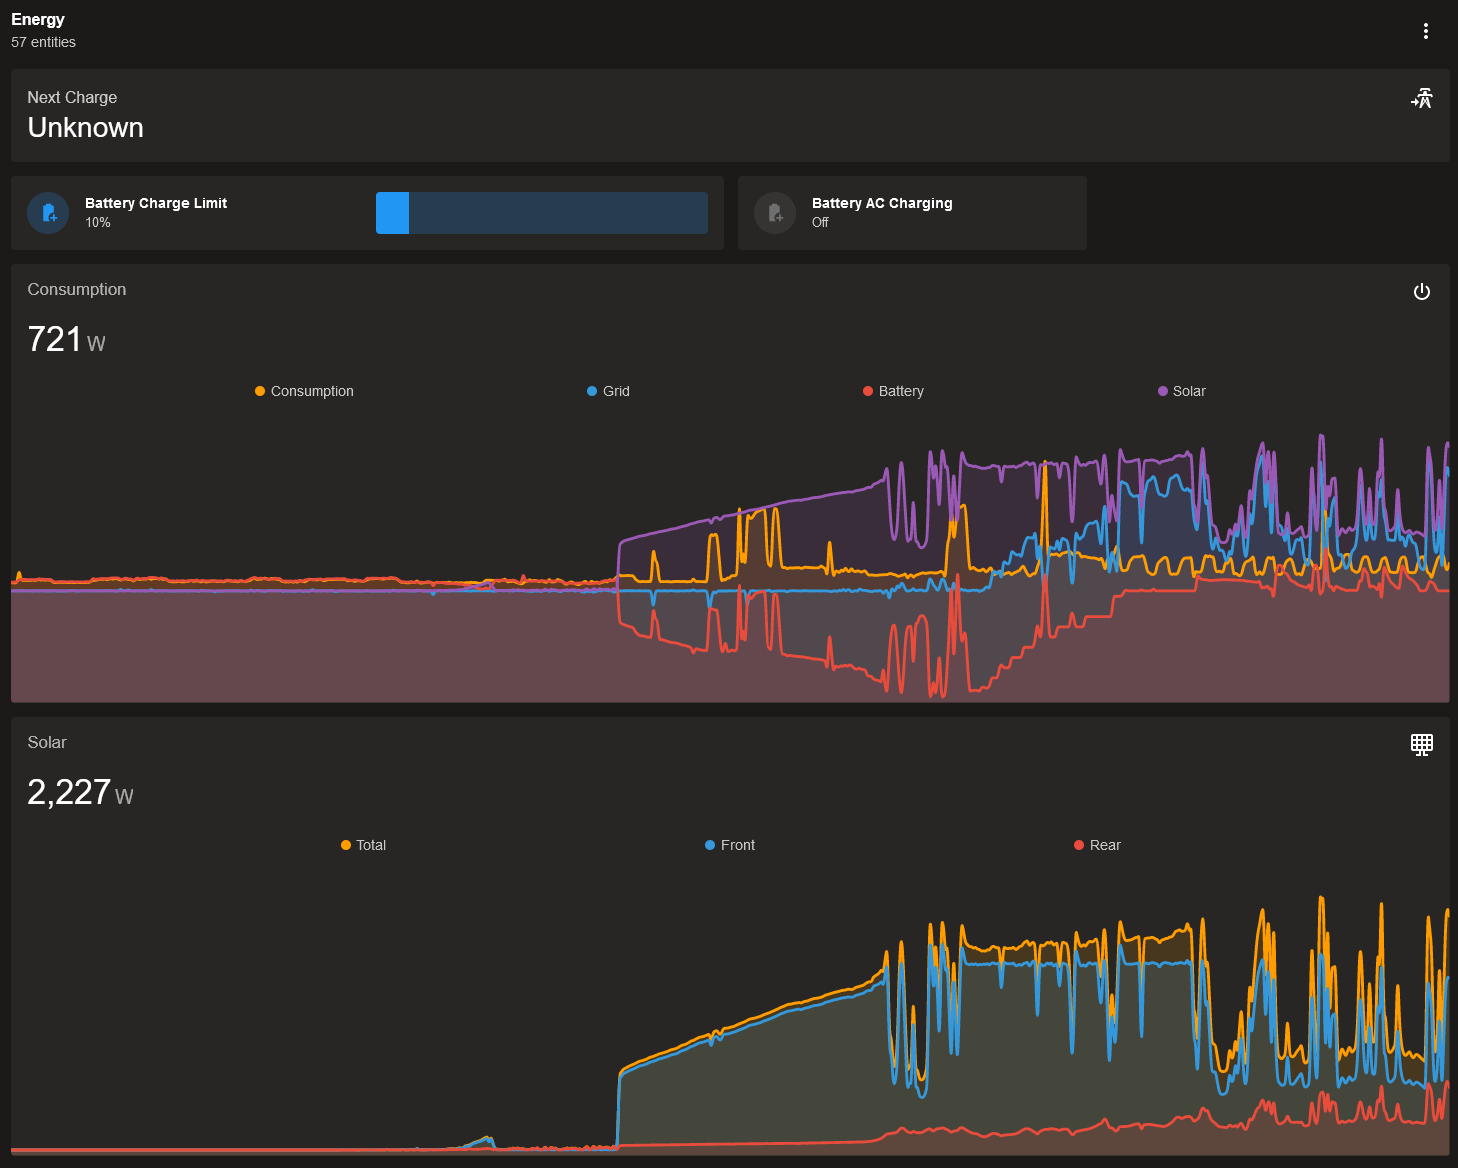
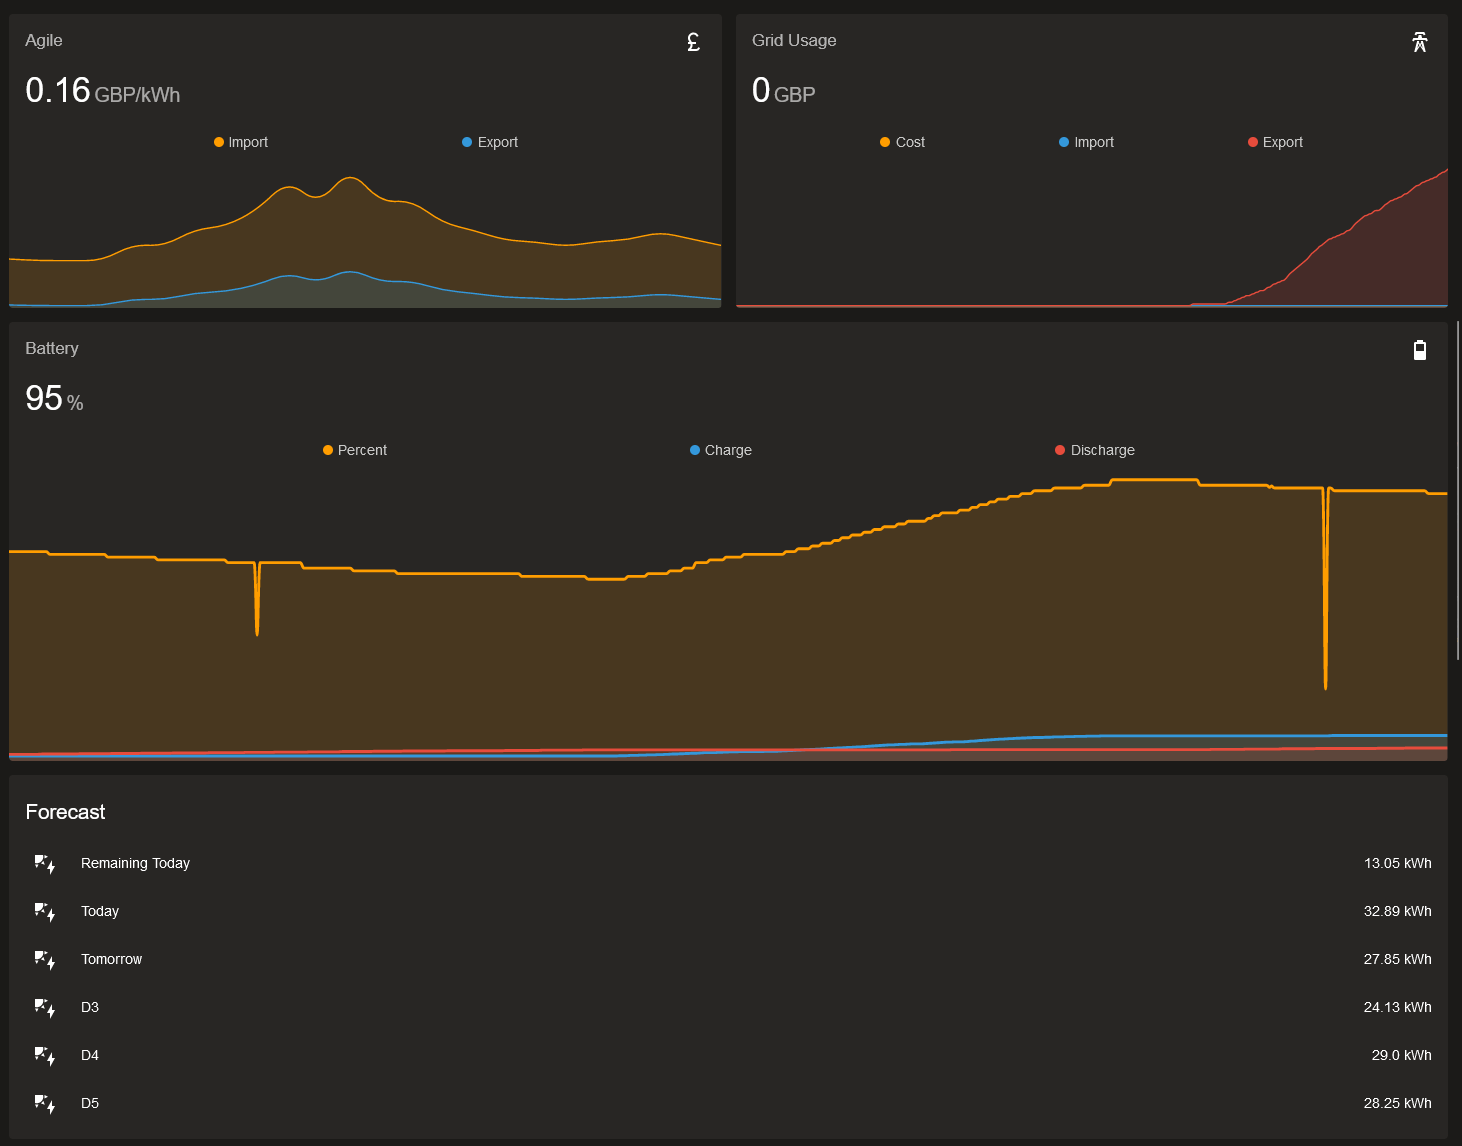
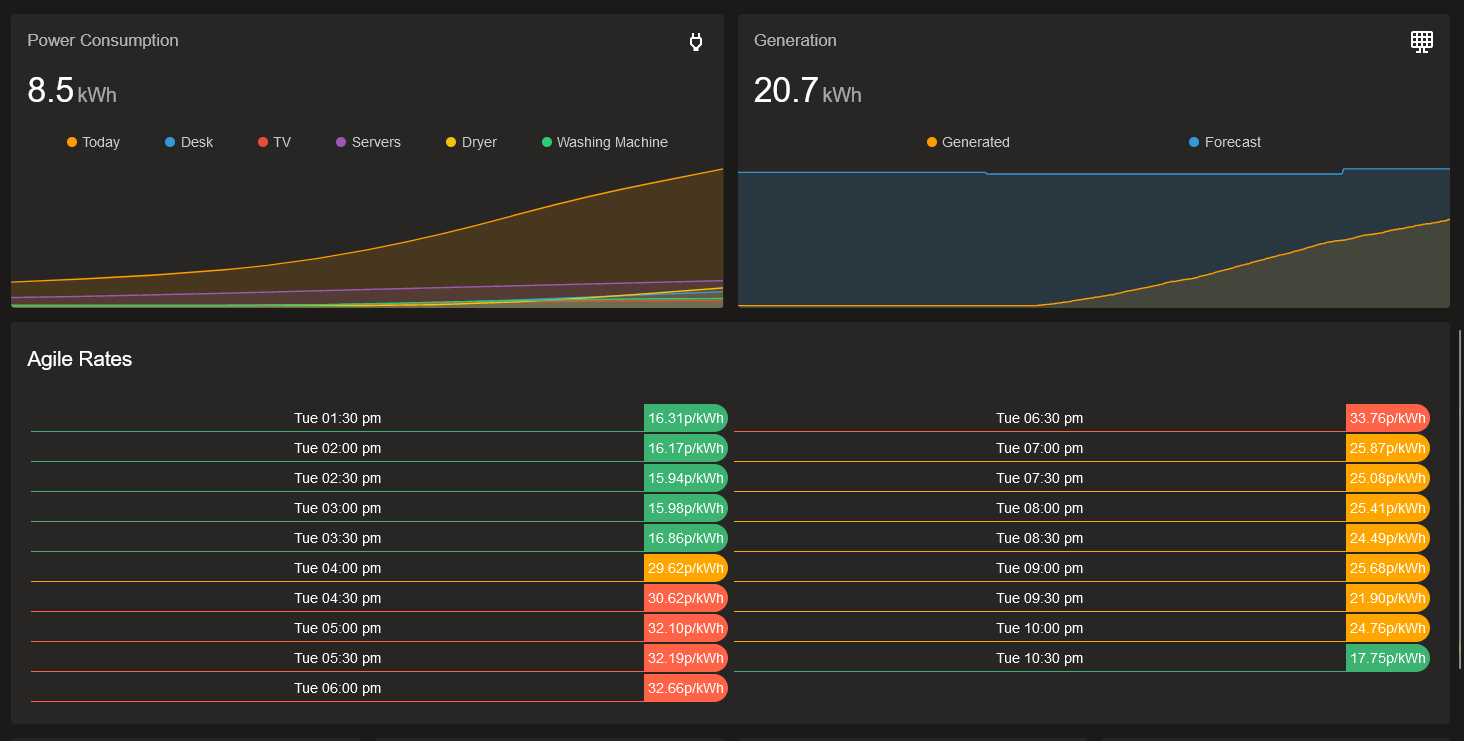
Managed to get my dashboard set-up as follows but still a work in progress......;
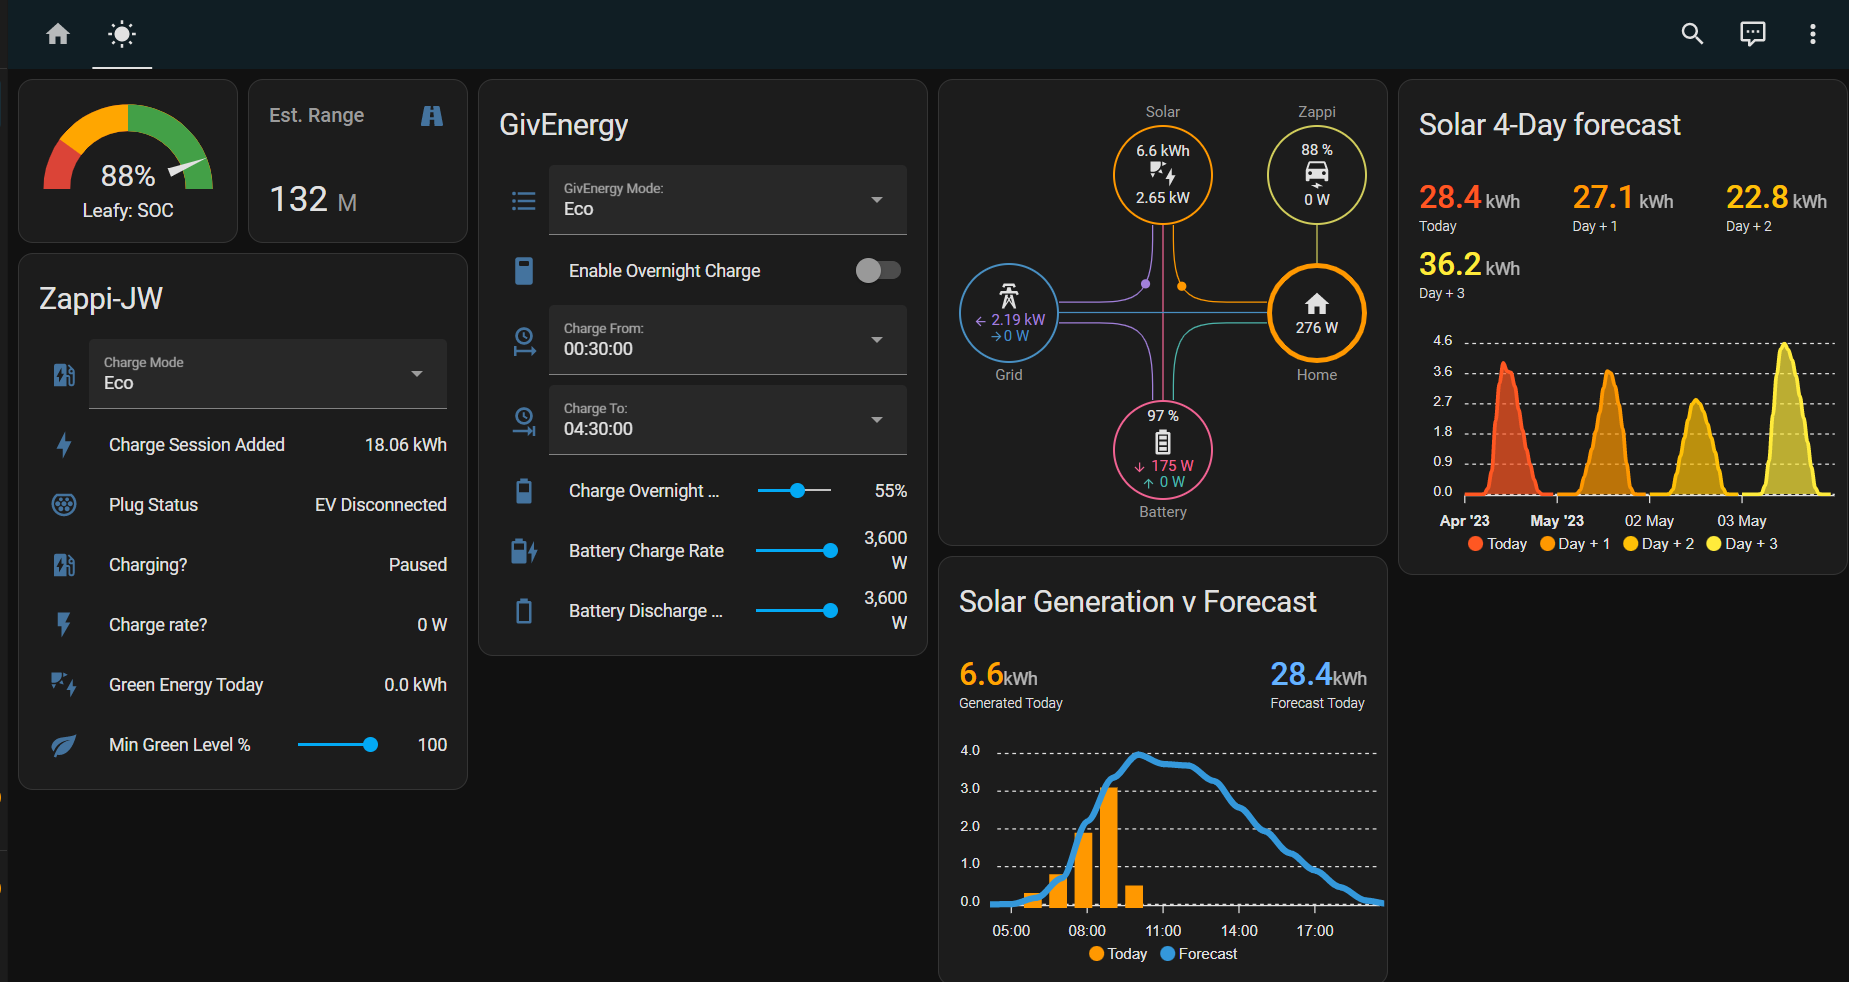
Home assistant with:
Dwains dashboard with a room setup for the energy related stuff.
GivEnergy Local from cpduk
Octopus Energy from bottlecapdave
Mini Graph Card
Solcast
Automation runs to set the battery charge limit and duration of charge based on tomorrows solcast forecast.
Octopus integration determines the cheapest time to charge.
AC charging switches on automatically based on the Octopus integration.
Crap day, find 3.5 cheapest hours from Octopus Agile and take the batteries up to 65%, Amazing day find cheapest hour and take batteries to 10%, some variations between crap and amazing with an emergency charge option if I get to midday without enough charge to get through a "normal" consumption day.
Just need Octopus to pull their finger out on the MPAN and i'll try similar with the export based on the agile price.
Jon-boy I used to call my Nissan Leaf, Leafy!
Arg0t That is cool, how are you monitoring individual stuff consumption wise as I see you have washing machine but I would assume thats on the same ring as rest of electronics in home.
Jon-boy
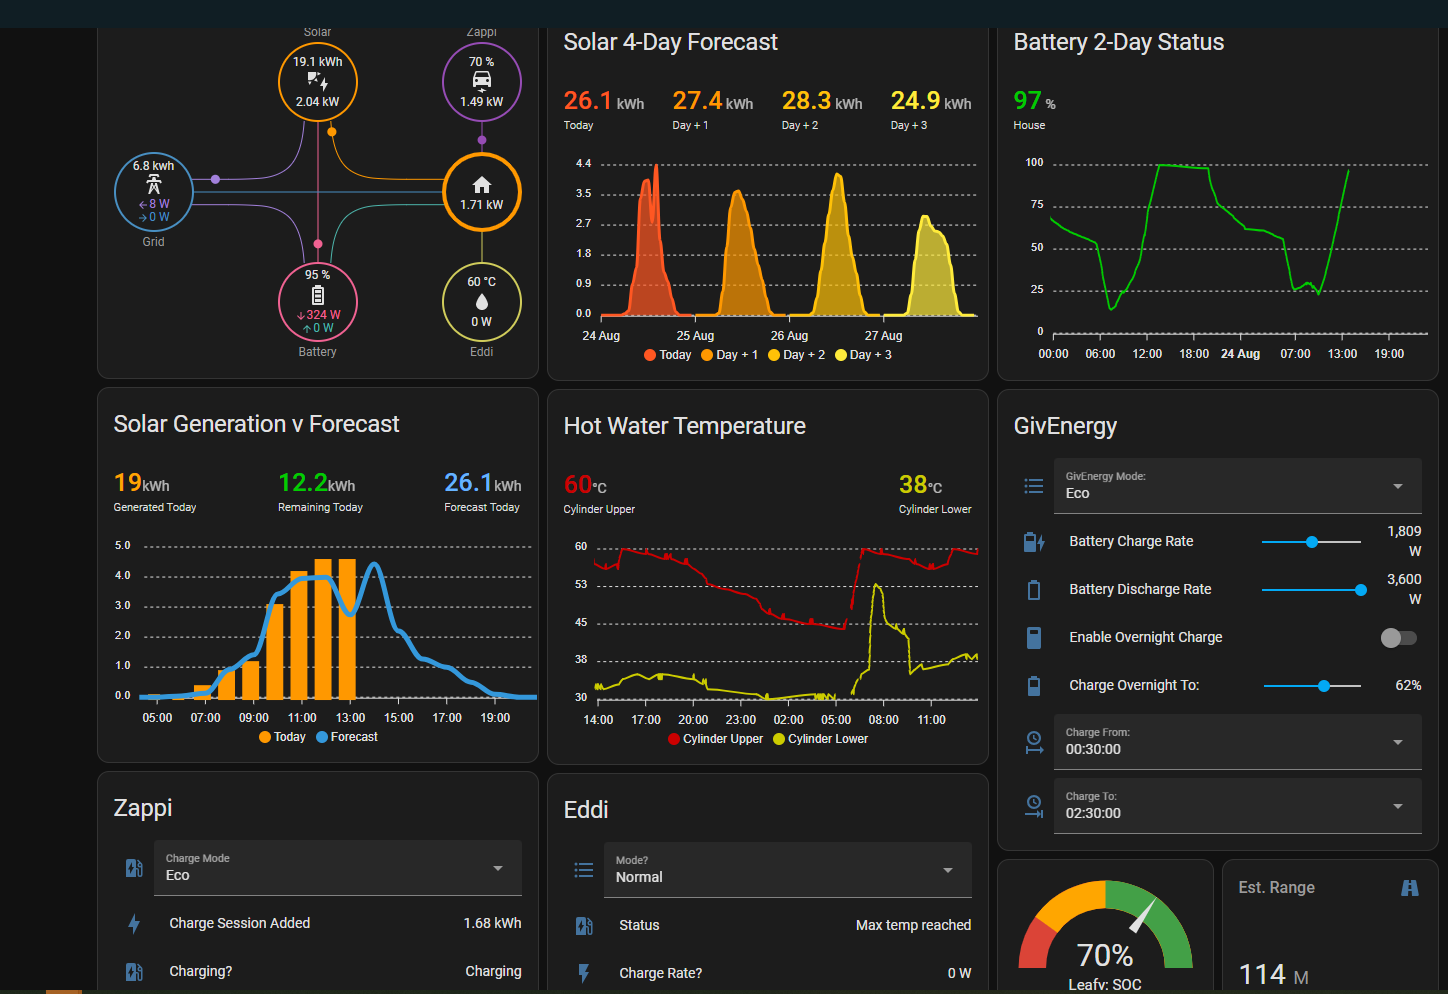
What card is "solar generation verses forecast please"
Jellybaby Tapo P110 plugs, they record power consumption as well as allow remote switching. They pop on Amazon for 30 quid a pack occasionally.
SteveCook I used the apexcharts-card
SteveCook My Dashboard has been updated slightly as added Myenergi Eddi........
Arg0t oh bummer, I tried them before and they were nowhere near accurate with the interval monitoring, by the end of an 8h gaming session they were over 500w off a dumb meter with a screen.
I even reset it and plugged my receiver into it which is over 30 base even when idle, its highest peak after an hour was 29w somehow despite turning eco off and having volume loud during movie.
My main one is quite busy - but I have other tabs for other details too!
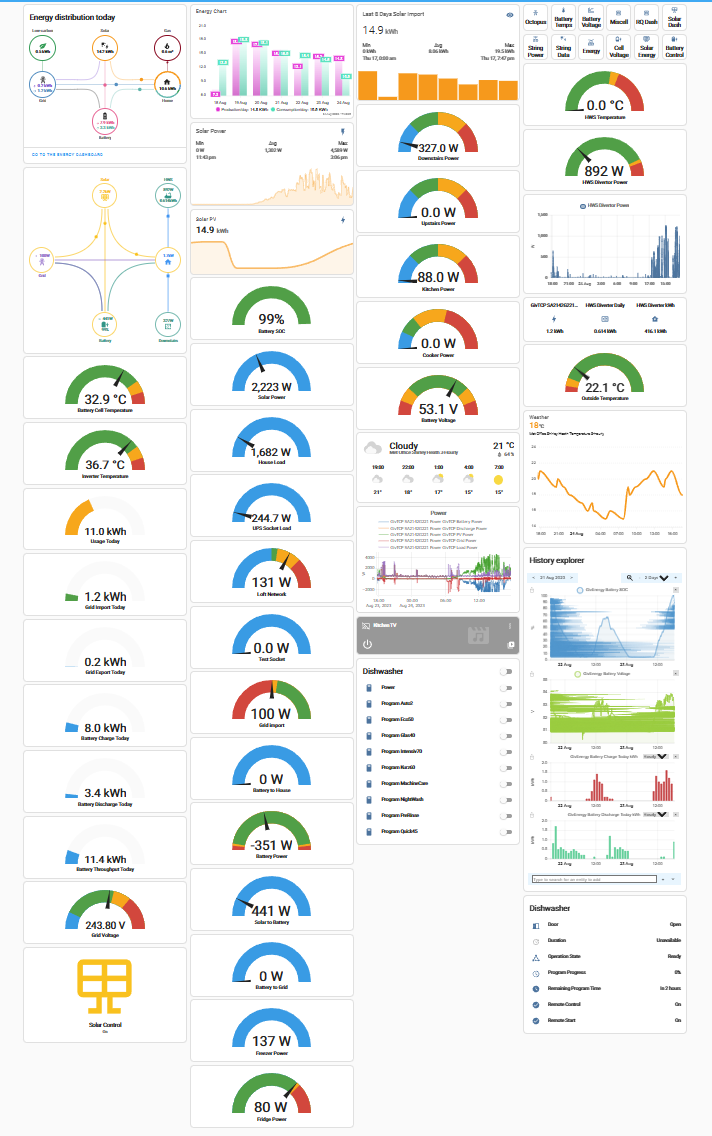
One of my favourites is this one.
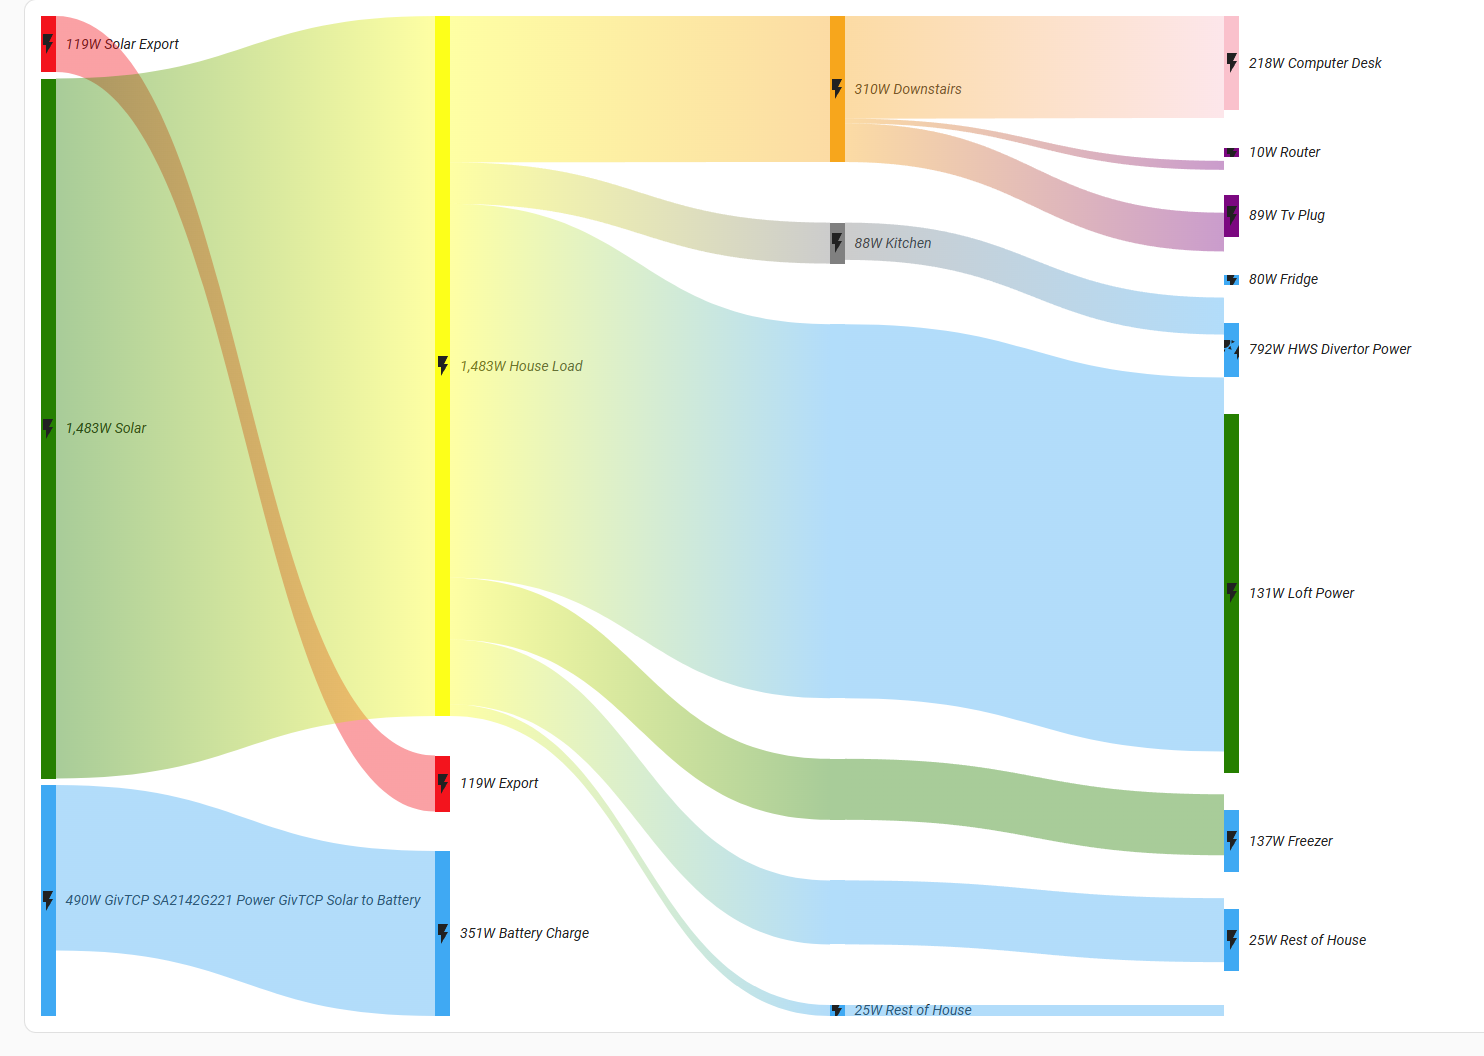

Jon-boy can you only configure the apexcharts card in YAML? Or am I missing something! No problem if not.
Here's mine, same as angelfire, I have lots of other popups for details.
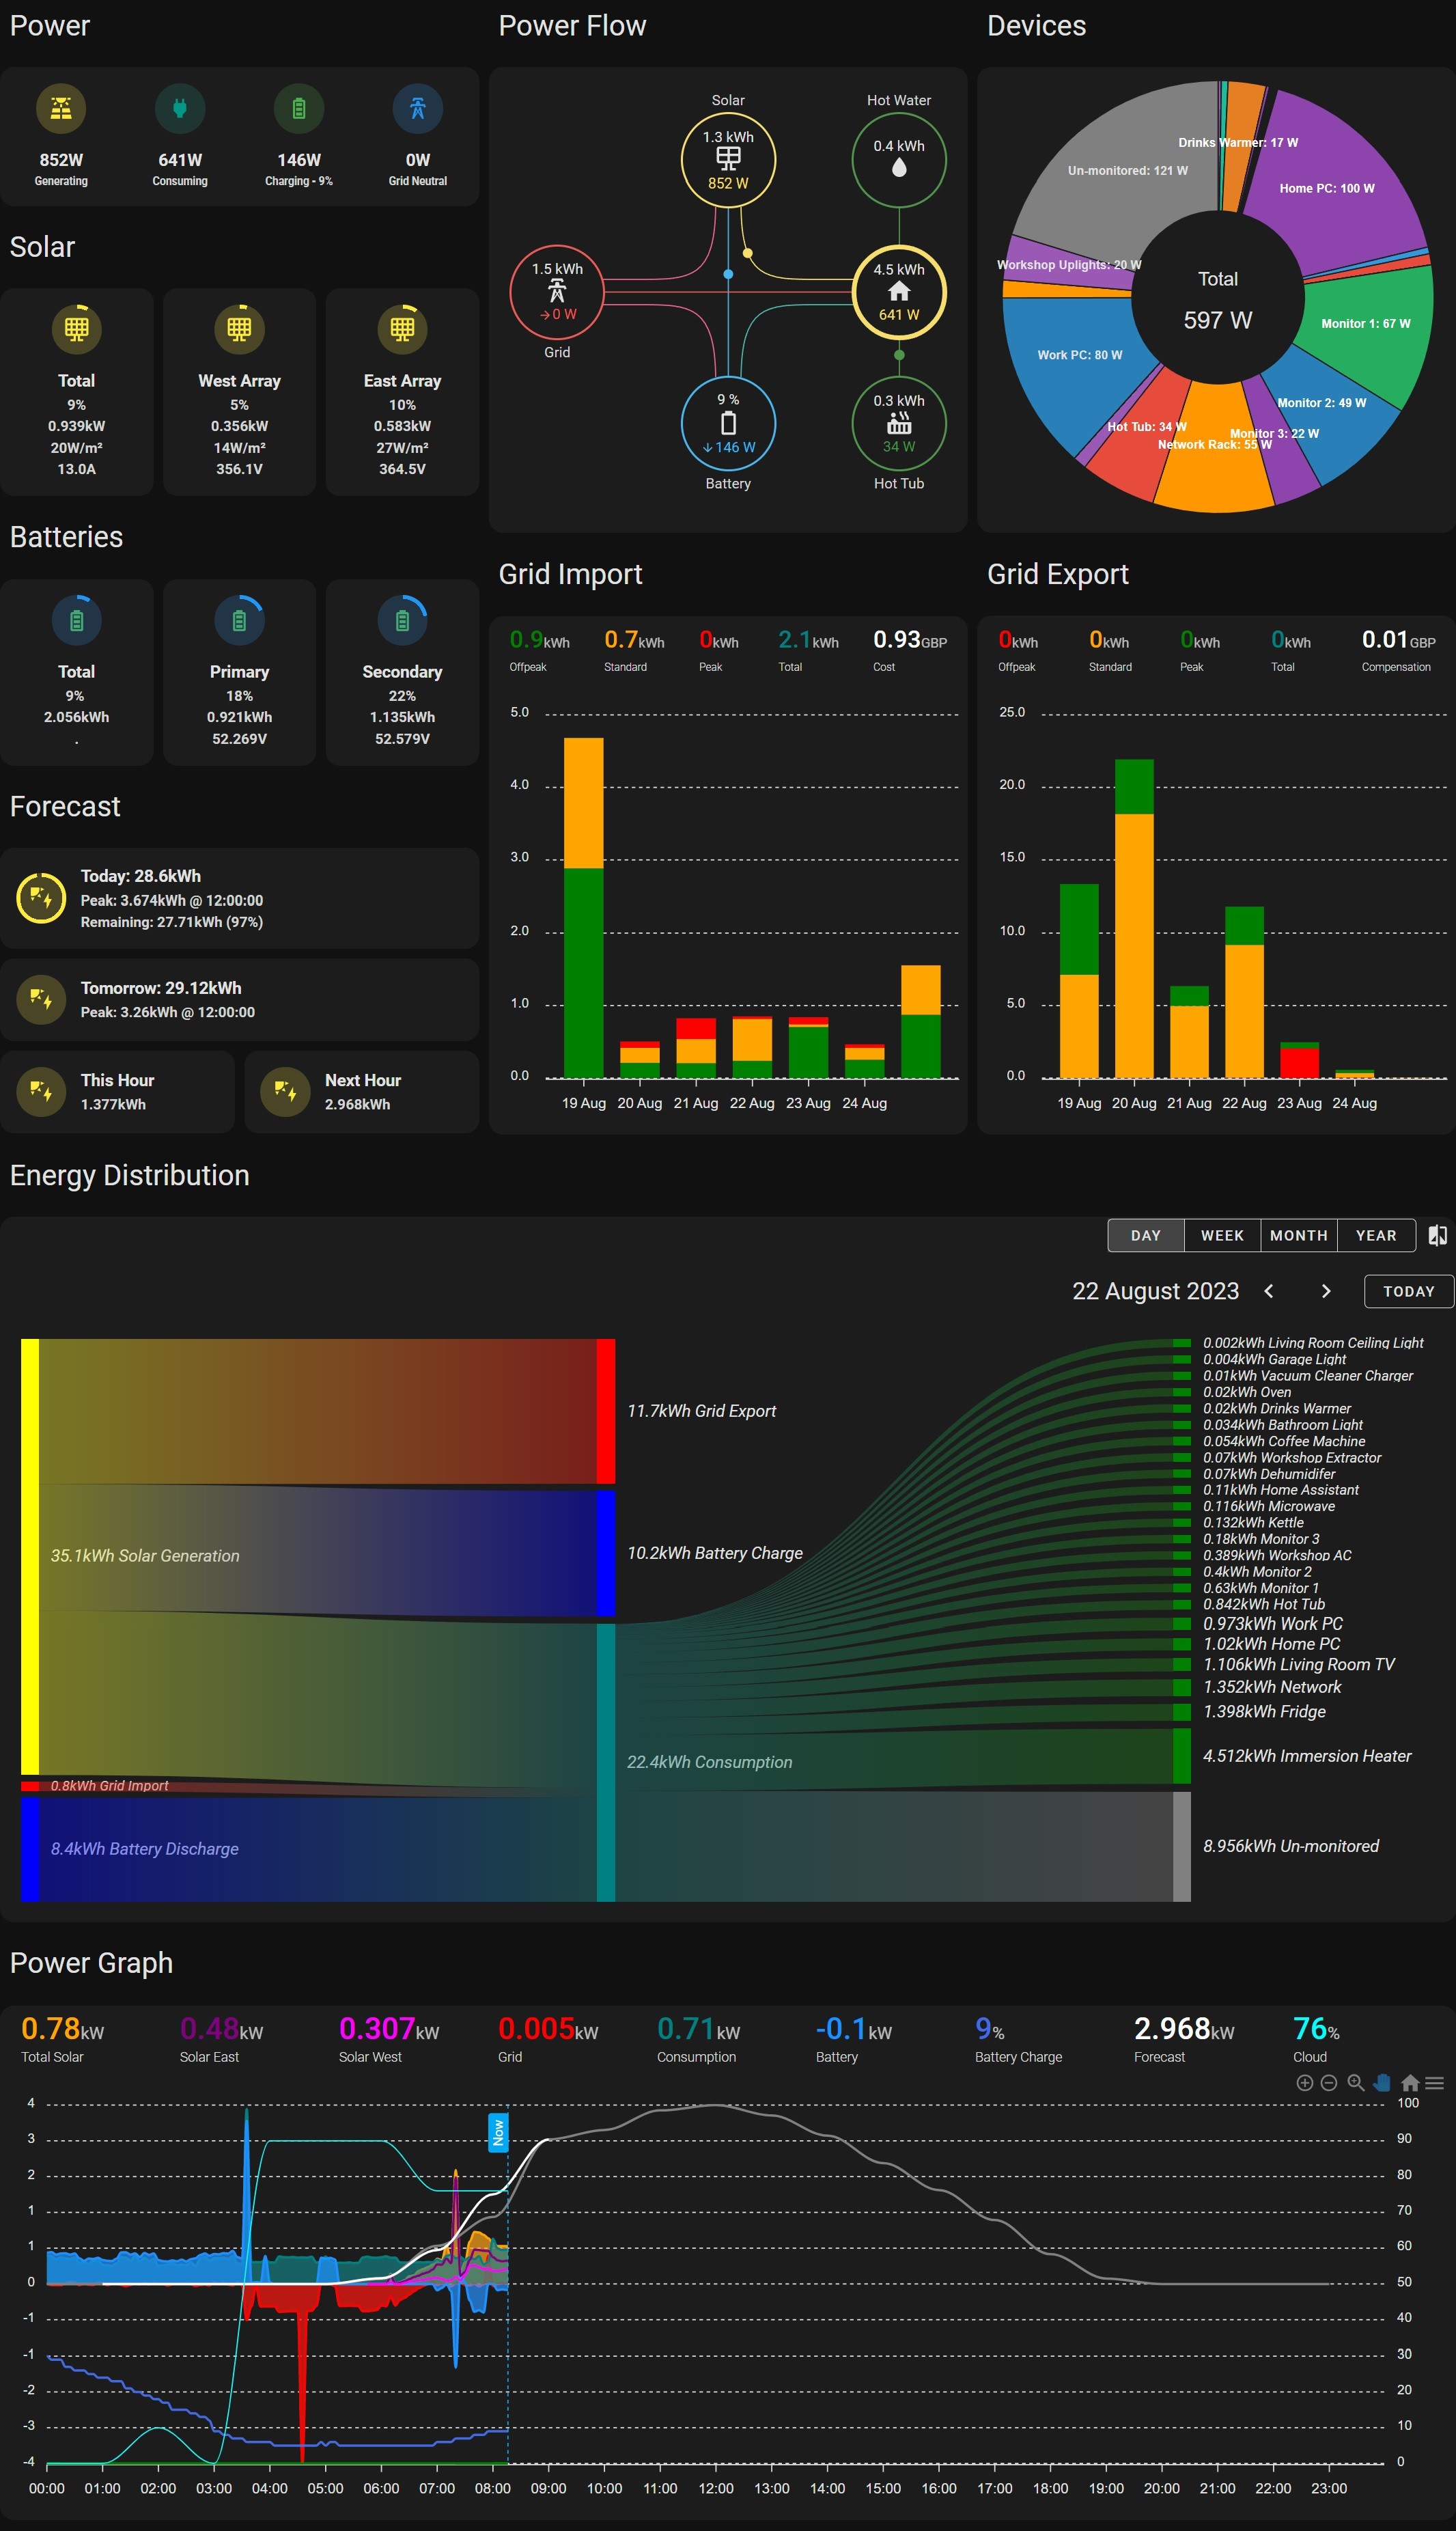
simont Nice, particularly the energy distribution and the power graph at the bottom. I'm just starting to create some sankey charts for stuff, out of curiosity how do you know/differentiate the grid import going to consumption or potential battery charge? Similarly with battery discharge between consumption and potential export?
Phil_H Good point, never thought of that as I don't import or export to and from grid to battery. There are separate power entities in GivTCP so I might make some integration sensors for them add them to the sankey chart instead.
simont never thought of that as I don't import or export to and from grid to battery
there’s always a dribble of import and export to and from the grid as there’s a lag to the inverter ramping up or down. Ours is typically anywhere between 0.2 and 2.5kW a day. Worth including this.
geoffreycoan I'm on it, cheers
Jase1703 yes thats my understanding, im no YAML expert but just found examples that others had shared and worked it out. Happy to share my YAML code if it will help others.
simont Looking into this a bit further, I don't think it's clever enough to do inputs and outputs on multiple sources. For example, if you have both solar and grid import connected to battery, and house load, then early in the day (after an overnight grid charge) a small amount of solar would show as going into the battery, with the rest from grid import, then the rest of the grid import would go into house usage. As there is more solar during the day, that would be used as the link to the battery section (because it's first in the list) and the import would then show only going to the house load.
It's a bit difficult to explain in words, but because there is no way currently to specify the value on each link (solar -> battery, grid -> battery, etc) it just fills them in top down.
https://github.com/MindFreeze/ha-sankey-chart/issues/8 and https://github.com/MindFreeze/ha-sankey-chart/issues/17 are relevant
Phil_H Yes I have been playing with it and struggling to group bits together, I might try doing some sum sensors (all to to grid, all to house etc) and see if that works
I would love to have monitors that differentiate power from battery by where that power came from - so e.g. if you added 5kw to the battery from the grid costing X, then 10kw from solar costing Y(=0?), you can properly account for the costs of using that energy.
The only way I can think of this working is to consider the battery as a tagged FIFO queue, accumulate power in by source and remember not (just) the total power in but the power source those units came from. So perhaps:
fifostart = consumption, fifoend = generation
v
0 0 0 1 0 0 4 2 1 4 3 2   < amount(W)
A A A B A A A B B B B B  < Tag (source + rates etc)
So when you account for draw down of power, you account for them by reading units from the fifo.
You could also properly account for multiple or variable import/export rates this way.
Only flaw I can think of is in accounting for energy conversion losses, where power just 'disappears', and where the input data is wrong (e.g. when battery SoC is recalibrated).
simont how do you get stuff outside the central location, it wants to dump everything in middle of screen on PC and I cant manually move it.
Jellybaby Usepanel: trueand then horizontal stack card
  - title: Power
    icon: mdi:home-lightning-bolt-outline
    panel: true
    cards:
      - type: vertical-stack
        cards:
          - type: horizontal-stack
            cards:
              - type: vertical-stack
                cards:
                  - !include dashboard-components/power_solar_batteries.yaml
                  - !include dashboard-components/power_forecast.yaml
              - type: vertical-stack
                cards:
                  - !include dashboard-components/power_flow.yaml
                  - !include dashboard-components/power_grid_import.yaml
              - type: vertical-stack
                cards:
                  - !include dashboard-components/power_donut.yaml
                  - !include dashboard-components/power_grid_export.yaml
          - type: vertical-stack
            cards:
              - !include dashboard-components/power_graph_sankey.yaml
- !include dashboard-components/power_graph.yamlsimont Is horizontal stack card built in to home assistant? complete noob here, got about 3 hours of experience and that was getting givtcp working lol
Jellybaby Yes it is, if you are just starting out, you are probably using GUI to do your dashboard. Not sure how to add panel: true
simont in 'edit dashboard' there is a edit icon next to the profile name (top of screen) in there under 'view type' you can pick panel (1 card)
simont I like all the actual card details in separate files. Very neat. (mine is just a sprawling file with chaos everywhere!)
simont Like Phil, I also like this - I didn't know it could be done, so will be playing later!
I went to generate an API key for use in home assistant givtcp for teh forecast etc etc but then it popped up with window with load of tick boxes, what do I tick here, everything?
Phil_H Think I managed to get it work, I need it now as I am now force importing at cheap rate overnight
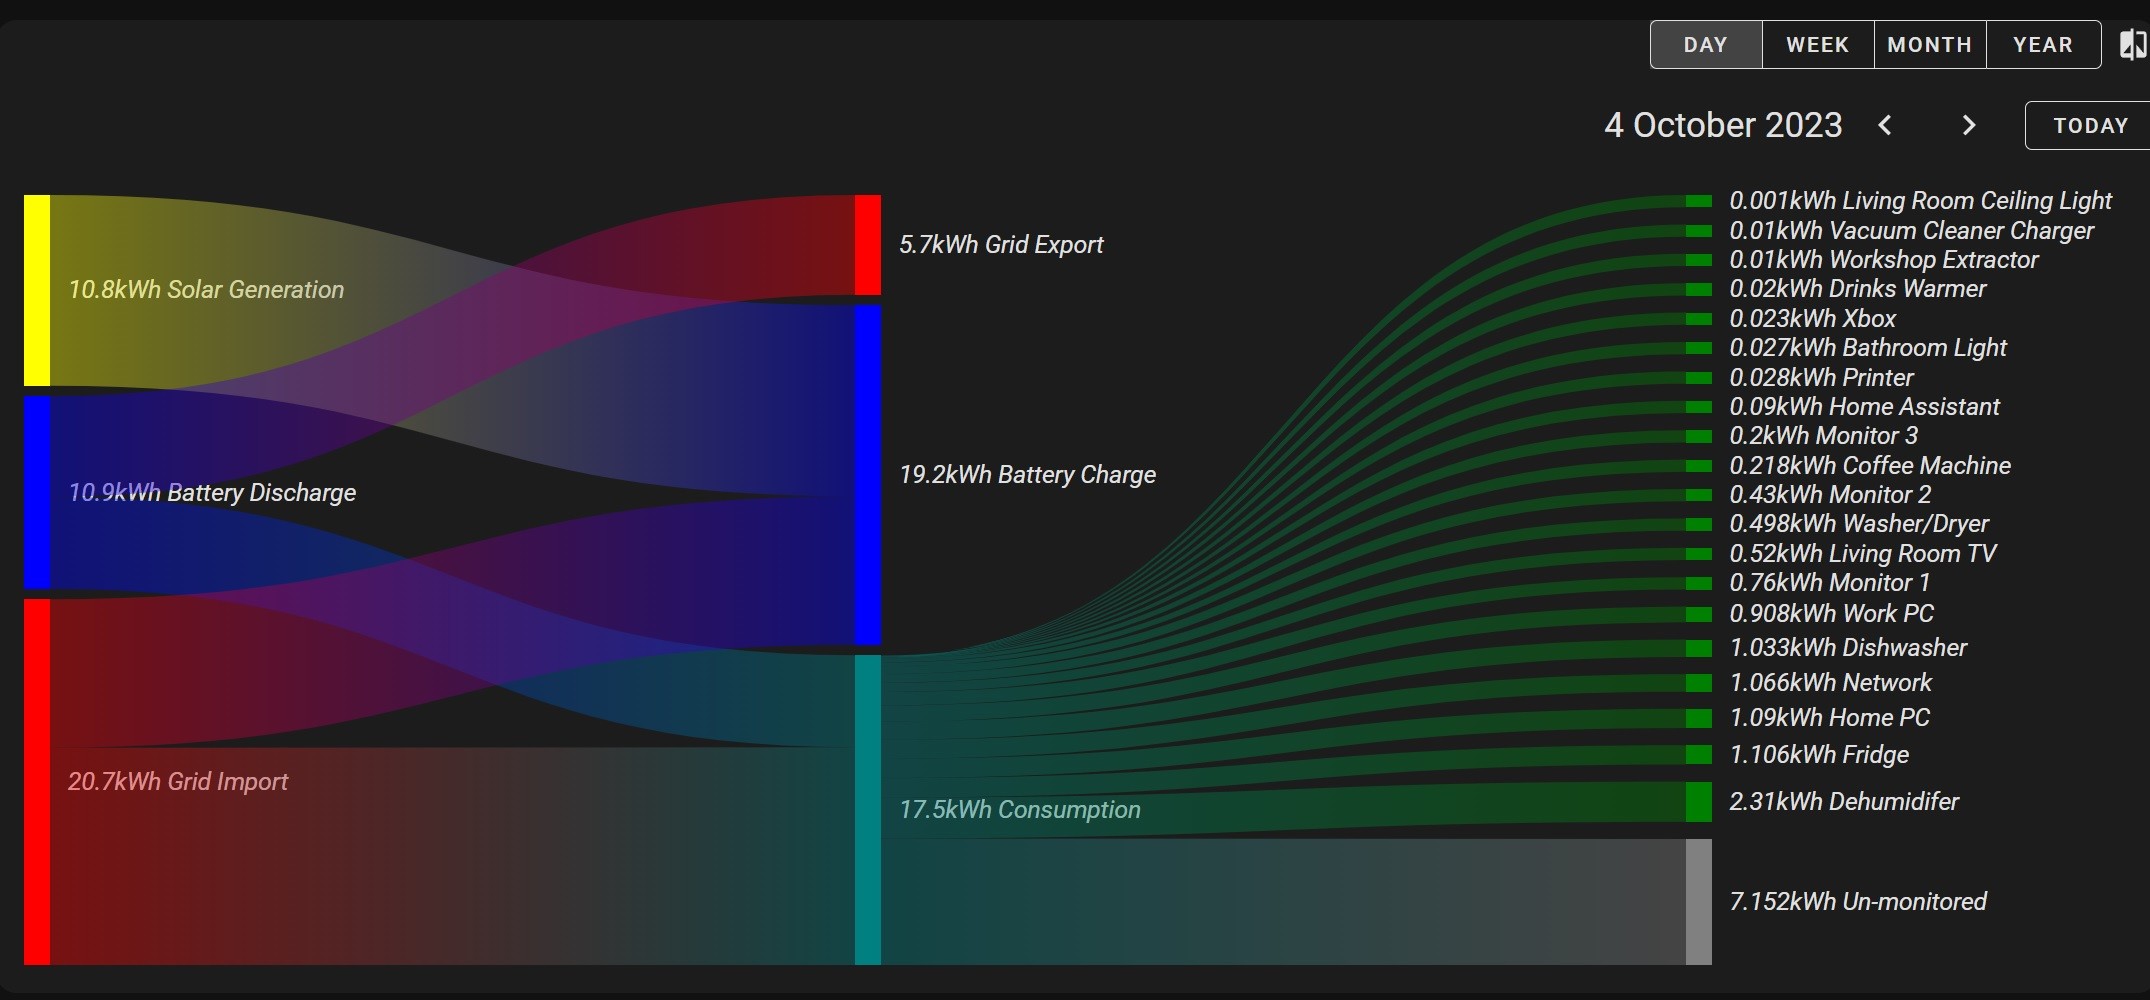
simont Now you need to do the same thing with power, so you can see what is happening liveish!
simont but none of your solar generation goes to your house? Are you just saying it all goes into the battery then out of the battery to get to the house?
simont pretty
Phil_H only on this day as the battery was calibrating
I keep dabbling every now and then with Dashboards in HA. I WANT to like it but lovelace & YAML are a pet hate of mine constantly trying to tie your hands.
Having used Apex Charts before elsewhere the (somewhat cut down) HA version does seem to be fairly useful.
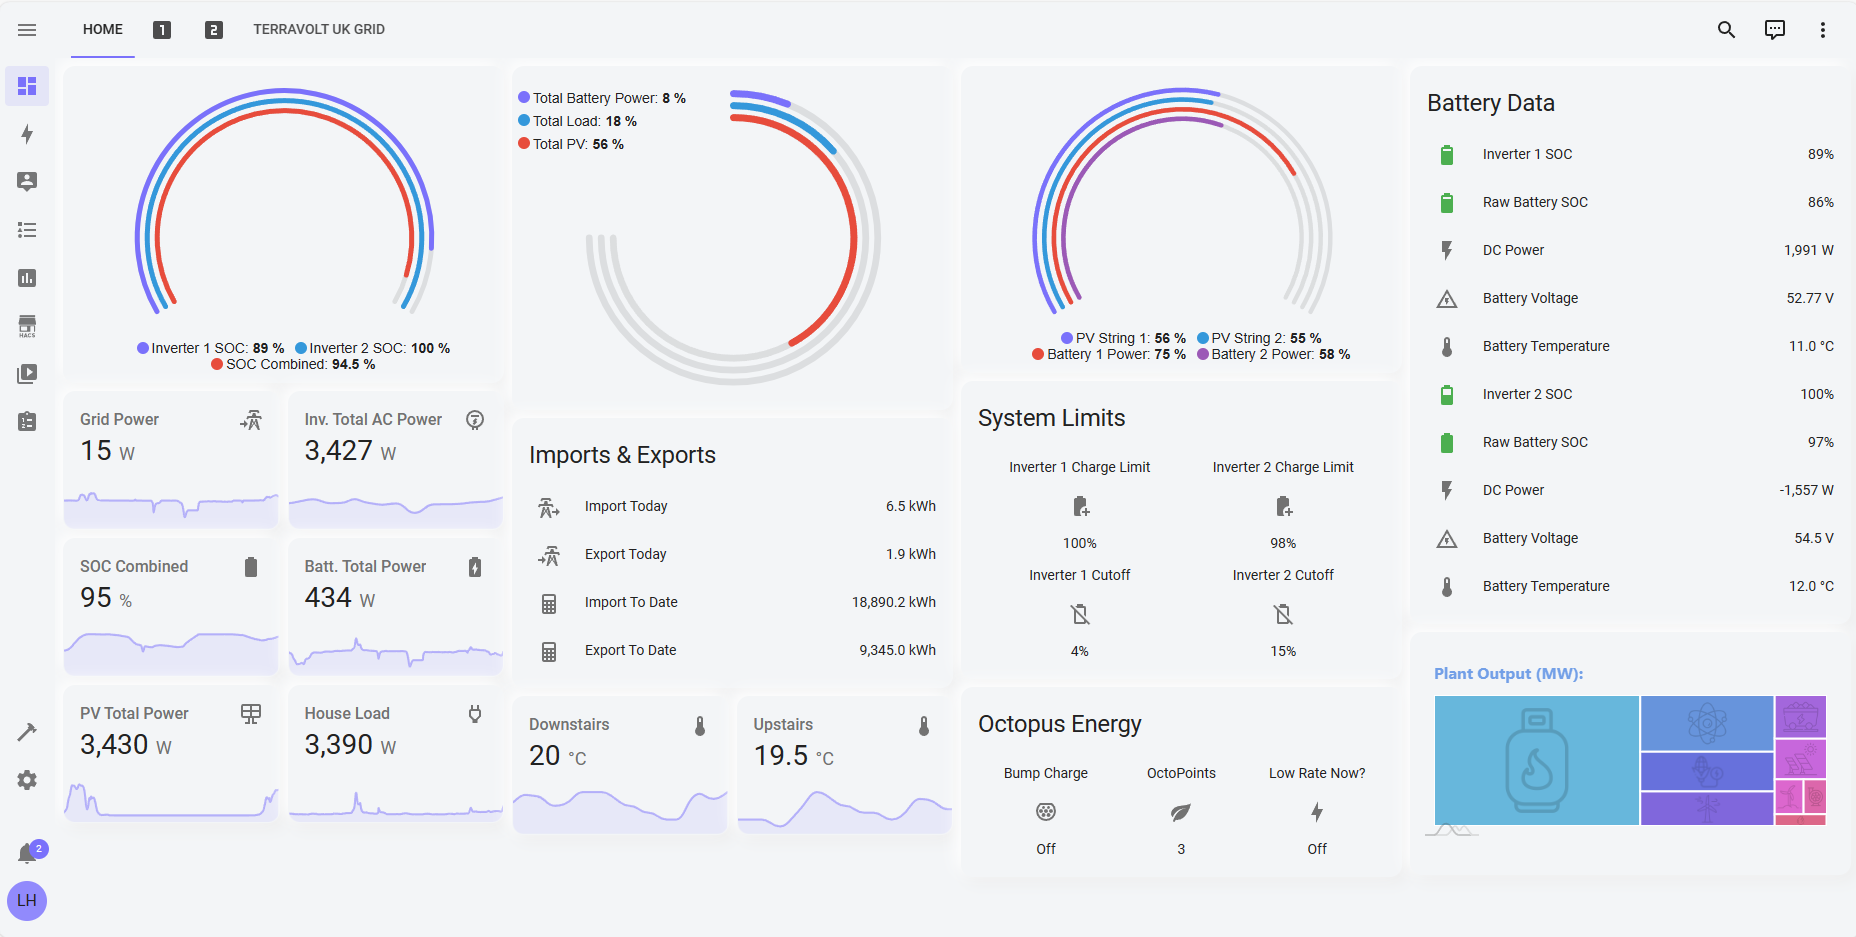
My dashboards are a bit of a mess, spread over several different physical screens and are a mixture of control and display. Need to have a good think about rationalising.
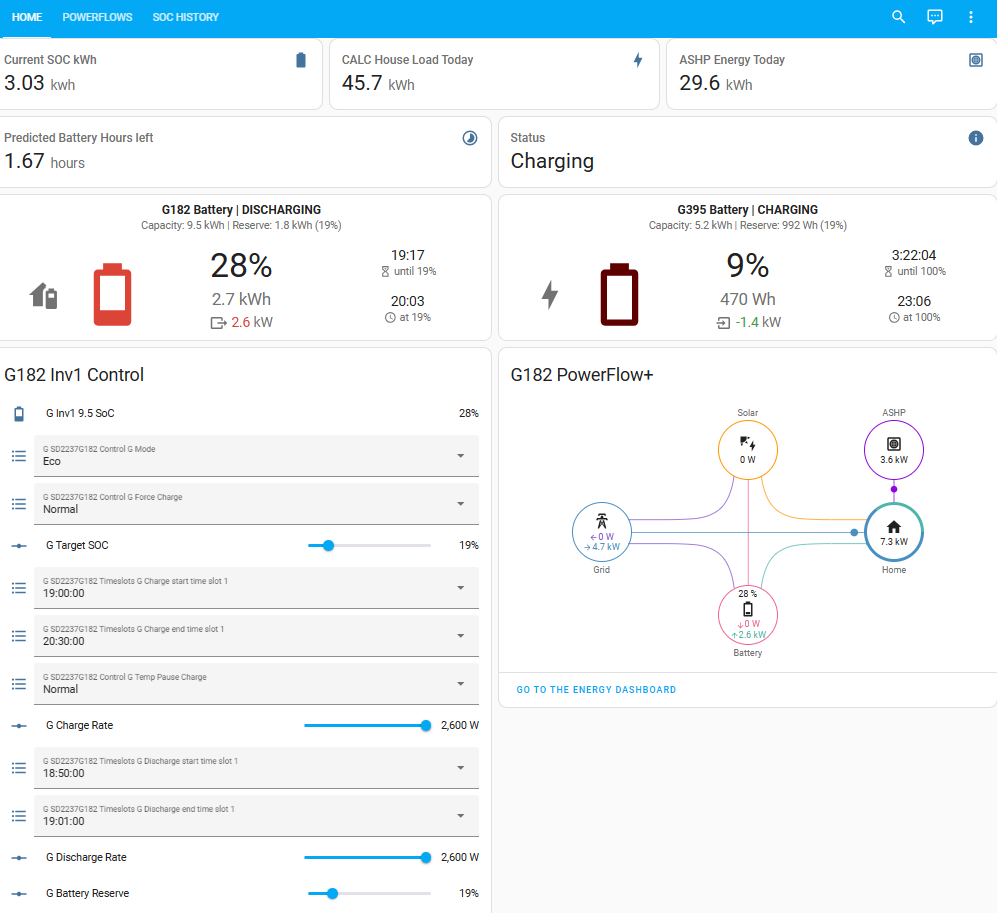
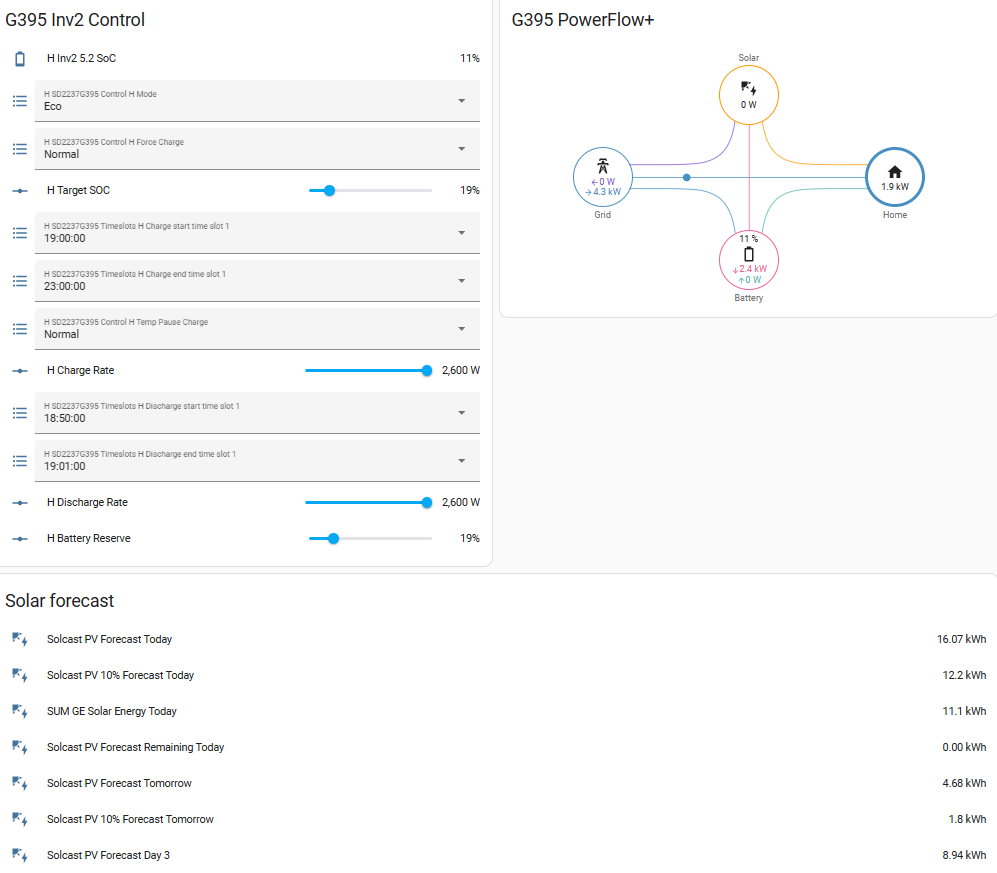
Giv Energy display:
SOC history in % and kWh chart (not tending to look at this any more):
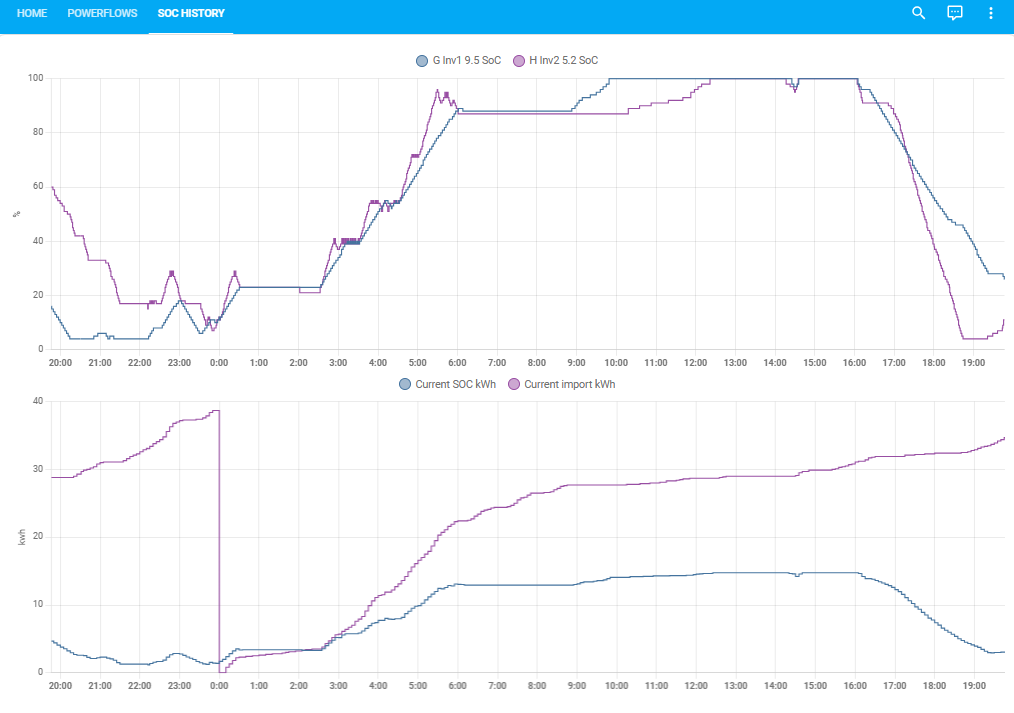
chart giving battery actual soc for last 2 hours and predbat soc plan for the next 10 hours including charging periods, charging power, charge and discharge rates
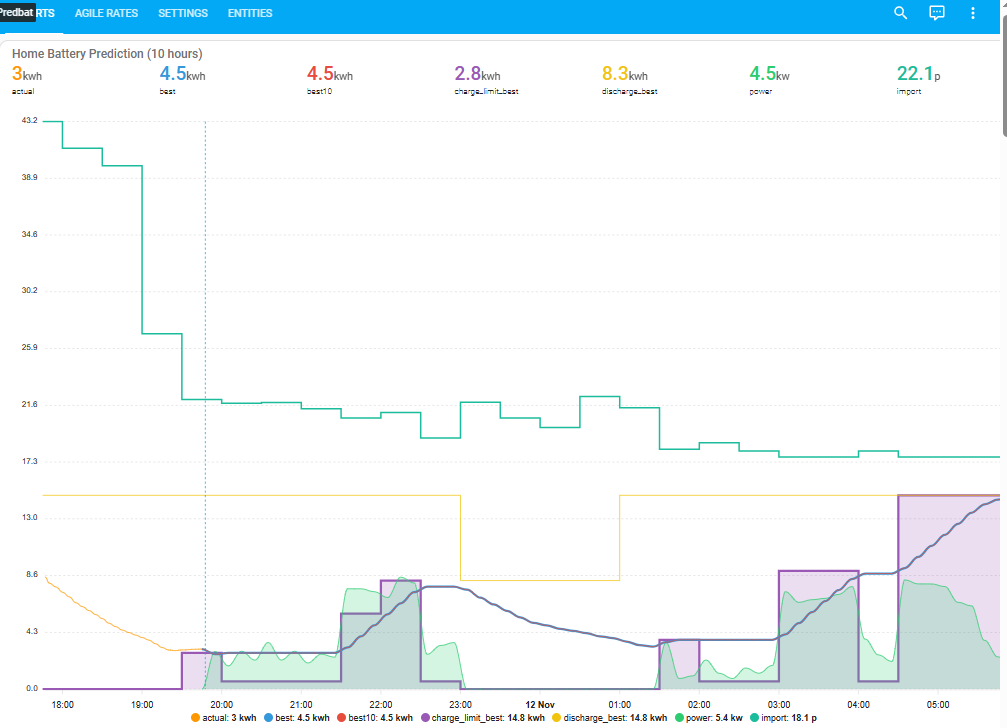
and an agile rates chart giving quick-reference to next cheapest 1/1.5/2 hour blocks and what predbat is planning for the rest of the day
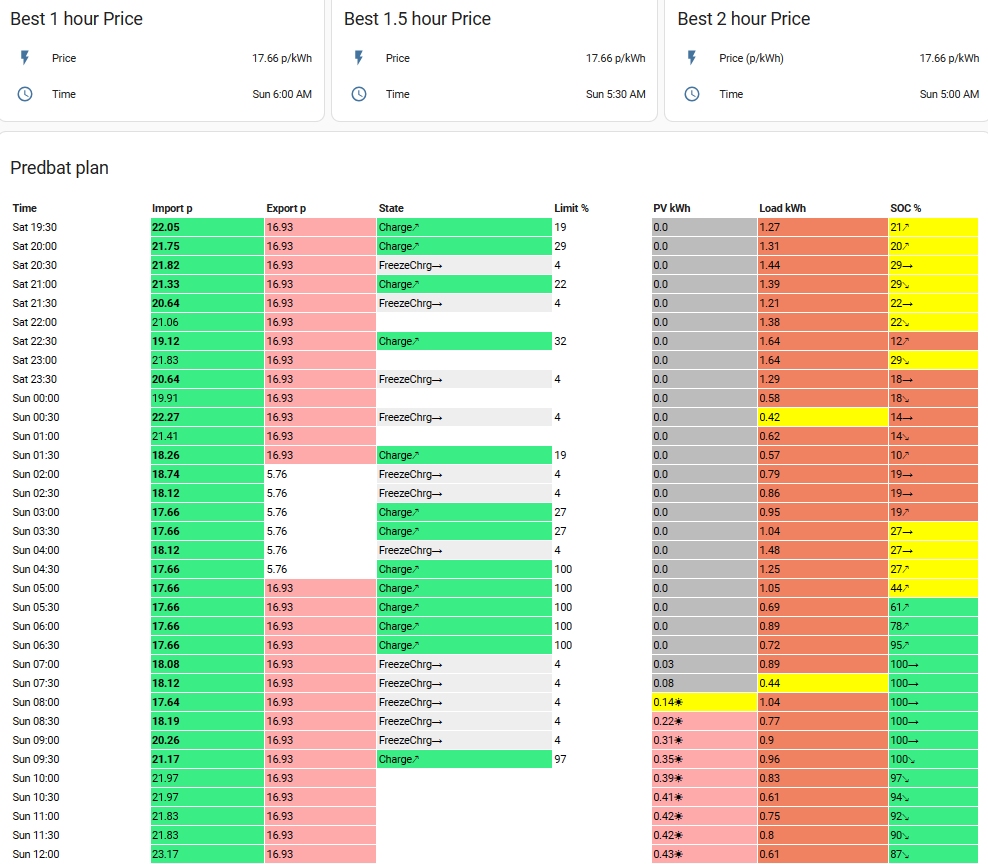
As I said, a lot of info over a lot of dashboards. Plus the HA Energy dashboard as well
I've just created a dashboard using the synsynk power card - its not perfect - the inverter is the wrong one - but there isn't a GivEnergy one at the moment (I've not asked!)
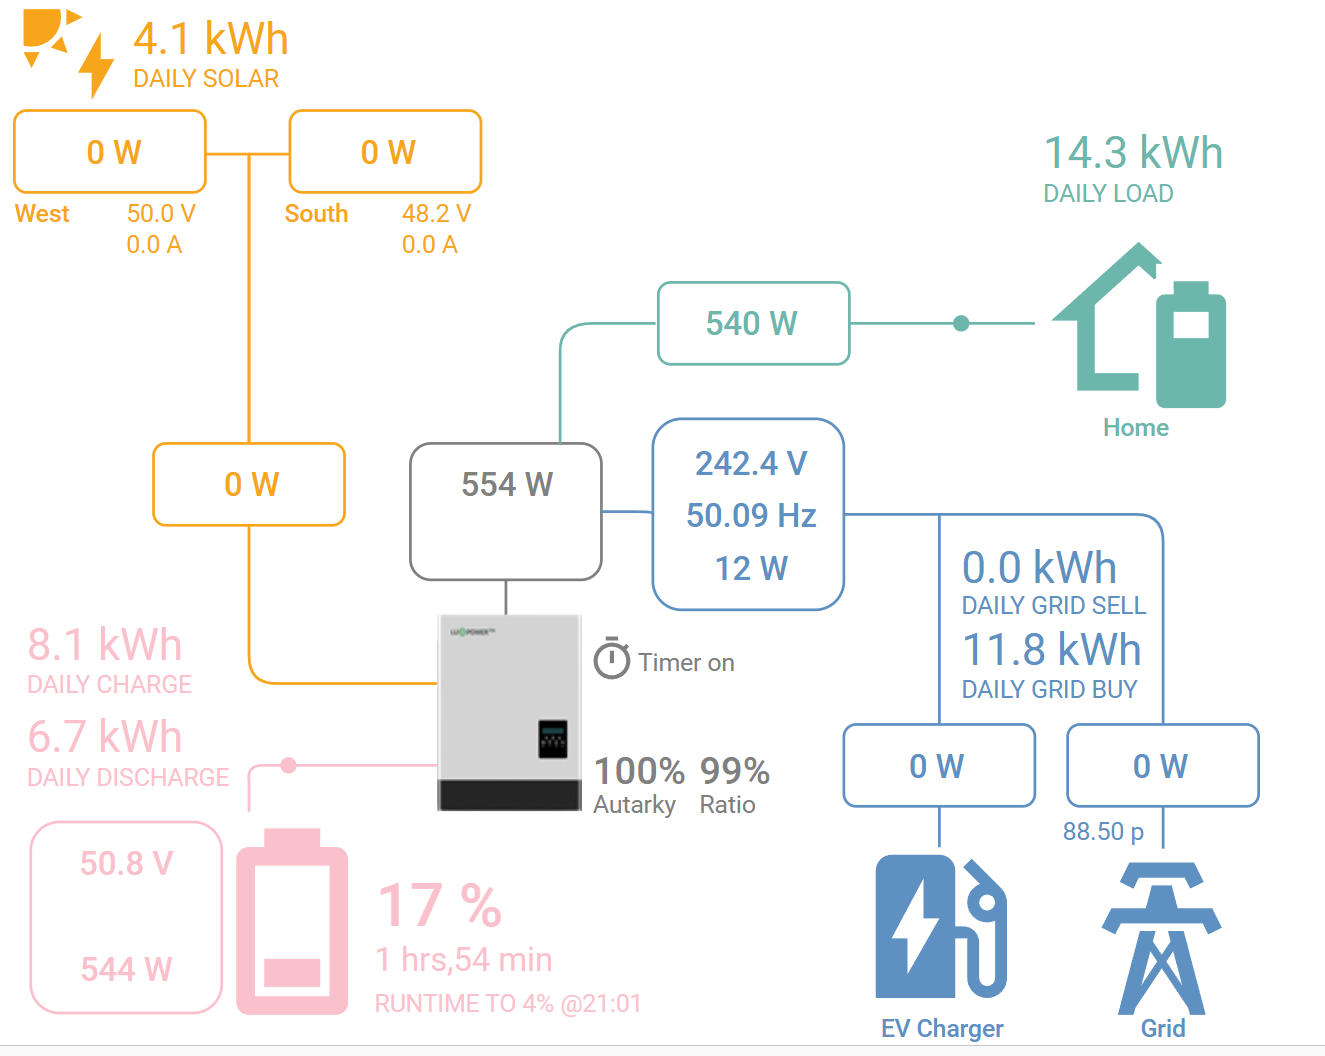
anglefire I have the sun synk card on a tab and keep meaning to have a fiddle with setting i5 up better than I have. I quite like that you can define multiple arrays.
The big thing I’d want to be able to do is to monitor both of my inverters. I did have a “summed up” power flow plus card for both inverters but soon realised I needed to be able to see the individual inverter and battery details. So far power flow plus has been my favourite but needs twice the dashboard space