Plant system Power Graph

12 comments started 2023-03-11 last 2023-03-12
Cards - Power FlowCloud Portal
T
#1 TanRM16

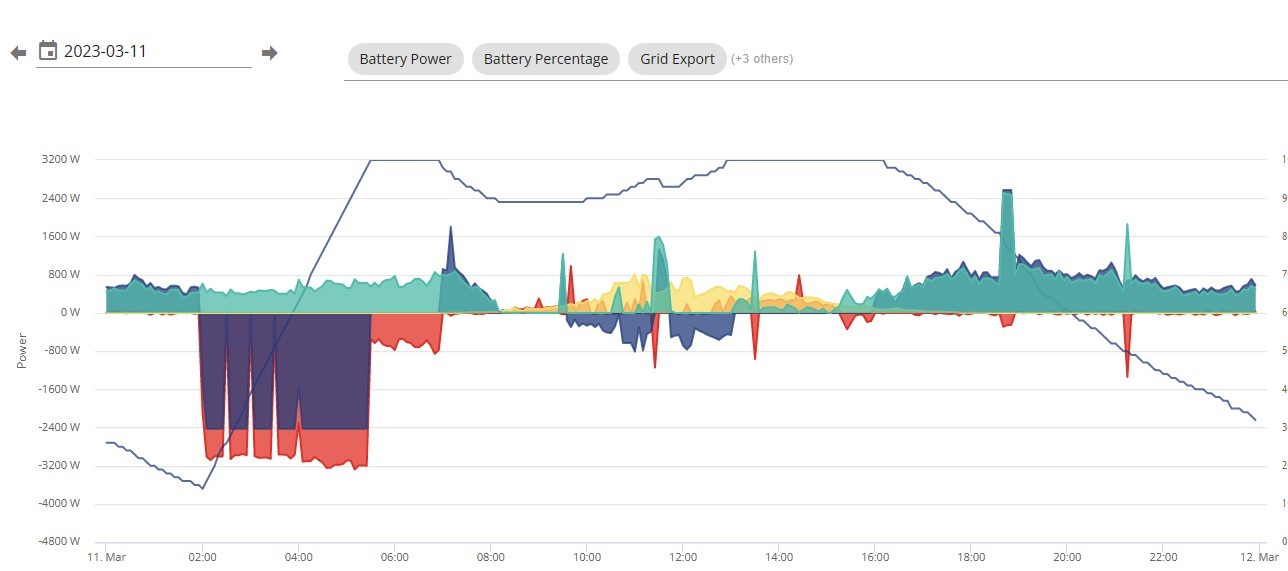
Hi, just had a plant system installed - 2 x 3kw Giv AC inverter - each with 9.5kw Battery configured as Master and a Slave as needed total 6kw output. Received calibration success message from each. Last night, first full night after calibration. However, I noticed during the early hours when everyone is asleep, there is a big gap between battery discharge and the load power shown in the power graph. The total battery discharge is around 950W vs load of 350w. This load 350w is reasonable as this is the usual load before I had solar installed, as measured by my electricity smart meter. So I know this 350w is normal ie usual appliances on standby etc. I am wondering why is my battery discharging 950w ? The difference between 950w and the 350w was not even exported to the grid. I am not in to the early night time, and I can see the discharge is far higher than evening load with no export to grid. I wonder when the extra discharge is going. Has anyone experience or seen such ? I added each load power data from separate battery graph and it does NOT match/reconcile with the total load in the power graph. I added each battery power data from each battery graph and it matches/reconciles with the total battery discharge in the power graph. Could this be a data issue with Givenergy ?
S
#2 SteveCook

The profiles of both lines track each other pretty much exactly, yet one appears almost double the other.
Have you got your monitoring meters in the correct place?
Is something double counting?

T
#3 TanRM16


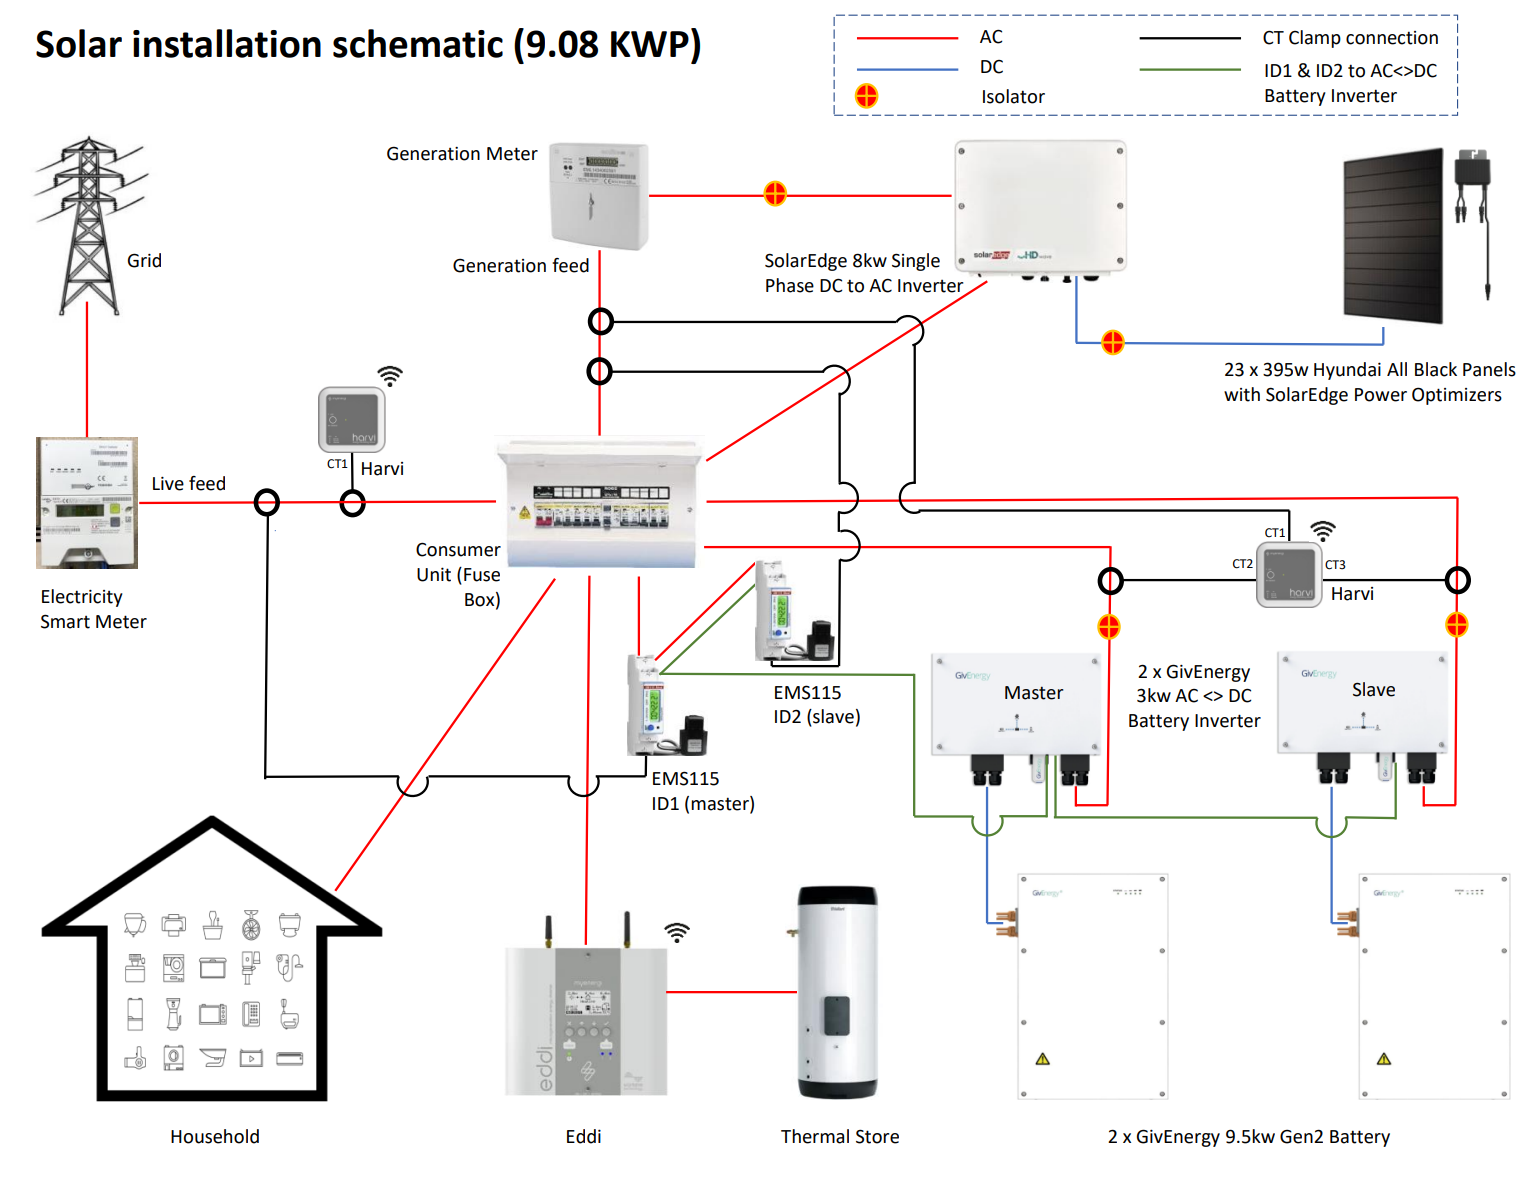
This is a schematic of my installation. I have the slave EMS115(ID2) attached to the EMS115(ID1), and in turn the ID1 is then linked to the Master AC Inverter via the underside port RS+/RS-. The Slave AC Inverter is linked from its RS+/RS- to the Master AC Inverter RS+/RS-. Am told this connection creates a daisy-chain. This is all represented by the green line in my schematic. ID2 is CT clamped to Generation feed, and ID1 is CT clamped to Grid live feed. Yes, I agree with your observation - both lines tracked well but the discharge is more than double the load and there was no export to consume the difference. Strange.

S
#4 SteveCook

That's funny.
Your system is very similar to mine, though I don't have a nice schematic and clever things like Harvi and Eddi, but I have some PV on my GE inverter (single hybrid 5.0 and 9.5 battery)
The only metering difference is that I don't have a slave EMS115 on my solar edge. Can the GE portal deal with the maths?
I just ignore the SolarEdge from my system as when there is no sun, it does nothing, and when there is sun, it kind of deals with house loads (on a quid pro quo and maybe some excess) and the GE just reports the total picture.
I know when there is a lot of sun, my export is greater than the base load plus GE solar generation and that the imbalance is the excess from SolarEdge generation minus consumption.

T
#5 TanRM16

Does your system have a master and a slave ? If not, is it a AC inverter with two batteries ? I went for this set up as I needed 6kw discharge, so 2 x 3kw discharge from each of AC Inverter would meet this requirement. Your battery discharge matches load very nicely. Mine is very ridiculous. My EMS115 is not connected to Solaredge, but is connected to the AC Inverters and CT clamped to Grid live and Generation feeds. Your graph looks sensible. I have also emailed Giv support with this query. See what they say. Admitted, before I installed this system, I did a run thru with Giv who said that I will encounter data reporting issues/anomalies and Giv is working on a fix, no ETA.. Wonder if this is it.

S
#6 SteveCook

Hi
No, one hybrid inverter plus panels, one battery and one EMS115 on the GE system.
The SolarEdge panels and inverter were installed about 3 years ago and I only ever look at the SE app to see that the SE panels are working and what they are generating. I cant do anything to control them so have not bothered with them.

T
#7 ToothyChris

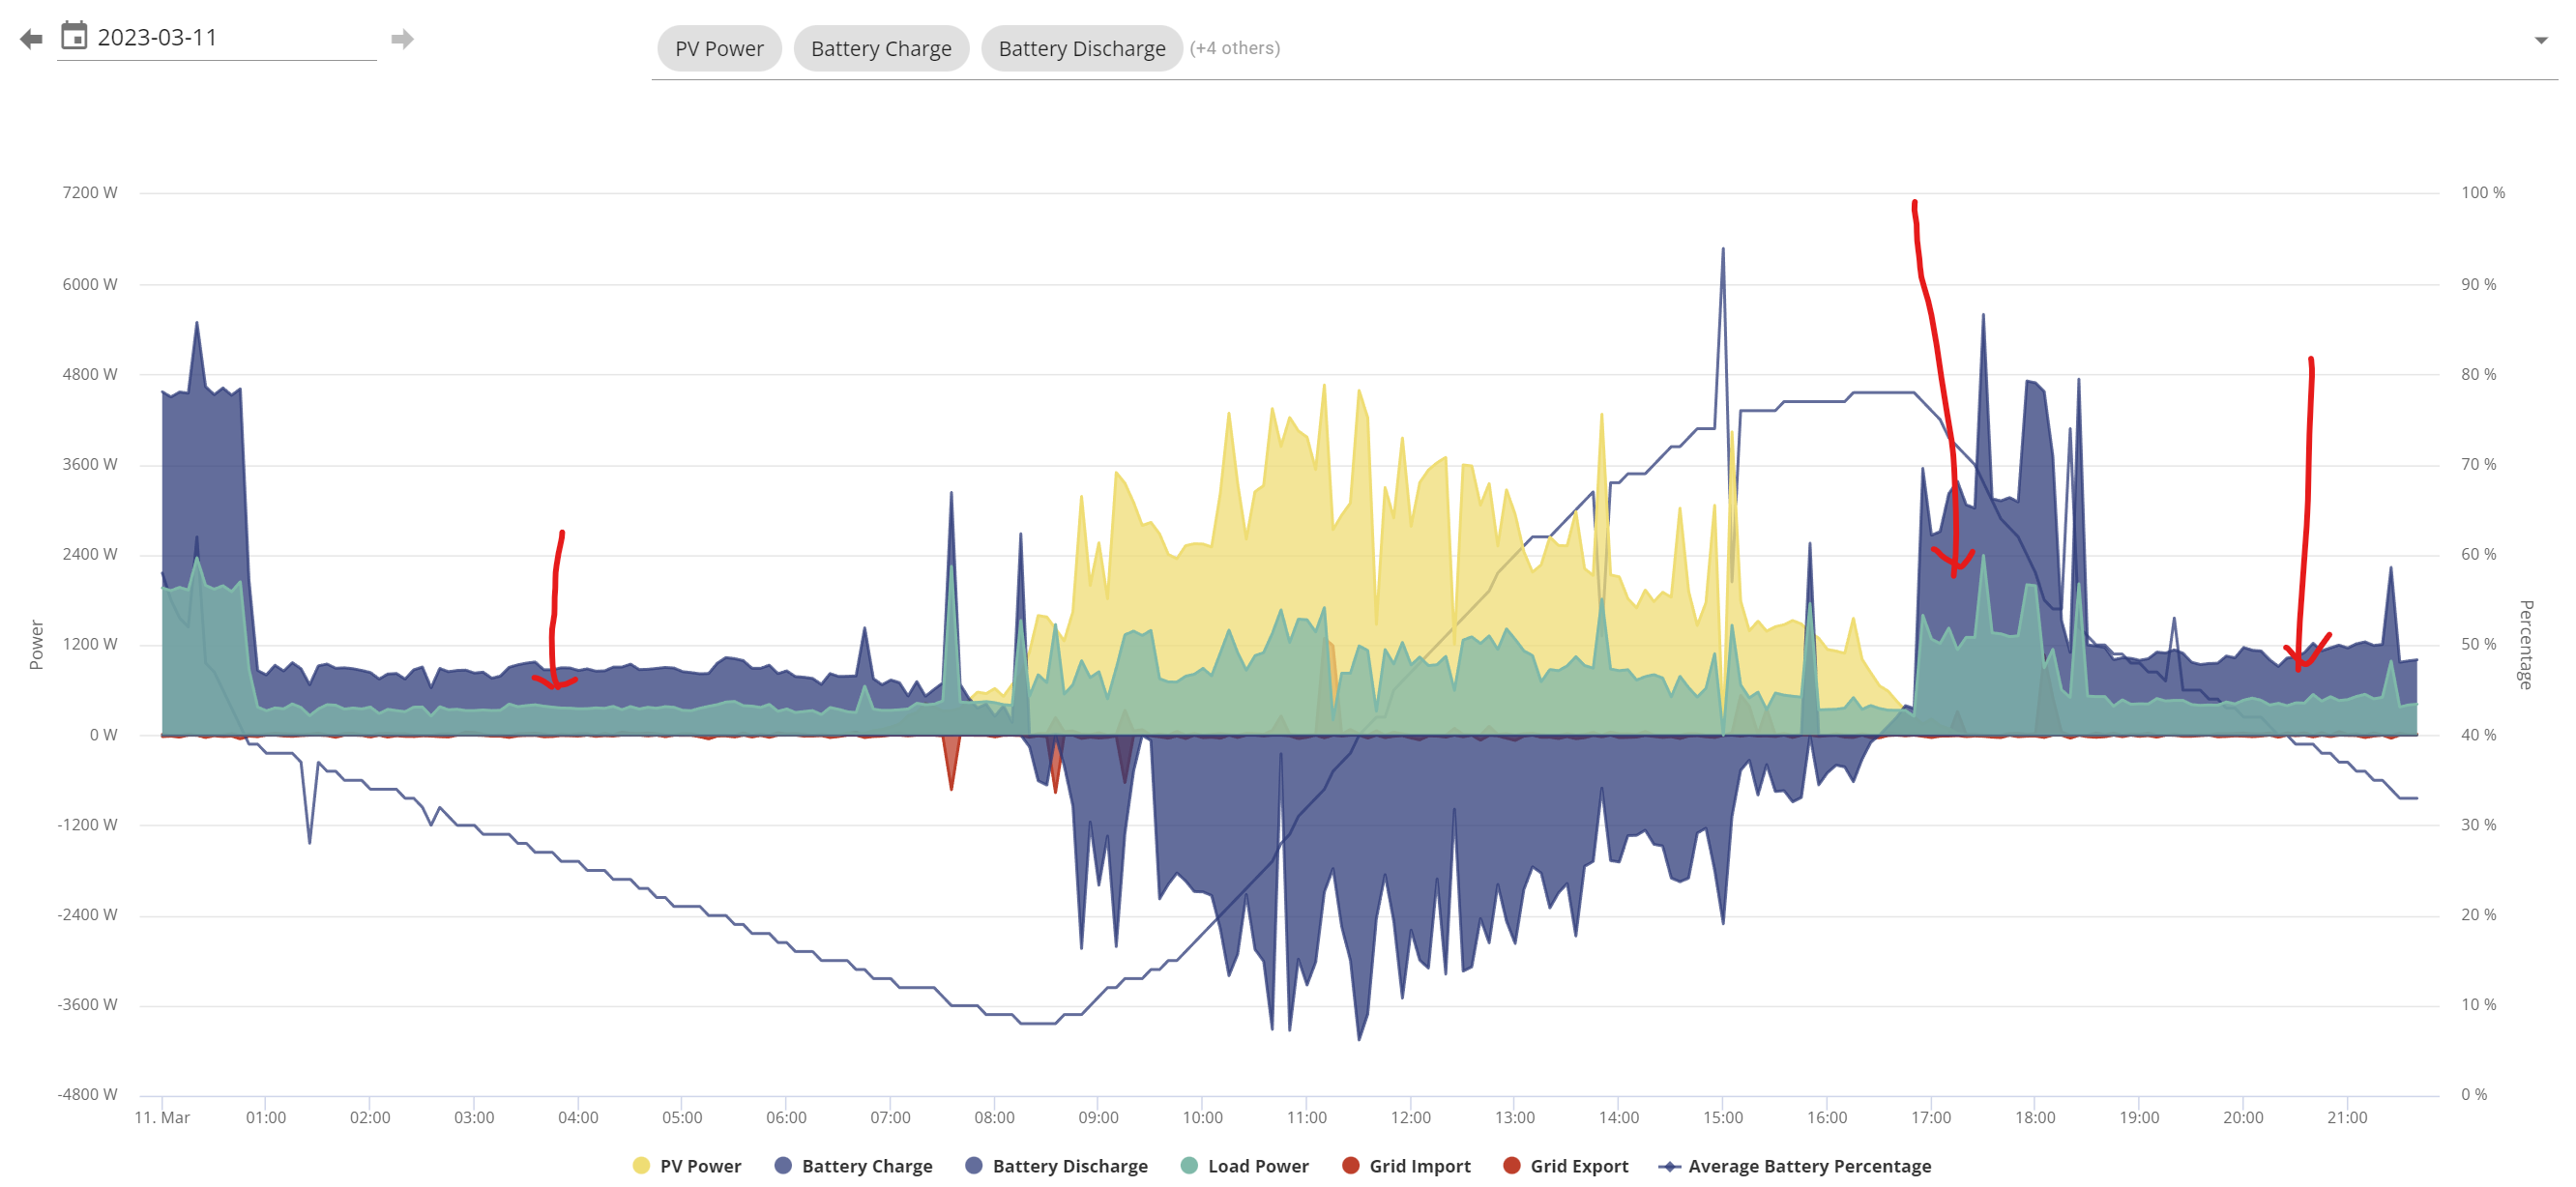
For a system like yours, and mine (i.e. twin AC3 in plant mode), this is normal. This setup is not officially supported by GE and as such, their software is not set up to do the maths properly. I think I am right in saying that the charging (and discharging) of one of the two batteries will also show up as house load (but only about 50% of the value).

This is just one of the issue of AC3 plant systems, but overall the benefits outweigh the problems.

Watch out for cross-charging, where one system will discharge into the other - which wastes energy and unbalances the charge in the two batteries. If you see this happening (look for blue areas both above and below the zero line) you can either re-start the inverters, in the Portal, or try a 'Pause' and then 'Play' after 10s, in the App.

Some of the other numbers in the Portal and App. will also be complete nonsense - with time you will get a feel for which ones are genuine and which are junk.

At some point in the future GE is hoping to release a 'box', which allows for proper communication in multi-inverter systems, like ours. But to be honest, I think that GE has higher-priority issues to resolve at the moment (SOP bug).

Finally, the spikes you see in the 'Average Battery Percentage' line, are where the GE cloud temporarily loses contact with one inverter/battery, so the average simply becomes the value from the other battery/inverter. Quite normal.

T
#8 TanRM16

Chris, thank you so much for sharing your experience, very useful and helpful given we have similar set up. So it seems the data reported does not reflect what actually happens behind the scenes. Now you mentioned about approx 50% of the battery charging will be picked up as house load ....I had a look and did the maths. It think it can explain the unexpected excess in load during periods before everyone goes to bed. For example, during day time when we do not switch on any appliances ie all appliances on standby or switched-off, I see the house load as say 1.8kw vs the usual baseline of 0.3kw, i.e. an increase of 1.5kw which is approx half of one of the battery that is actively charging. But during early wee hours when everyone was asleep, when the battery was not charging, but discharging, the discharge output was 0.9kw, way above the baseline 0.3kw. I guess this observation is as you pointed out the issue with our plant set up.
Thanks also for the tip re battery discharging into the other and how to resolve that. I noted that during the calibration stage when one of the battery got to 100% full charge first and then discharging to the other battery which was slower. Thank you also for explaining the spikes - I was wondering about that too. I am still a 2 day old novice, much for me to learn. Much appreciated and thank you Chris. Regards, Lenny.

T
#9 ToothyChris

TanRM16 No problem Lenny,

There is a lot to learn and get used to, as the system will not always do quite what you expect it to, and will sometimes throw a wobby fit and need some attention.

I tend to use the App (in Home mode) for a moment-by-moment (i.e. 10s snapshots) view of what is happening, but the graphs in the Portal to see the general trend, over time.

The batteries will get out of step, in terms of SOC (since one generally charges/discharges faster than the other), which is usually fine and is normal. But just remember that if one is full then your charging power will be halved (if you have full sun, for example, you end up exporting). And conversely, if one is empty then your discharge power also gets halved (so you end up importing some power). So it's worth trying to keep them broadly similar, using the individual controls you have in the Portal.

Welcome to the crazy world of GE. Sometimes you will love it and will bore all your friends with it. And other times it may drive you mad.

T
#10 TanRM16

I see. Thanks Chris. I didn't realise you can use individual controls in portal to pause/resume battery charging. I had a look but could not seem to find it. Since I am new to the portal there are many terminology / terms which are still gobbledygook to me right now, so am a bit hesitant to click here/there. If you do have a spare moment, please can you let me know where the appropriate pause/resume buttons are. I can get to the inverter remote control page. Also in the App I have a play button in the middle which when will let me resume/pause ..just that I am not sure if it applies to both batteries or not. Cheers..

T
#11 ToothyChris

Yes - confusing (and sometimes different) terminology for the same things, in the two systems (App and Portal). In the Portal you can select Inverters on the left, and then click on 'remote control' icon on the right - for each individual inverter. This is where you get that individual control, if you need it, once you feel a bit more comfortable with the system.

A 'Pause' in the App. is essentially setting the 'Battery Charge Power' and 'Battery Discharge Power' to zero, but it does it for BOTH inverters at the same time. But it is a convenient way to stop the cross-charging. And a Play just puts them back up again.

T
#12 TanRM16

Thanks Chris, much appreciated.