Hi. First time on here. Solar panels and battery commissioned today so I'm starting to look at the data from the system. It's 10:30pm so obviously the array is idle. The dashboard says I'm consuming LESS than the amount my battery is discharging BUT I am still importing a small amount from the grid! Why? Surely if all my needs are met by the amount stored by the battery then I don't need any power from the grid do I?? Secondly my battery is now at 31% down from 100% earlier in the day. Should I top up to 100% with a scheduled overnight charge as this will be using cheap rate electricity? Nb just looked again. Consuming 245w, battery discharging 244w BUT I am importing 22w ??? Doesn't add up!
Understanding dashboard figures
Have you understood any advice given at installation about the battery calibration cycle?
Have you received a "notification" advising that the battery calibration has been completed?
From one newbie to another welcome to the mysterious world of PV + battery living.
Help on this site is a great support resource.
jimgardner Welcome aboard. I think you may get a lot of advice here but it would be very useful if you could provide a bit more info. to keep it more relevant to you. Inverter? PV Panels? Battery? and electricity supplier, as advice for Octopus customers is different, are all useful to know.
Best advice for a day or two is to get used to what 'normal' looks like and have a read through some of the topics in here. Variations in some of the levels are normal to keep the system running and as what you see is a snapshot they don't always 'add up'.
L174559 Yes I received notification that the system had been commissioned and that battery calibration had completed at around 5pm yesterday tea time and I was looking at the dashboard late evening. It will take some getting used to but these were just initial observations as I was quite confused to see the system allegedly generating more energy thatn the house was consuming BUT I was still importing from the grid!
SilverArt Hi thanks. The system comprises of : 13 JASolar panels (4,357kwh per year), GivEnergy 3.6 kwh Hybrid Inverter and GivEnergy 5.2kwh battery. All installed by a fabulous team from Octopus who are also my energy supplier! I also have an Electric Smart Meter
jimgardner OK, A common newbie problem is immediately believing everything they see on the portal.
The headline numbers on the portal are a snap shot that may be up to 5 minutes ago. Use th app in local mode and it's more immediate at 10 seconds.
Always watch more than one 10 second period to get a feeling for what is happening.
You will frquently see both import and export when you are not expecting it. This is down to the inverter reaction time.
Try this:
Watch the app in local mode for a minute or so.
Whilst still watching put the kettle on.
I bet you see a brief period of Import (unless your solar is a full generation). This is because our friends the electrons respond to demand immediately. The inverter will see this but take a few seconds to ramp up discharge to meet the new demand.
Likewise, on days with sunny periods the sun goes in and charging stops. Sun comes out and generation jumps to max and you might see brief export until the inverter ramp up charging to nab the solar power.
jimgardner I agree with cluelesscris and I'll let the Octopus users take over at this point (I'm on a fixed tariff until November) as there is a wealth of experience with Octopus as well.
Whether to charge overnight or not depends on too many factors to give a definitive answer. In my case, I have 2kW PV and a fairly high base load, so the PV alone is not enough to charge the battery fully even on a sunny day. I charge overnight in my Octopus Go cheap period to an SOC target which is 100% at present but now we're getting in to spring this will be adjusted down on some days (by a python script, based on the Solcast prediction for tomorrow's PV generation). You'll get a feel for how much you might want to charge overnight after you've used the system for a while, but it will definitely vary through the year and with the weather and your consumption. The other point I'd make is that even if you look at a point in time and read all the registers directly from the inverter, the numbers will not necessarily add up - they are stored with one timestamp but I'm pretty sure they are not read by the inverter at exactly the same time, so it's best to look at a few samples to get a clearer impression of what's happening, and not get too hung up on the readings at any specific moment.
The low grid import figure (you quote 22w) is effectively just the grid & the inverter “communicating” with each other, as it’s a very small amount it is almost negligible. The grid will always (until Inverter software is improved) always be looking quicker to react to demand.
idrobbo The grid will always (until Inverter software is improved) always be looking quicker to react to demand.
Call me a pedant but the grid does not respond. When you switch the kettle on, it is supplied by the grid as the inverter output is fixed at the previous value. The inverter detects grid import and ramps up output to reduce it. When the kettle boils, the excess load is shed to grid which the inverter detects as export and ramps down to reduce import/export to zero (at least in ECO mode).
The new inverter firmware is said to respond faster, but since it will overshoot both on ramp up and ramp down, the energy balancing this will likely be no different than with the current response times. There's a balance to be struck between fast response times and inverter instability. If everybody fed from a distribution transformer had a very fast responding inverter, the local grid could have some hairy voltage swings. Maybe a slower response is a good thing?

On a different aspect of the dashboard figures. Perhaps user error on my part. But, no smart tariff here and waiting for smart meter to be installed. So, single p/Kwh here. But, i manually set up our fixed tariff rate and can see the estimated cost of the lecky we import from the grid. But, i can't see any estimate of how much we have saved based on solar and battery to the house. Is there something i am missing or is it in the add to features list for the portal ?
Maxwell On the "Energy Graph" card you get a quick visual for a day, all I look at really is how small 'Grid to Home' is,.
In 'Reports' in the portal (bottom of the left hand menu bar) you get a more detailed graphic & detail for whatever period you want, including CO2 saved and what your cost would have been without solar based on your entered tariff details.

Maxwell
you can also select weekly or monthly reports to be emailed to you in that section.

@SilverArt & @positor1 Thanks for the replies. As suspected a user error on my part and hadn't really looked at those reports.


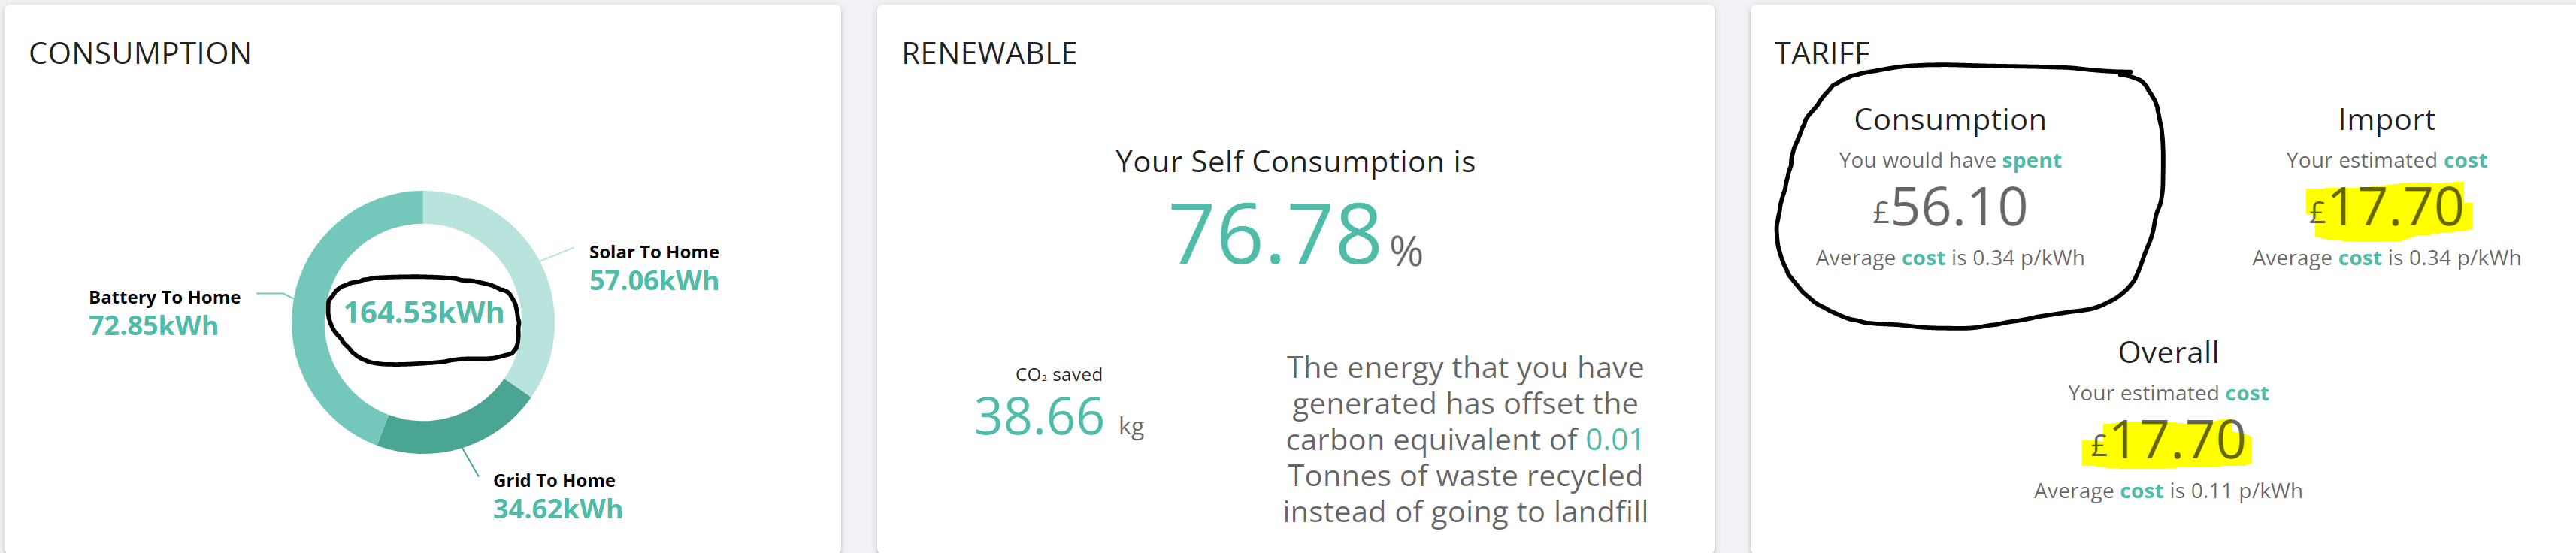
Surely my "consumption" saving is the total of battery to house + solar to house = 72.85 + 57.06 = 129.91 @ 0.341p/kwh = £44.29 saved. But as it is shown the saved amount is the toal consuption 164.53 * 0.341 =£56.10 (but this includes the grid to house cost and surely that isn't a sving but an actual cost) ??
And i don't understand the overall cost shown at 0.11p which is the the same as the grid impart cost @34.1p/kwh. What am i missing ?
Hi Jim, Likewise my system has Gen 1 inverter and 10.4 battery. You may see that the system seems to feeding the grid when viewing from your hone but this is not being shown to be the case on the graphs that I can see on my laptop.Even with my battery at 100% I still seem to take from the grid using the Eco dynamic control. Not using the Eco control leaves my battery isolated at times and supplies the entire amount required from the grid even with the battery at 100%. So it feeds from the grid when it shouldn't and takes from the grid when it shouldn't. If you ask it will likely be a known error and waiting for Beta version of new software to be tested: like so many other unfathomable problems within the system. None of my timers work either, so if I want to take advantage of lower prices to charge my battery I have to get up. Sorry my disgust and disappointment is showing.
Just an observation my Zappi came with a comprehensive and technically detailed user manual.
With Givenergy I received nothing no info no explanations no instructions just the app and I even had to ask on here before I found the online Web Portal.
Is this usual for Givenergy customers?
If so there must be an opportunity for some experts on this forum to produce a Givenergy for Idiots type of manual.
My installer gave me a handover book.
There's the kB site (Google kB GivEnergy)
And there's the unofficial wiki - search this site for wiki
Tried the KB site not that impressed even the glossary is empty!
And updates seem to be growing beards!
L174559 Sadly this is quite normal for GE customers.
Paul_johnson1
Just to cheer you up without any noticeable action my battery control issues seem to have been resolved. It was suggested by my installer that Givenergy did a firmware update on my battery/inverter which appears to have fixed the issue. I have also updated the App version but there still is a discrepancybetween different pages of the dashboard app. EG. The battery SOC on the dashboard front page =76% but if you select it the next page shows the same SOC but if you select "more information" the SOC is 95%??? So still some explanation / fix required?
Maxwell Surely my "consumption" saving is the total of battery to house + solar to house = 72.85 + 57.06 = 129.91 @ 0.341p/kwh = £44.29 saved. But as it is shown the saved amount is the toal consuption 164.53 * 0.341 =£56.10 (but this includes the grid to house cost and surely that isn't a sving but an actual cost) ??
And i don't understand the overall cost shown at 0.11p which is the the same as the grid impart cost @34.1p/kwh. What am i missing ?
A bity late to the party on this one.
The answer is "sort of".
Your "Battery to to house value" COULD be some energy that has been generated by Solar or energy that has been imported into the battery from the grid.
So better to generate a report and look at the amount of your Solar to House Value + Solar to Battery Value. Then multiply these by the cost/kwh of your energy to derive a saving.
To go one step further if you have an SEG in place then you could also add in the amount of energy exported @ your export rate to the total value above.
Also worth remembering that all figures from GE portals are approximate. They are snapshots of every few minutes and there can be missing data if there is a connection issue between GE Cloud and your GE Portal.
It gets a bit more fun when you add multi-rate tariffs into the mix. This is what I use
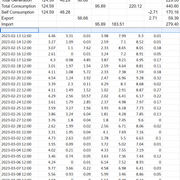
Report Generated from GE Portal

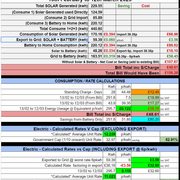
Then a basic google docs calculation


dragon2905 Get the issue with the bit about grid to battery won't be a saving and the limitations of the GE report vs the detail of the underlying data. But, the GE report shows the split between solar to battery and grid to battery.

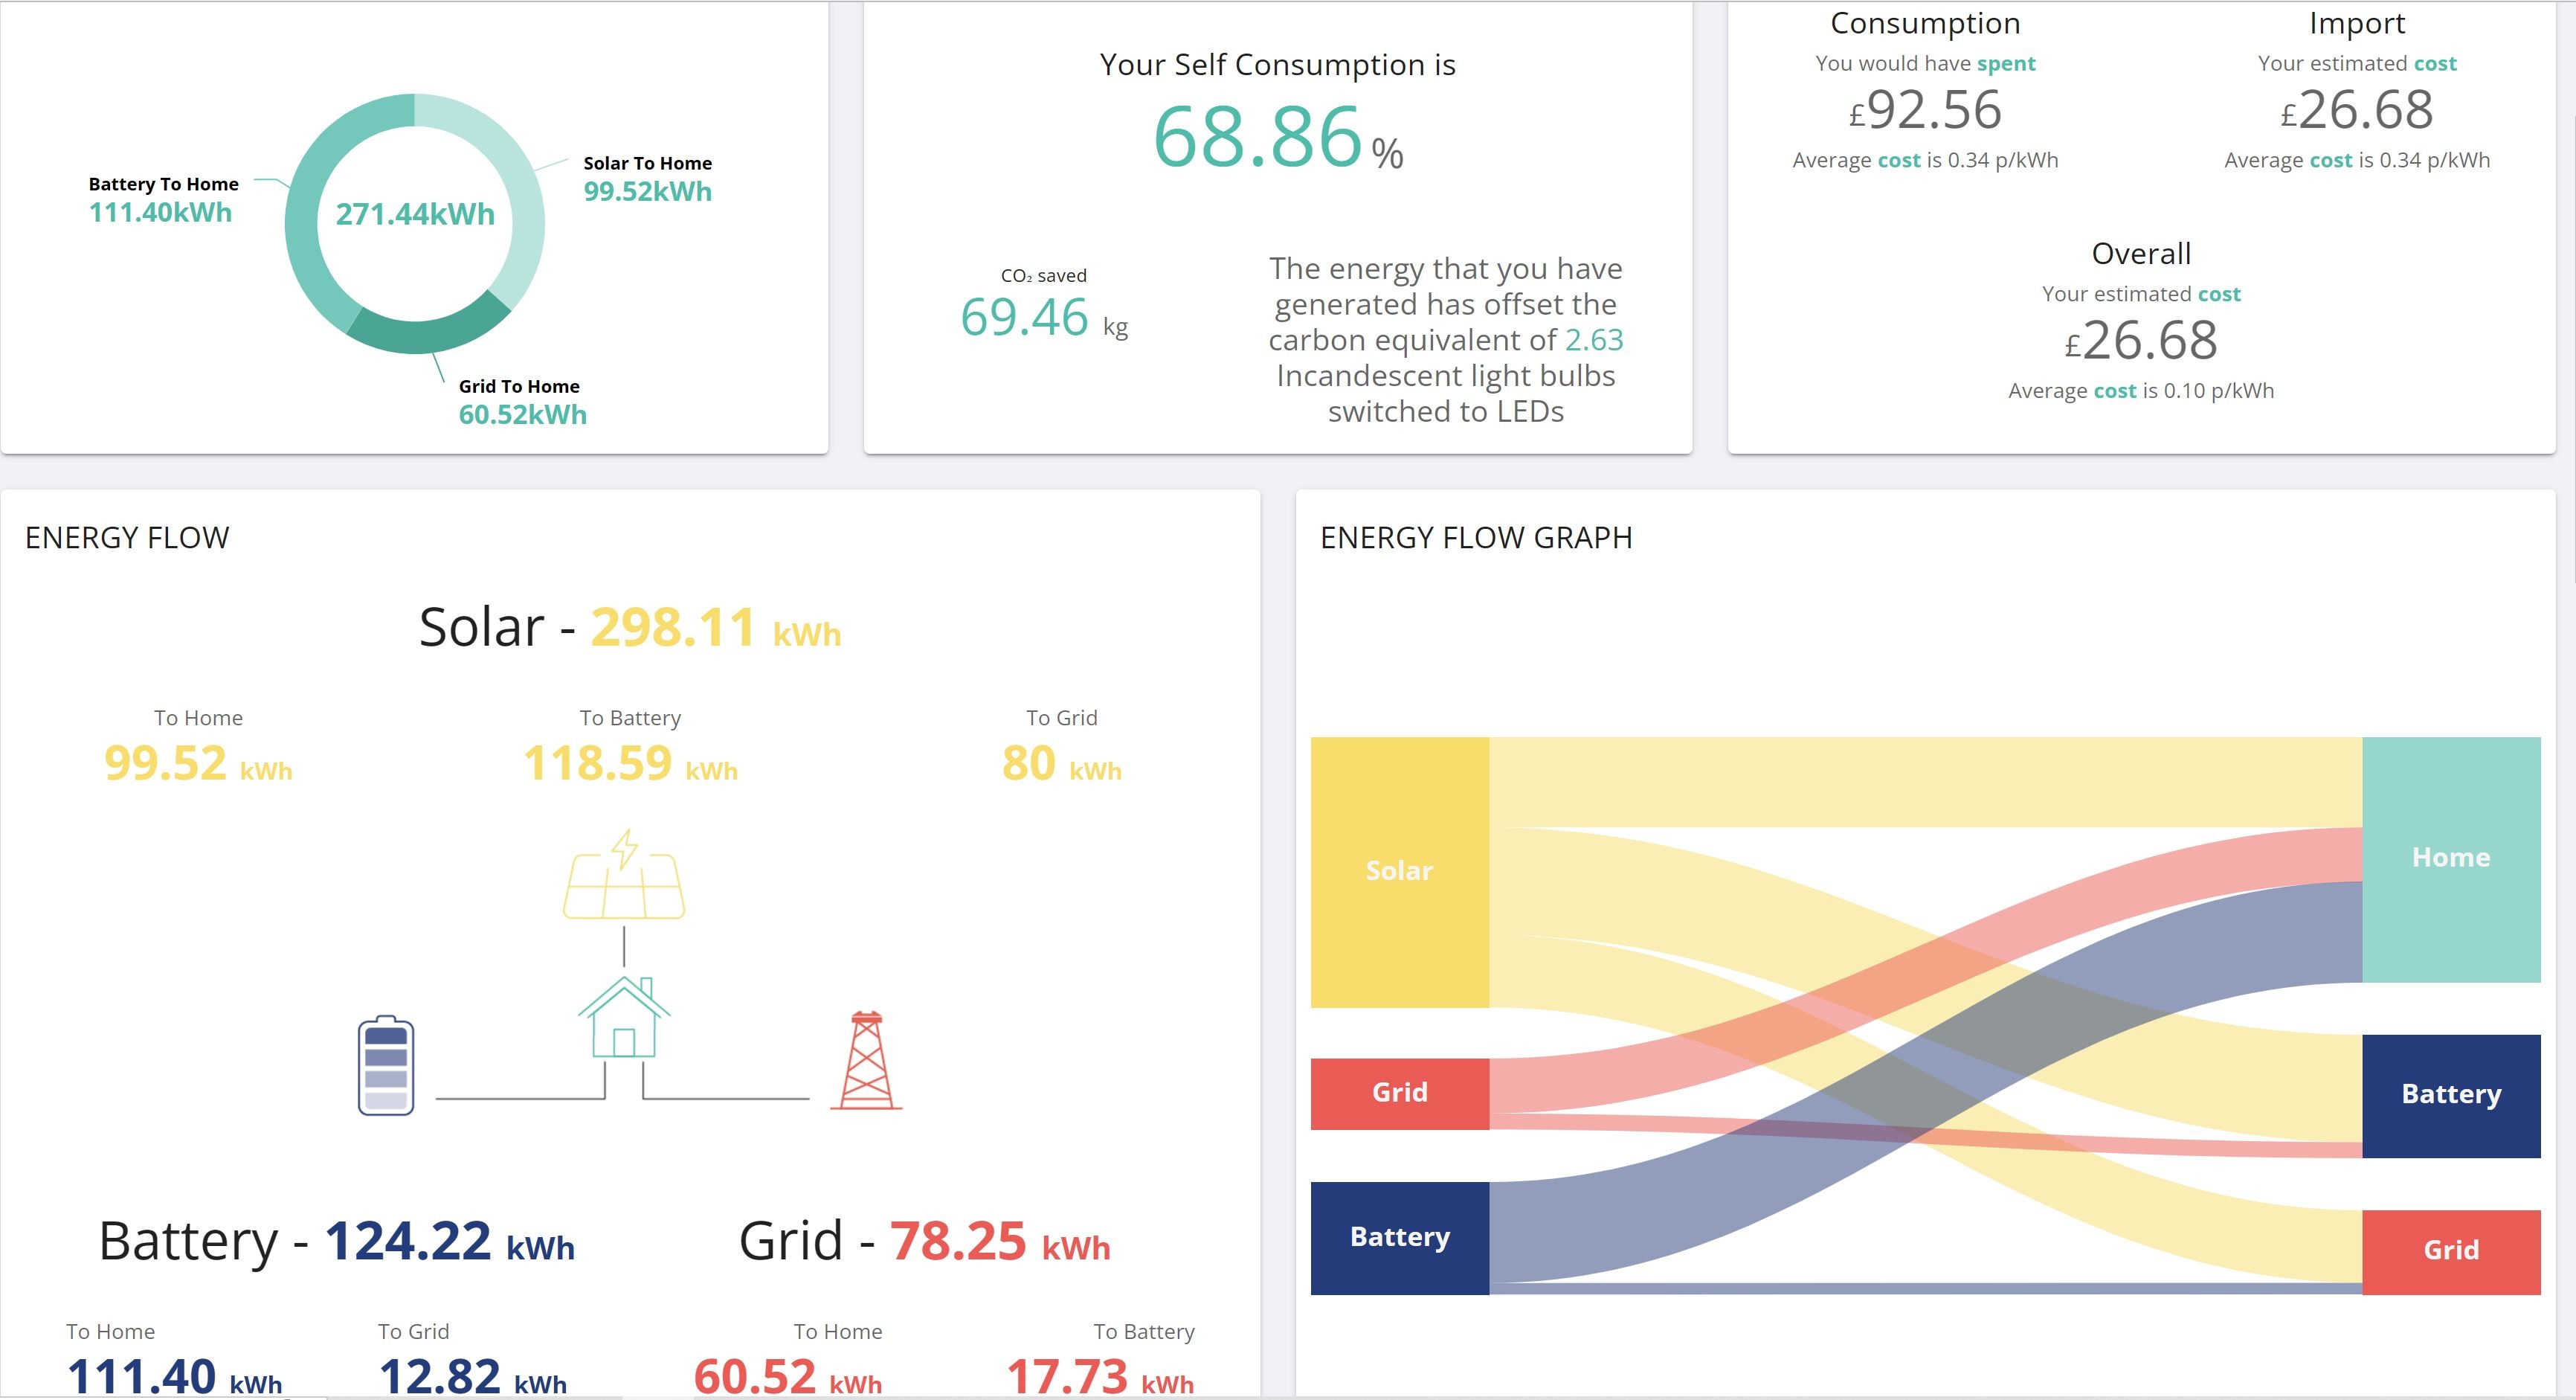
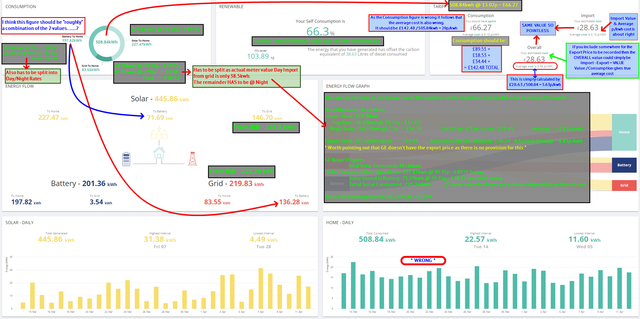
And i think the GE report is showing the wrong "consumption" saving. If you look at the consumption widget (top left) this shows (solar to home + battery to Home + grid to Home) and the total shown is 271.44kwh. And when you look at the figure in the top right widget for "You Would Have Spent" the figure is £92.56. If you calculate 271.44 x .341 =£92.56. But that includes the grid to home cost as shown in the first widget and that is not a saving. I think the top right widget for what i would have spent should be (solar to home + (battery to home - grid to battery)) = 99.52 + (111.40 - 17.73) = 193.19 which at .341 =£65.88
You have clearly spent some time working your numbers there.

Something else to bear in mind (unless it’s changed recently) is the report data is generated “live” so if you have multiple years of data and your tariffs have changed over the period it only uses the latest tariff to calculate savings not whatever tariff you had over those years.
Does skew everything so just be weary of that.

hoggy Thanks for the heads up. But, I'm as simple as it gets. One tariff at all times. And still waiting to get the SEG payments started.
Hmmmm I don't use that report you show for my calculations.
From the Energy Graph Card you can create a csv download (although for me currently its not working and throwing Server 500 errors)
Click on the Calendar Data go to your START DATE and select that then go to your END DATE and select that.
Now in the top right you see a DOWNLOAD ARROW - this downloads the data in a CSV format
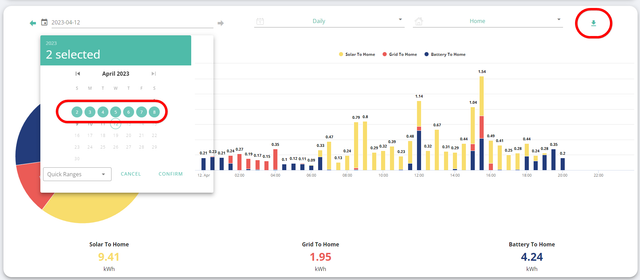
All my financial calculations are carried out in Google Sheets based from this data and carried through to different pages to work out different things.
I have a page where I upload my actual Gas Data and was using this to tracking the Gas Wholesale Tracker (data also imported from CSV for pricing information). We're on the list but it wasn't worth it during Oct/Nov/Dec/Jan/Feb I think its starting to become viable to make savings again now.
I have been monitoring Agile too and that also is potentially looking like it could save money. But I'm more of fixed rate rather than variable rate person when it comes to risk. Again I import the historical Agile CSV data and, will be, using that in conjunction with my actual half hourly Octopus Electricity data to see if we should consider a swap.
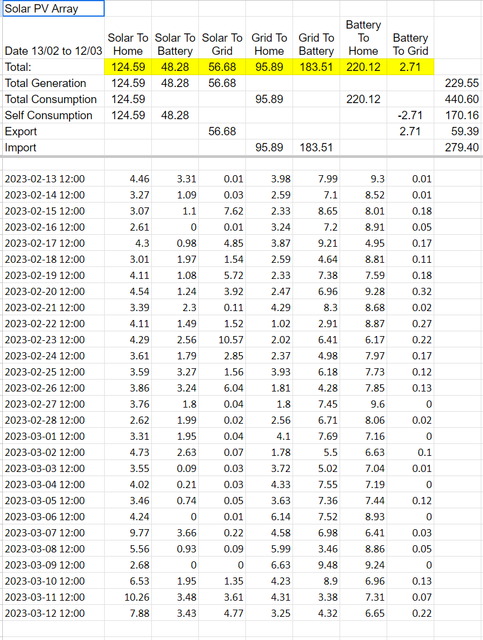
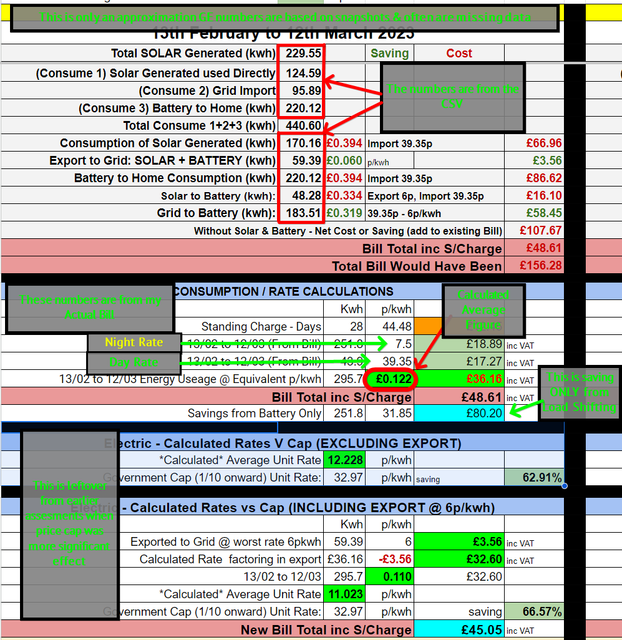
I get that the colours/calcs may look wrong (typically red is used for negative amounts) but I am trying to work out how much more I would have spend if I didn't have PV + Battery.
I can easily work out a load figure for Load Shifting (on the assumption that I use 100% of my electricity going into my battery). Which during winter was close to 100%. During the better weather I move my overnight charge amount up or down based on weather forecast. Winter is probably 90-95% accurate rest of time maybe 75-85%.
Solar Generated = 170.16kwh @ 39.35pence = £66.96
Yes its a saving but I am trying to work out how much more I would have spent if I had imported this.
Export to Grid = Solar + Battery = 59.39kwh @ 6p (BG SEG) = -£3.56
Technically you could say this should be zero if I didn't have PV & Battery.
Battery to Home Consumption = 220.12kwh @ 39.35p = £86.62
This would have been an additional cost as this is energy I would have imported from the grid. As I don't know the amount of energy from this figure that was generated by Solar or simply by night time Load Shifting I will adjust the amount for them next.
Solar to Battery = 48.28kwh @ 33.4pence (this is net amount of import cost less SEG) = £16.10
Grid to Battery = 183.51 @ 31.9p (this is net amount of daytime import cost less night import cost) = £58.45
I have already worked out the total amount I would have spent if I didn't have a battery now I am adjusting that original amount based on where the energy came from.
Ultimately for that month my Load Shifting saving was calculated to be around £80 and my Solar/Battery saving was around £107. So my actual savings will be between those two values.
In truth my finance is more than those savings so I am running at a small loss but in 42 months it will be paid off and all that money that would have gone into paying energy bills will at least have bought something that makes me a little more energy secure. My rough ROI is about 6-7 years.


dragon2905 , have you compared the data exported from the energy graphs with that from the My Inverter-Meter Data, and also the grid import/export with your smart meter data?
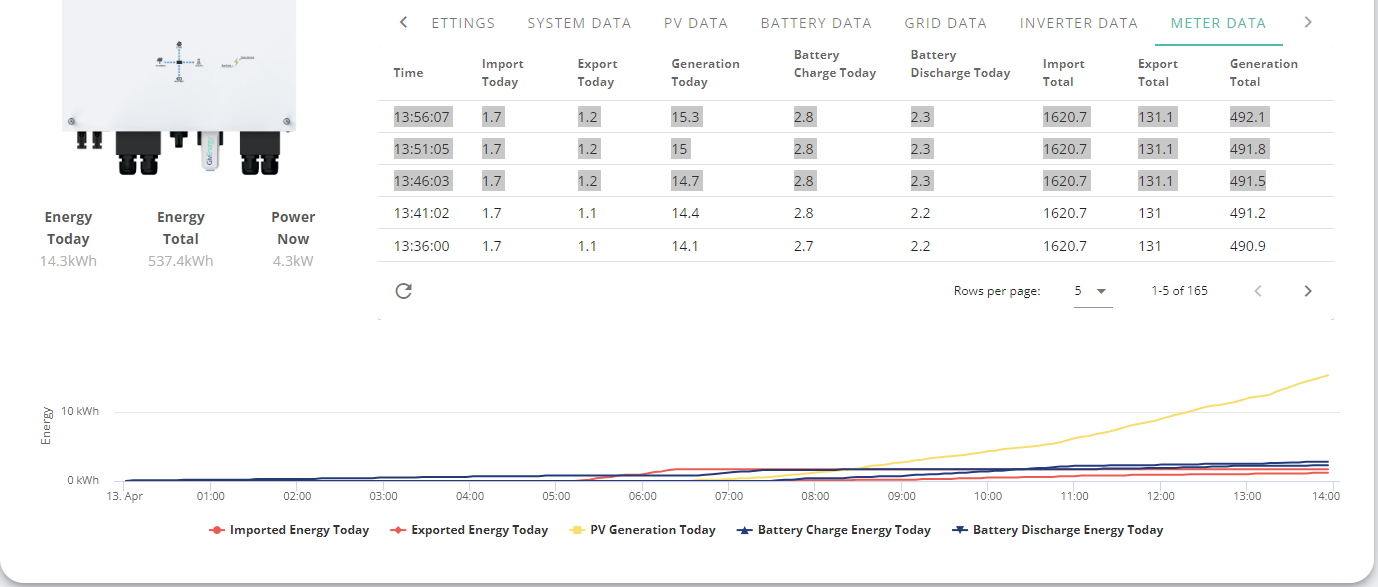
On my system the data from the energy graphs is rather optimistic, certainly for generation, whereas the My Inverter-Meter Data more closely matches readings from my smart meter, hence those are the values I use when calculating savings/pay back.
Simon_C no hadn't looked at that.
Am I missing something ie. is there some way to download a data for a period or is that only available on a daily basis (ie pain in the rear)
Also my download button in that feature is also throwing Server 500 Errors so can't even look.

dragon2905, the only way I have found for the Meter Data is to display all rows, group select, then Copy (Ctrl-C) followed by Paste (Ctrl-V) within a spreadsheet.

The Download option from the Energy Graph has worked in the past, but not reliably today.
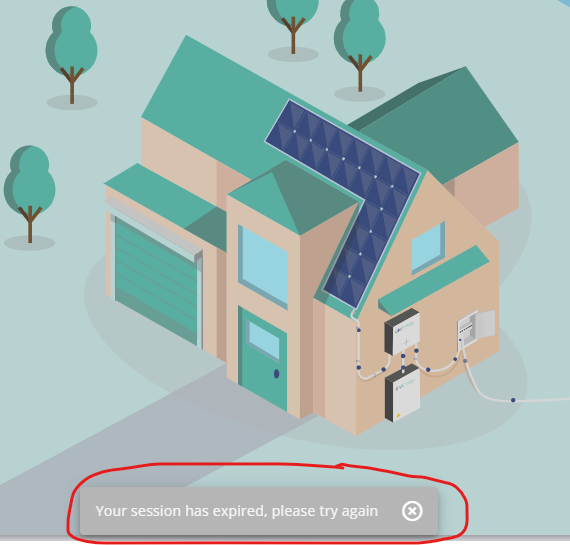
On trying today with Monthly and Grid In selected, I just get thrown back to the default dashboard page, with this message.
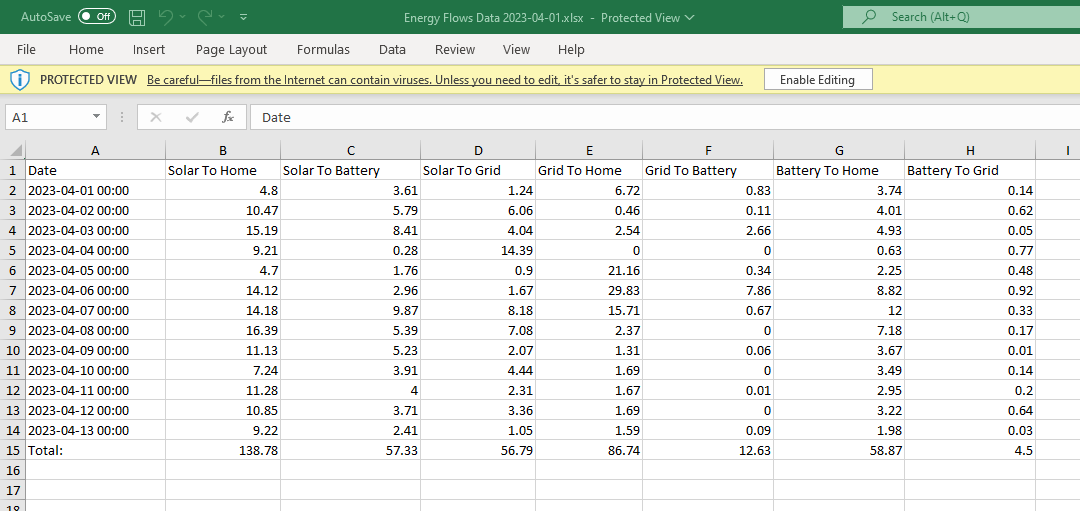
On trying again, I have got some data. Using Windows 10 and MS Edge browser if that makes any difference.
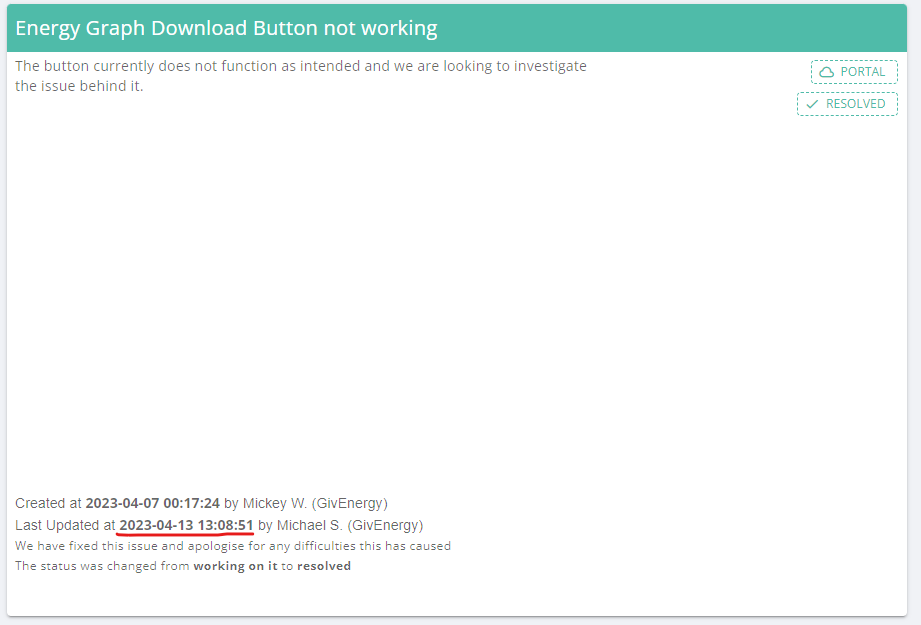
Just noticed this.


Looks like they fixed that issue today.
Yeah annoying that there isn't the same functionality that allows you to go into the Calendar Option in the inverter card and bulk download that data between specific dates.