Strength of solar?

25 comments started 2023-04-20 last 2023-05-29
Forums/Meta
U
#1 Ulven

Perhaps an odd question.

But is there a difference in solar output from day to day?

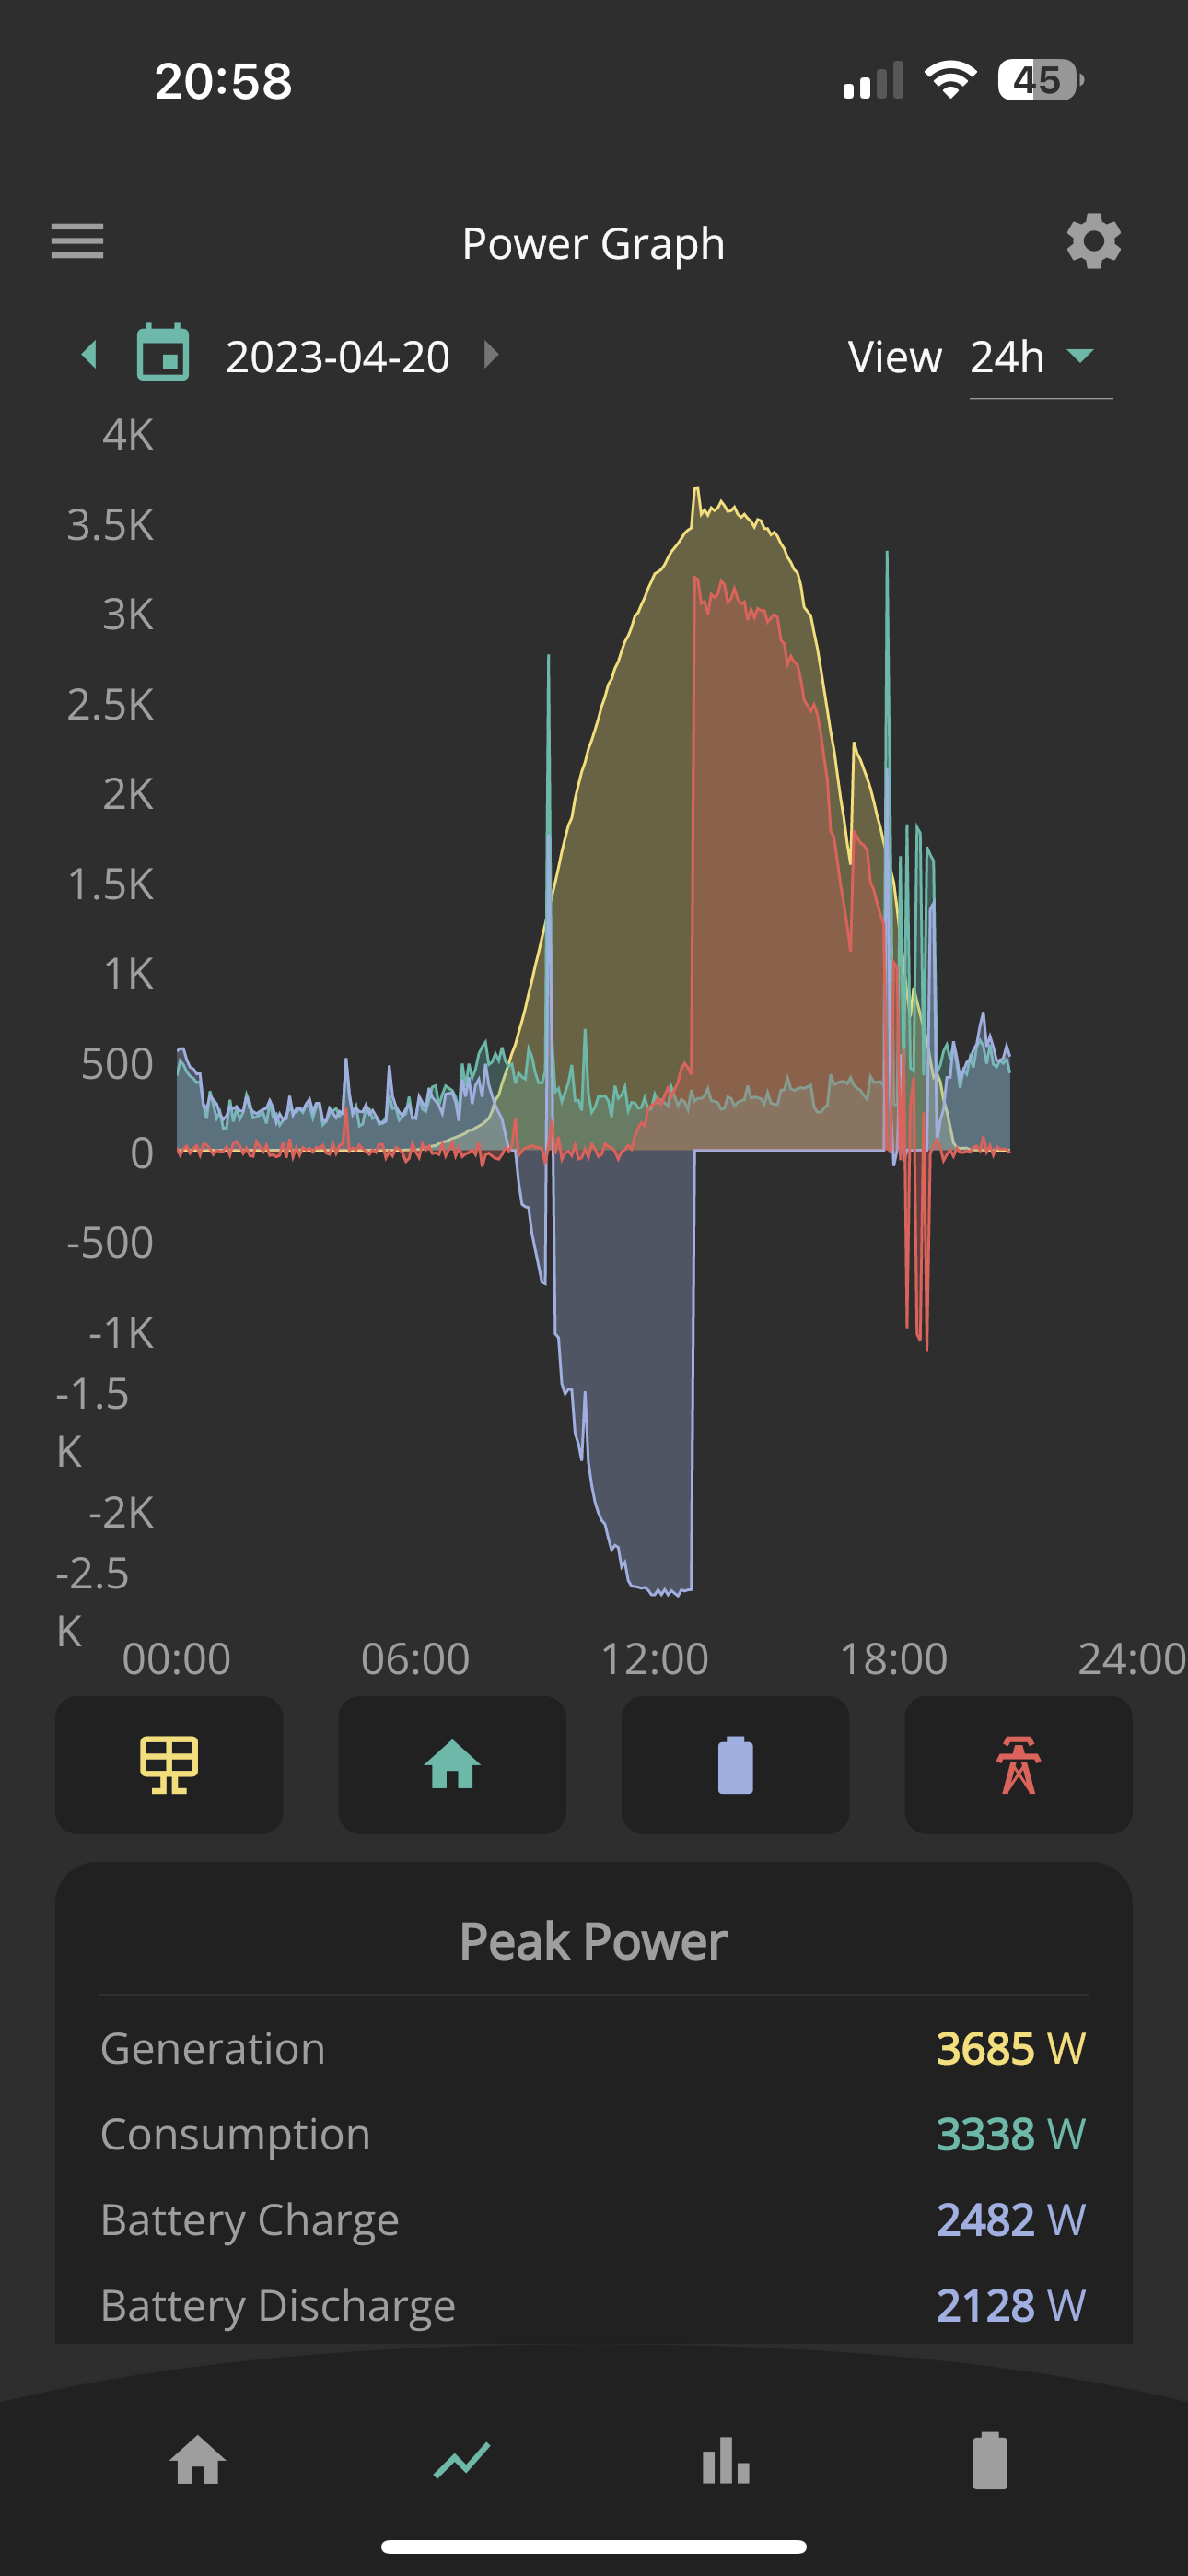
In the past couple of months I had days where my panels were outputting around 4kw (only for short amounts of time though). This past week its been really sunny but I haven't seen the output go over 3.4k. Seems odd that during days of less sunshine, I was sometimes peeking at higher levels.

So hence the question, is there a difference in the actual production quality of the sun from day to day? (excluding clouds and shadows of course)
T
#2 TX200

Temperature can make a difference, they're less efficient when they get warm, e.g. direct sunlight for a prolonged time.

S
#3 SilverArt

Ulven More like quality of the clouds, whether you can see them or not. Reflection from clouds can help to increase the solar benefit.

M
#4 madhulk

One thing I’ve noticed is that you will only see as much generation as the inverter is putting out. I’ve got a hybrid 3.6, which will only output 3.6 to house and 2.7 to the batteries. If the batteries are full, it only shows 3.6 generation as that’s all it can use. If the batteries are charging too it can show up the 5.something which the panels are capable of.

Don’t ask me where the rest of the generation goes! I assume the loft gnomes must take it…

#5 Hook

There’s another thread about this somewhere that discusses how cloudy diffused light can actually spike above perfectly clear sunny days.

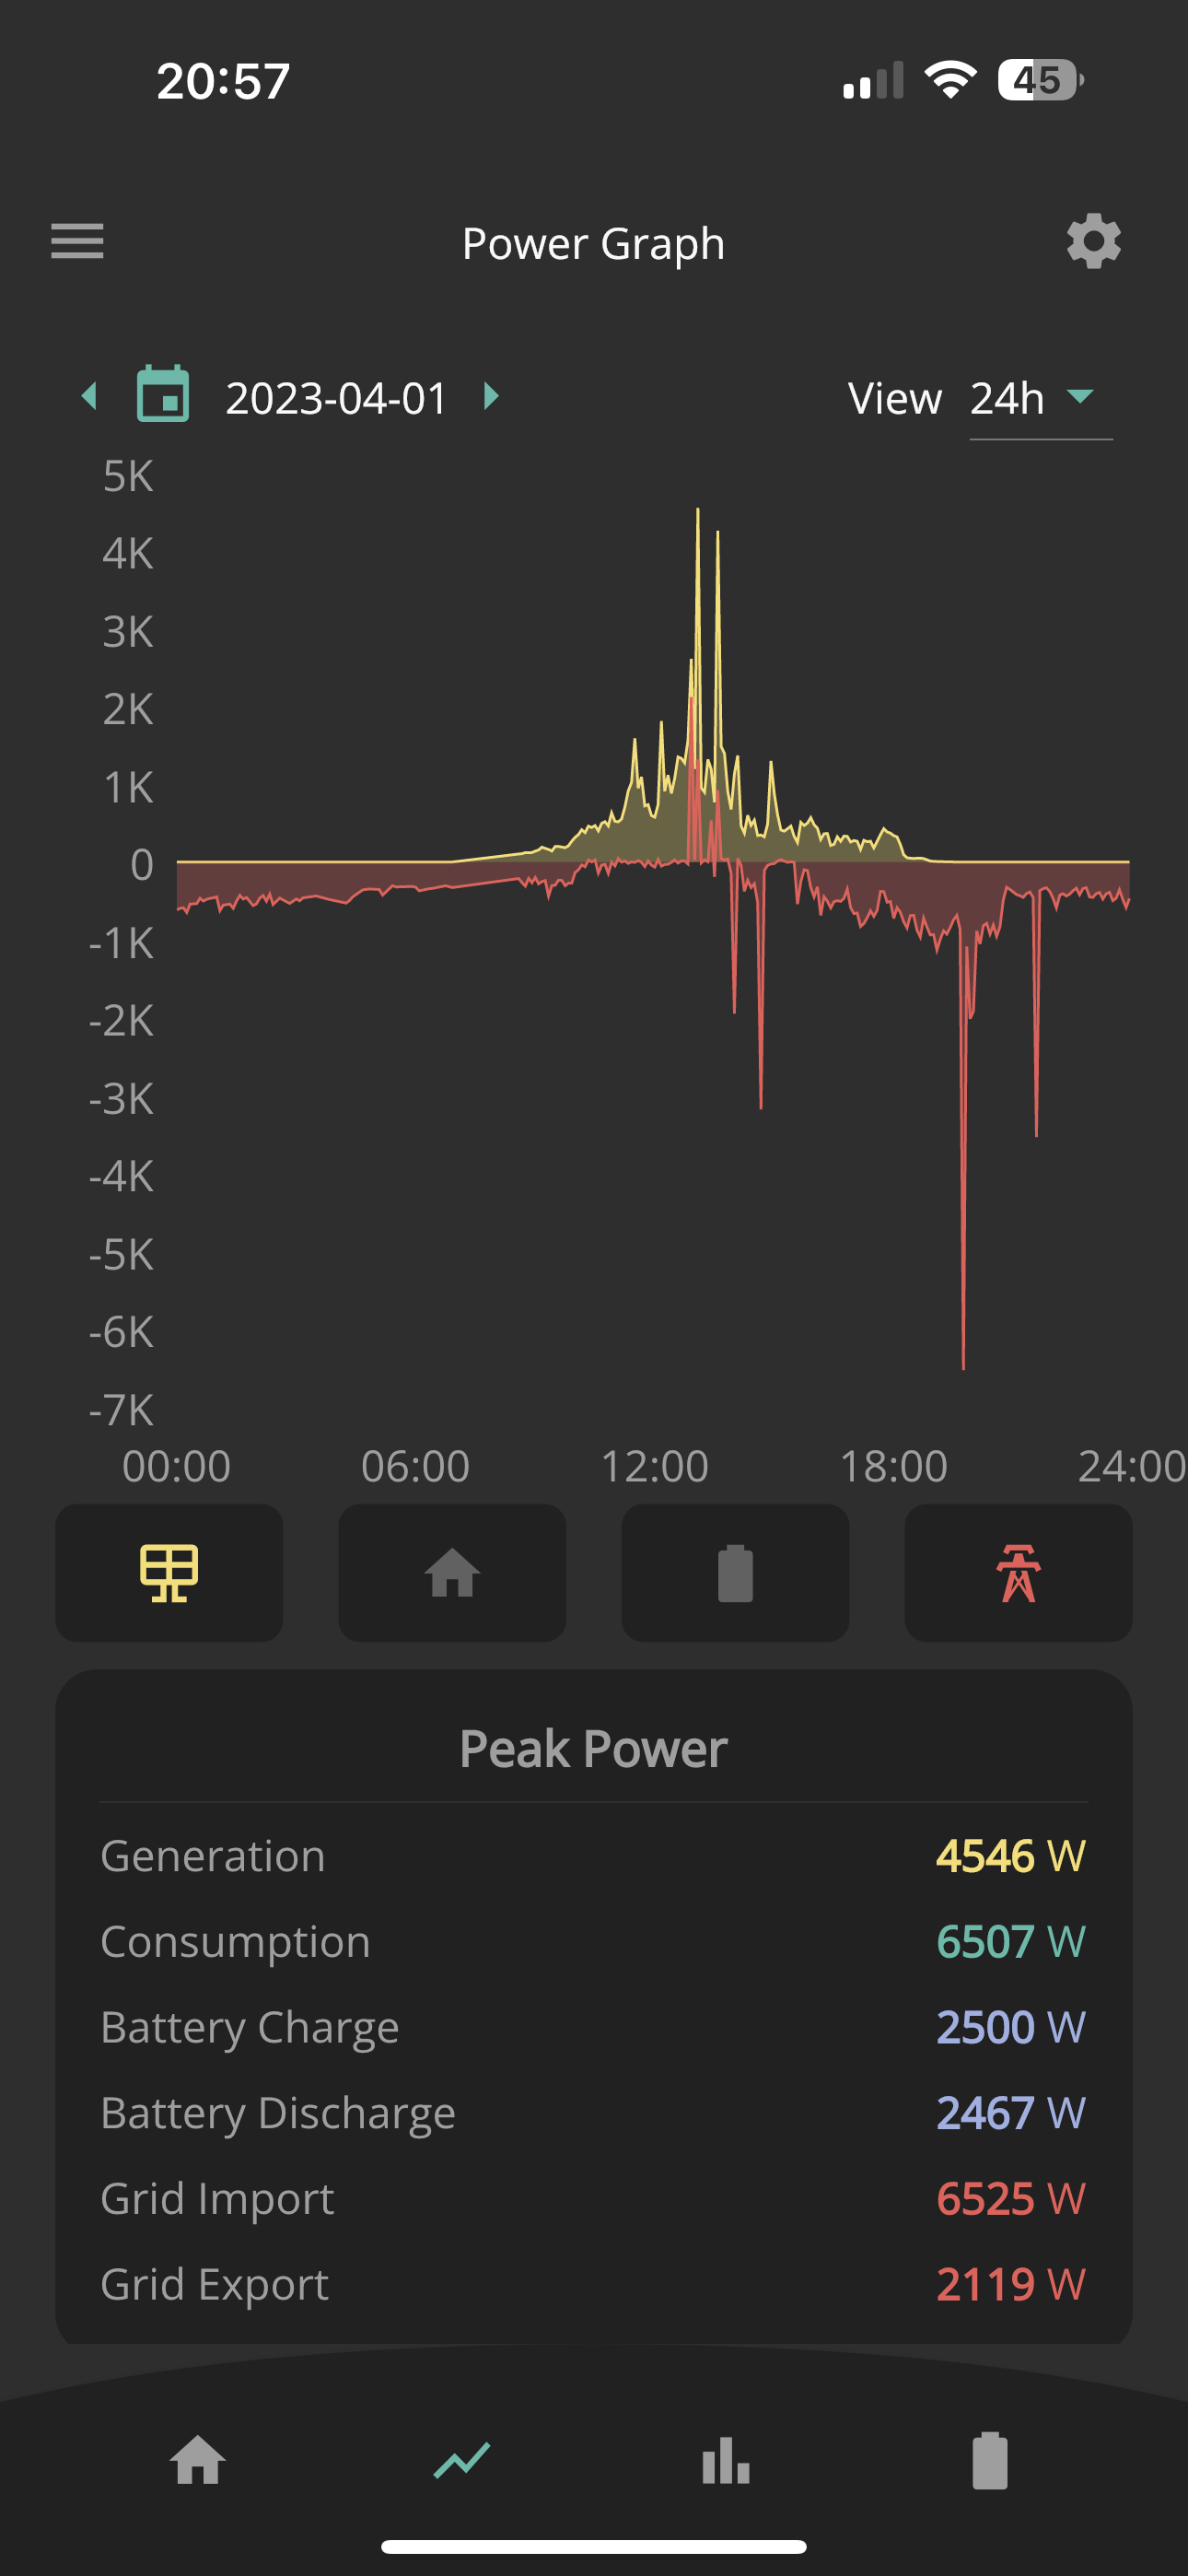
I’m my case today was perfectly sunny and my panels peaked at 3685w with 4kw of pv. I have seen a brief peak of 4546w on a cloudy day.


W
#6 wilfleek

Our system peak solar generation was around 4.8kW today , and I have been seeing 5.1kW recently around mid-day. And it seemed to be a cloudless sky too! Go figure. I would not have thought it hot enough today to reduce the panel efficiency much, either.

(AC coupled system)

#7 Hook

wilfleek I presume you have a 5kwh inverter?

I think that comes into it as well.

C
#8 chris_p

Hook I was going to start a thread asking that question, so thank you for confirming that.

W
#9 wilfleek

Hook yes, 5kW solar inverter, plus an AC3.0

U
#10 Ulven

Interesting thanks.

L
#11 Leon_shaw

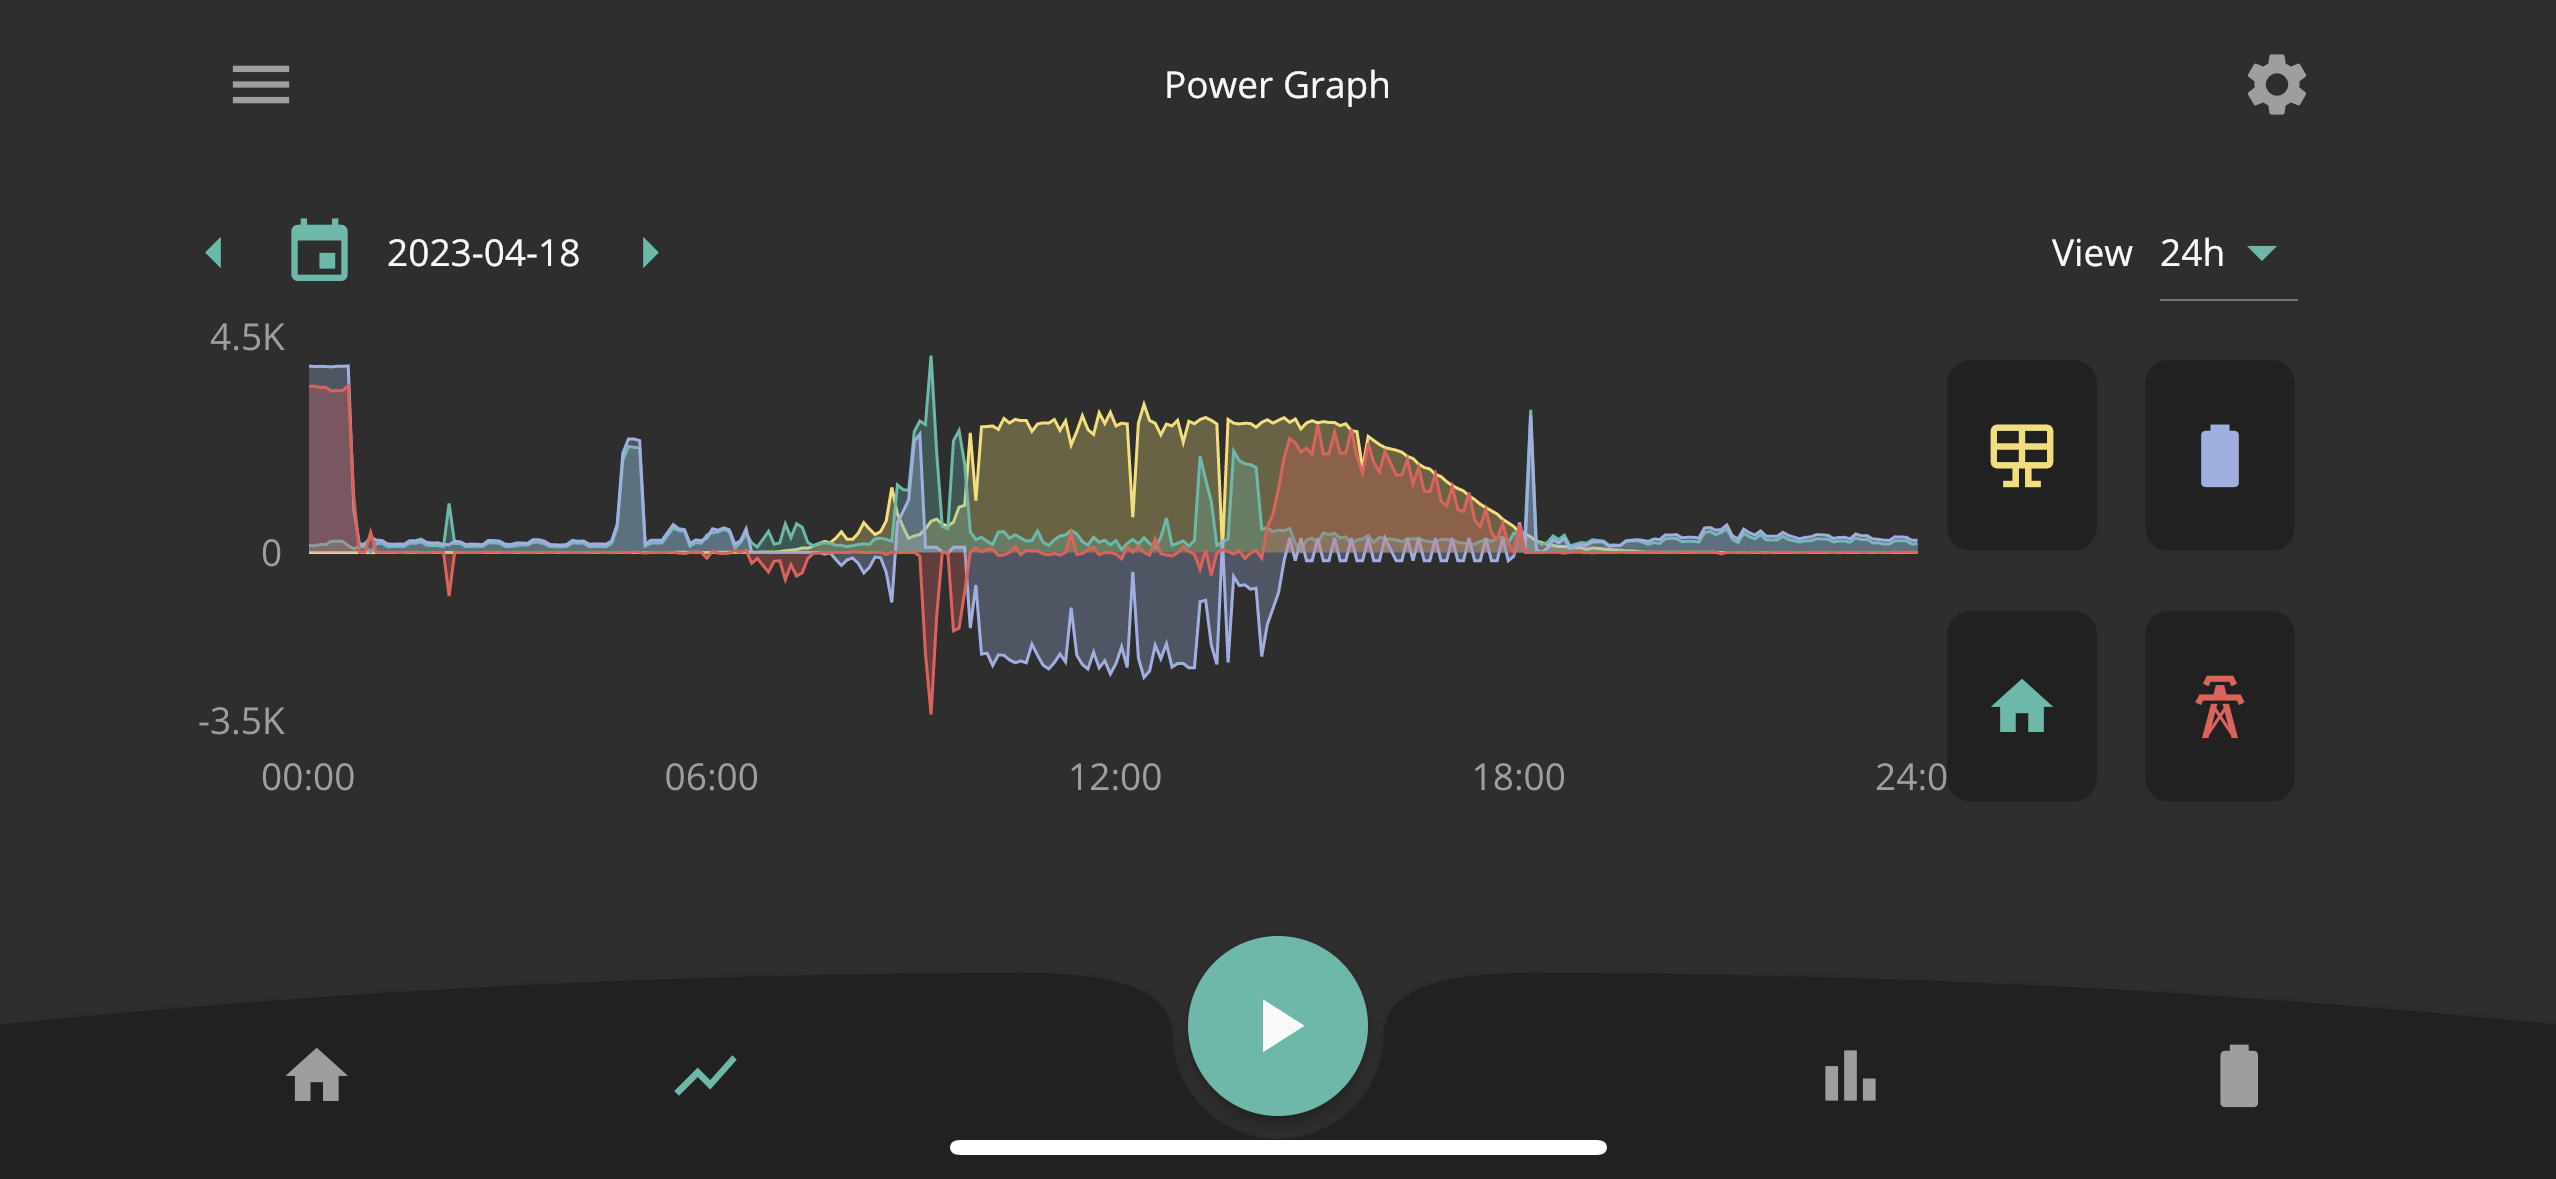
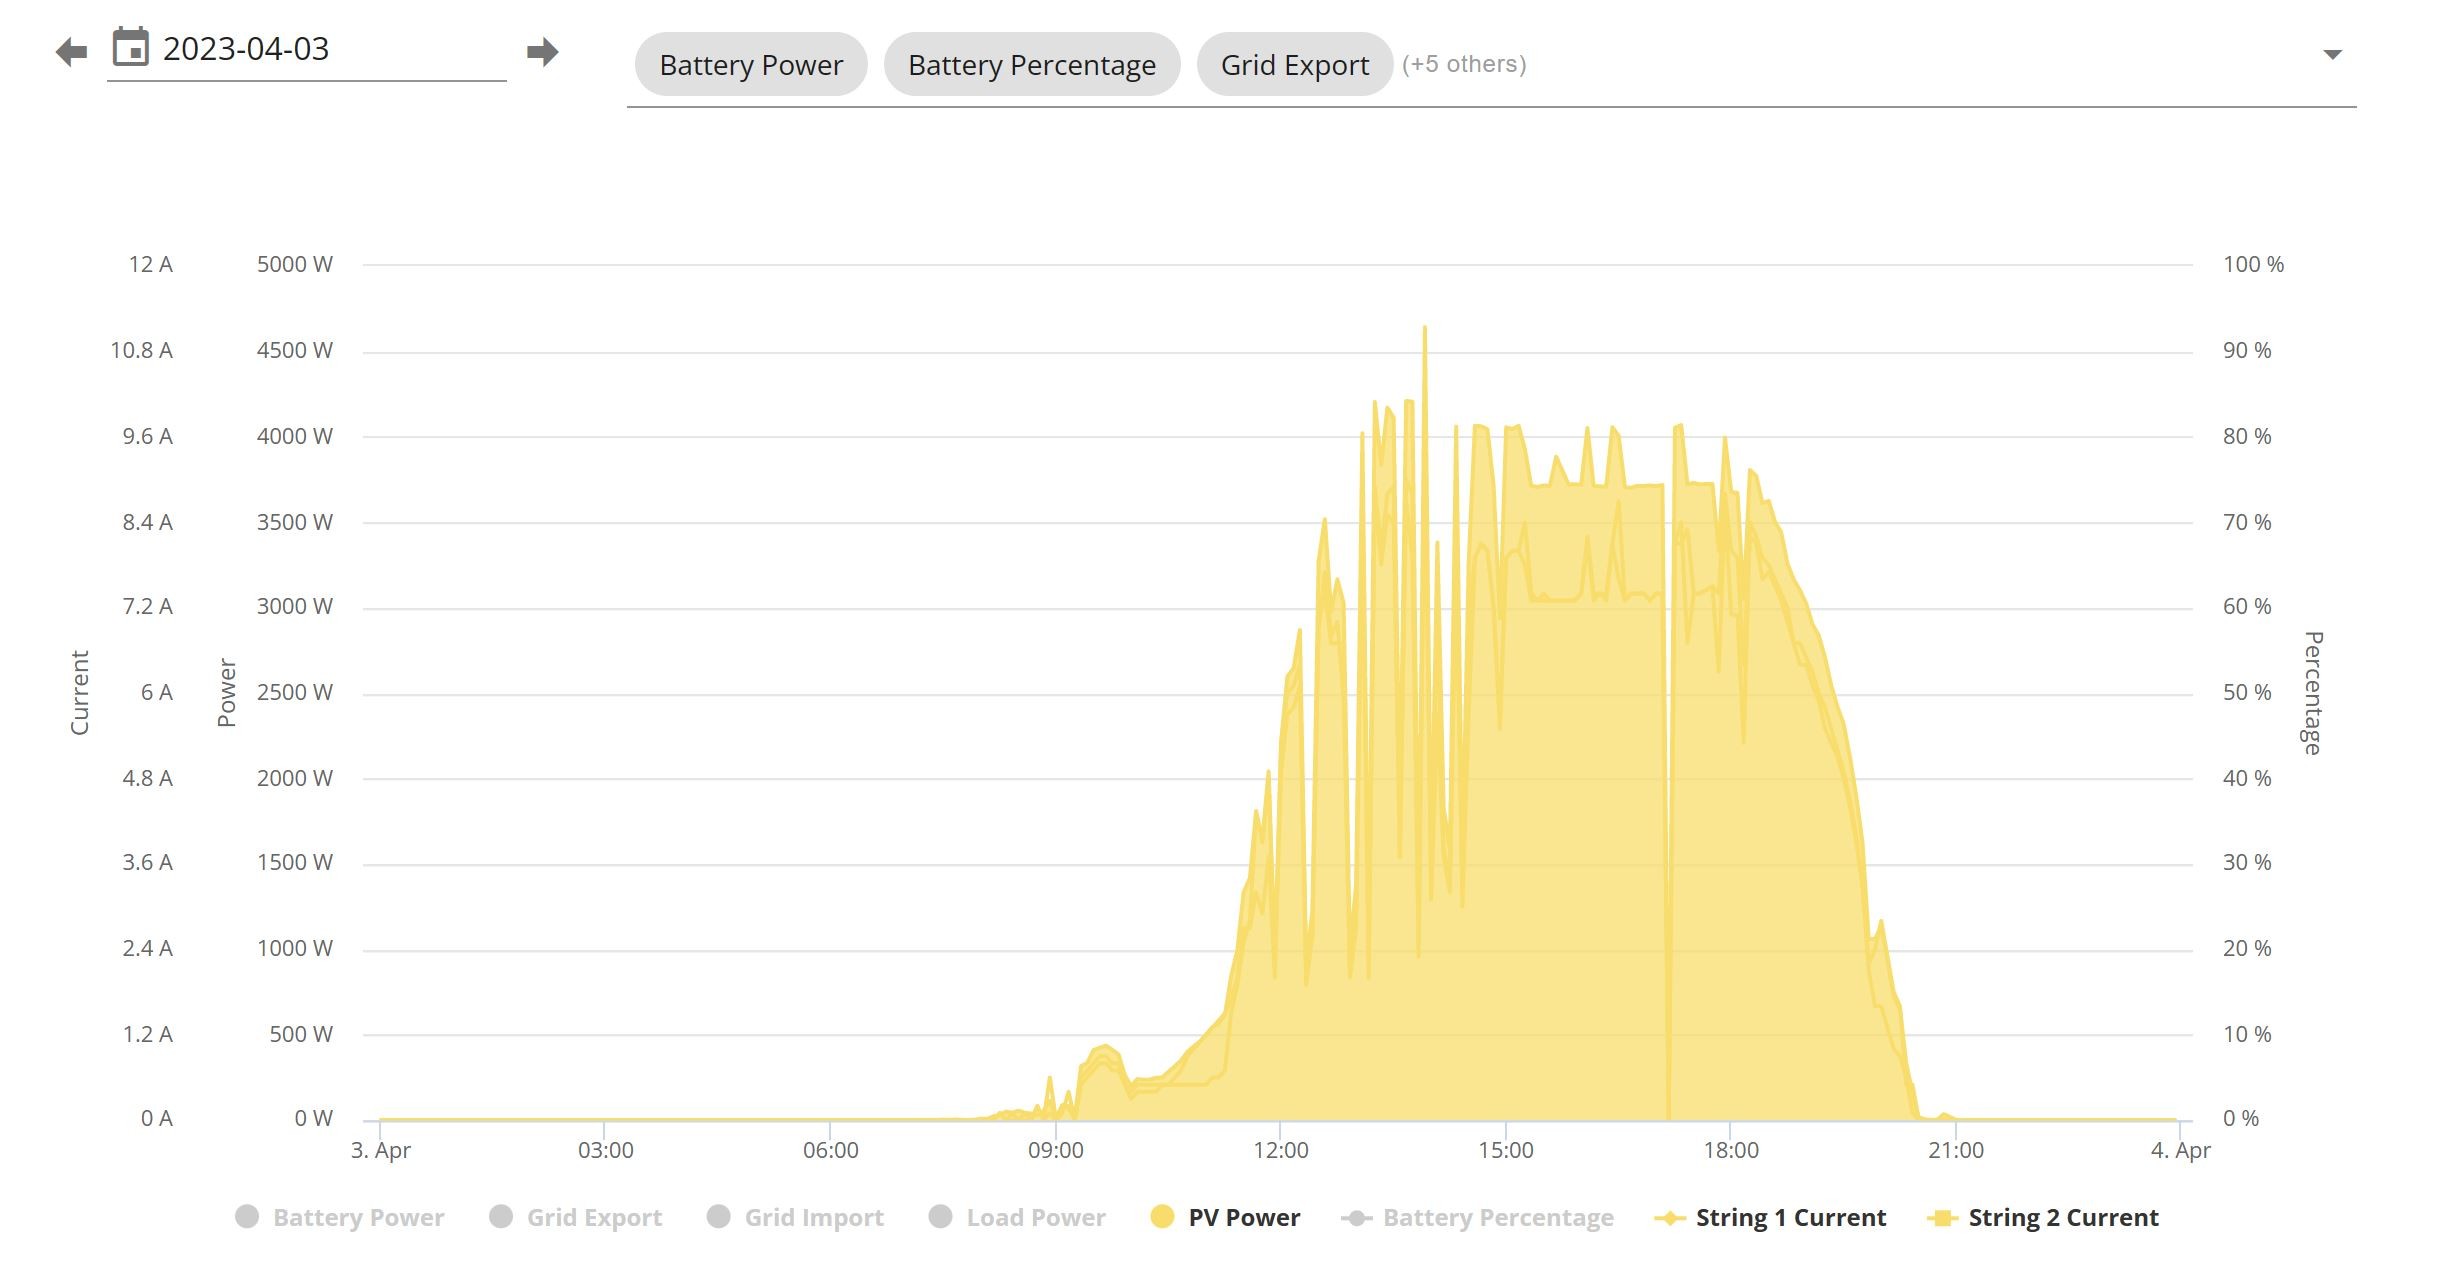
Ulven how does the solar generation chart look on these days. Is it an almost flat line across the top as shown in mine ?

I am experiencing a similar issue what appeared to be Solar being throttled. The Amp get no where near the 13 that the panels allow and my solar seems to cap around 2800w. As you can see there is no solar curve which is what you would expect.

T
#12 TX200

Hybrid or AC connected inverter?

Does your solar generation suddenly increase if you start using more power in the house?

Wonder if it's been capped - e.g. wrong export value (limit) set.

Or if it is just the maximum it can do based on the inverter limits and the battery limits.

L
#13 Leon_shaw

TX200 mine is hybrid gen 2 3.6 inverter and 9.5kwh batteries. Engineer been out checked system said should have no issues reaching the 4kwh the array is capable of.

Export limits are all correct. Solar doesn’t increase when something is in use and it’s not charging the battery at the speed the inverter is capable of on clear days either

U
#14 Ulven

Leon_shaw No mine looks like a bow shape on full sunshine days.

#15 Maxwell

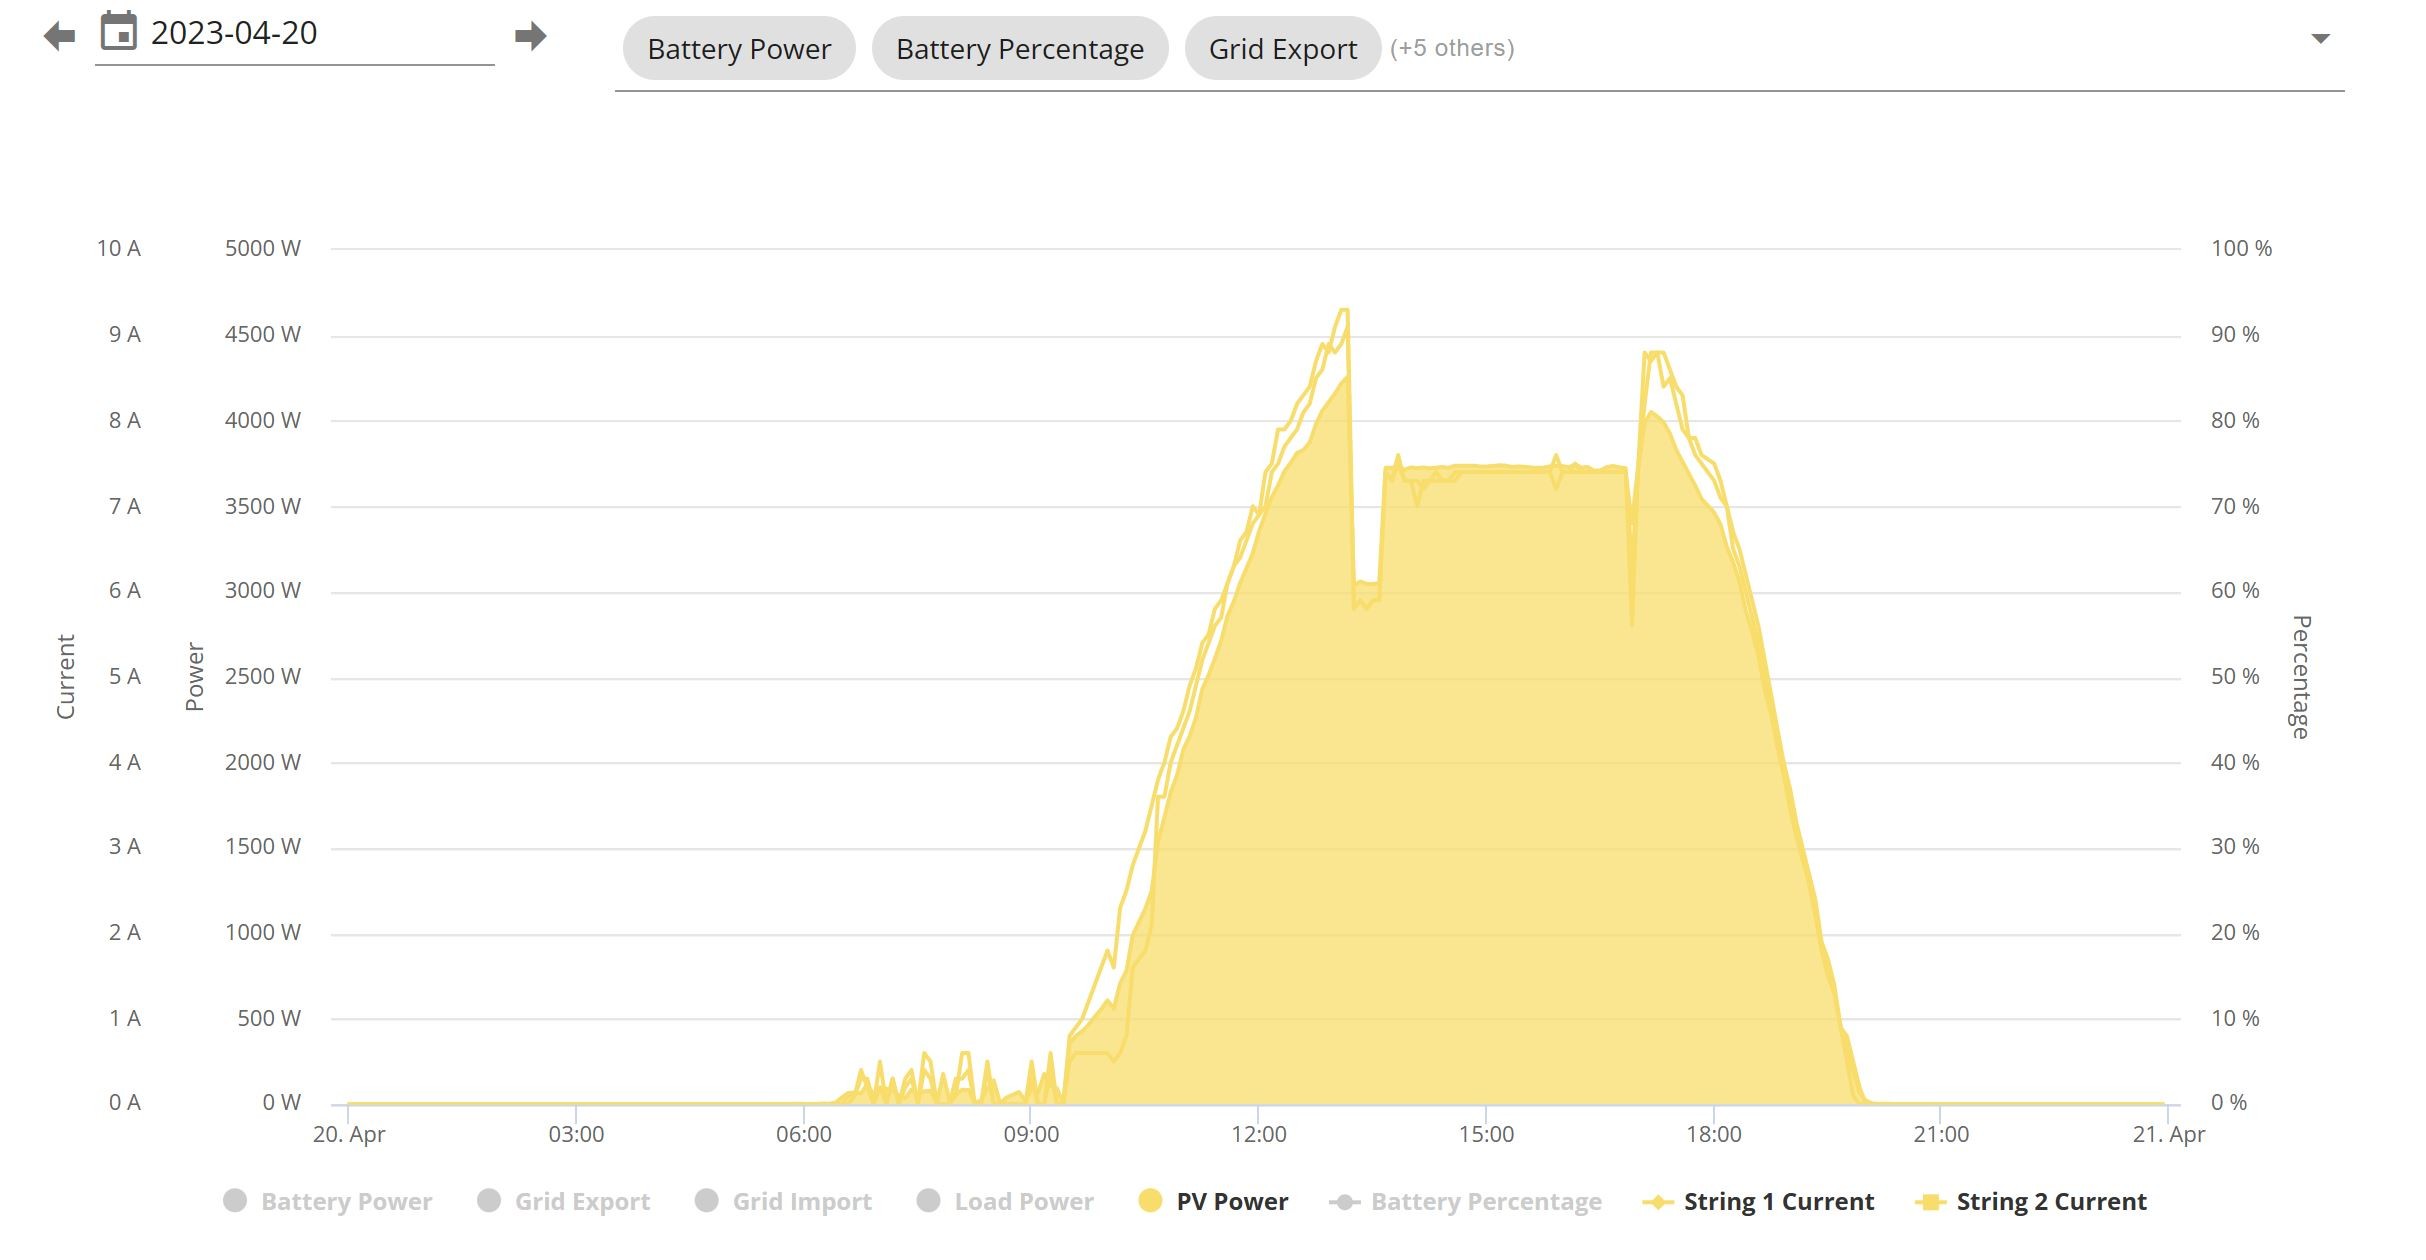
My best solar generation day so far has been yesterday and i got this pv output

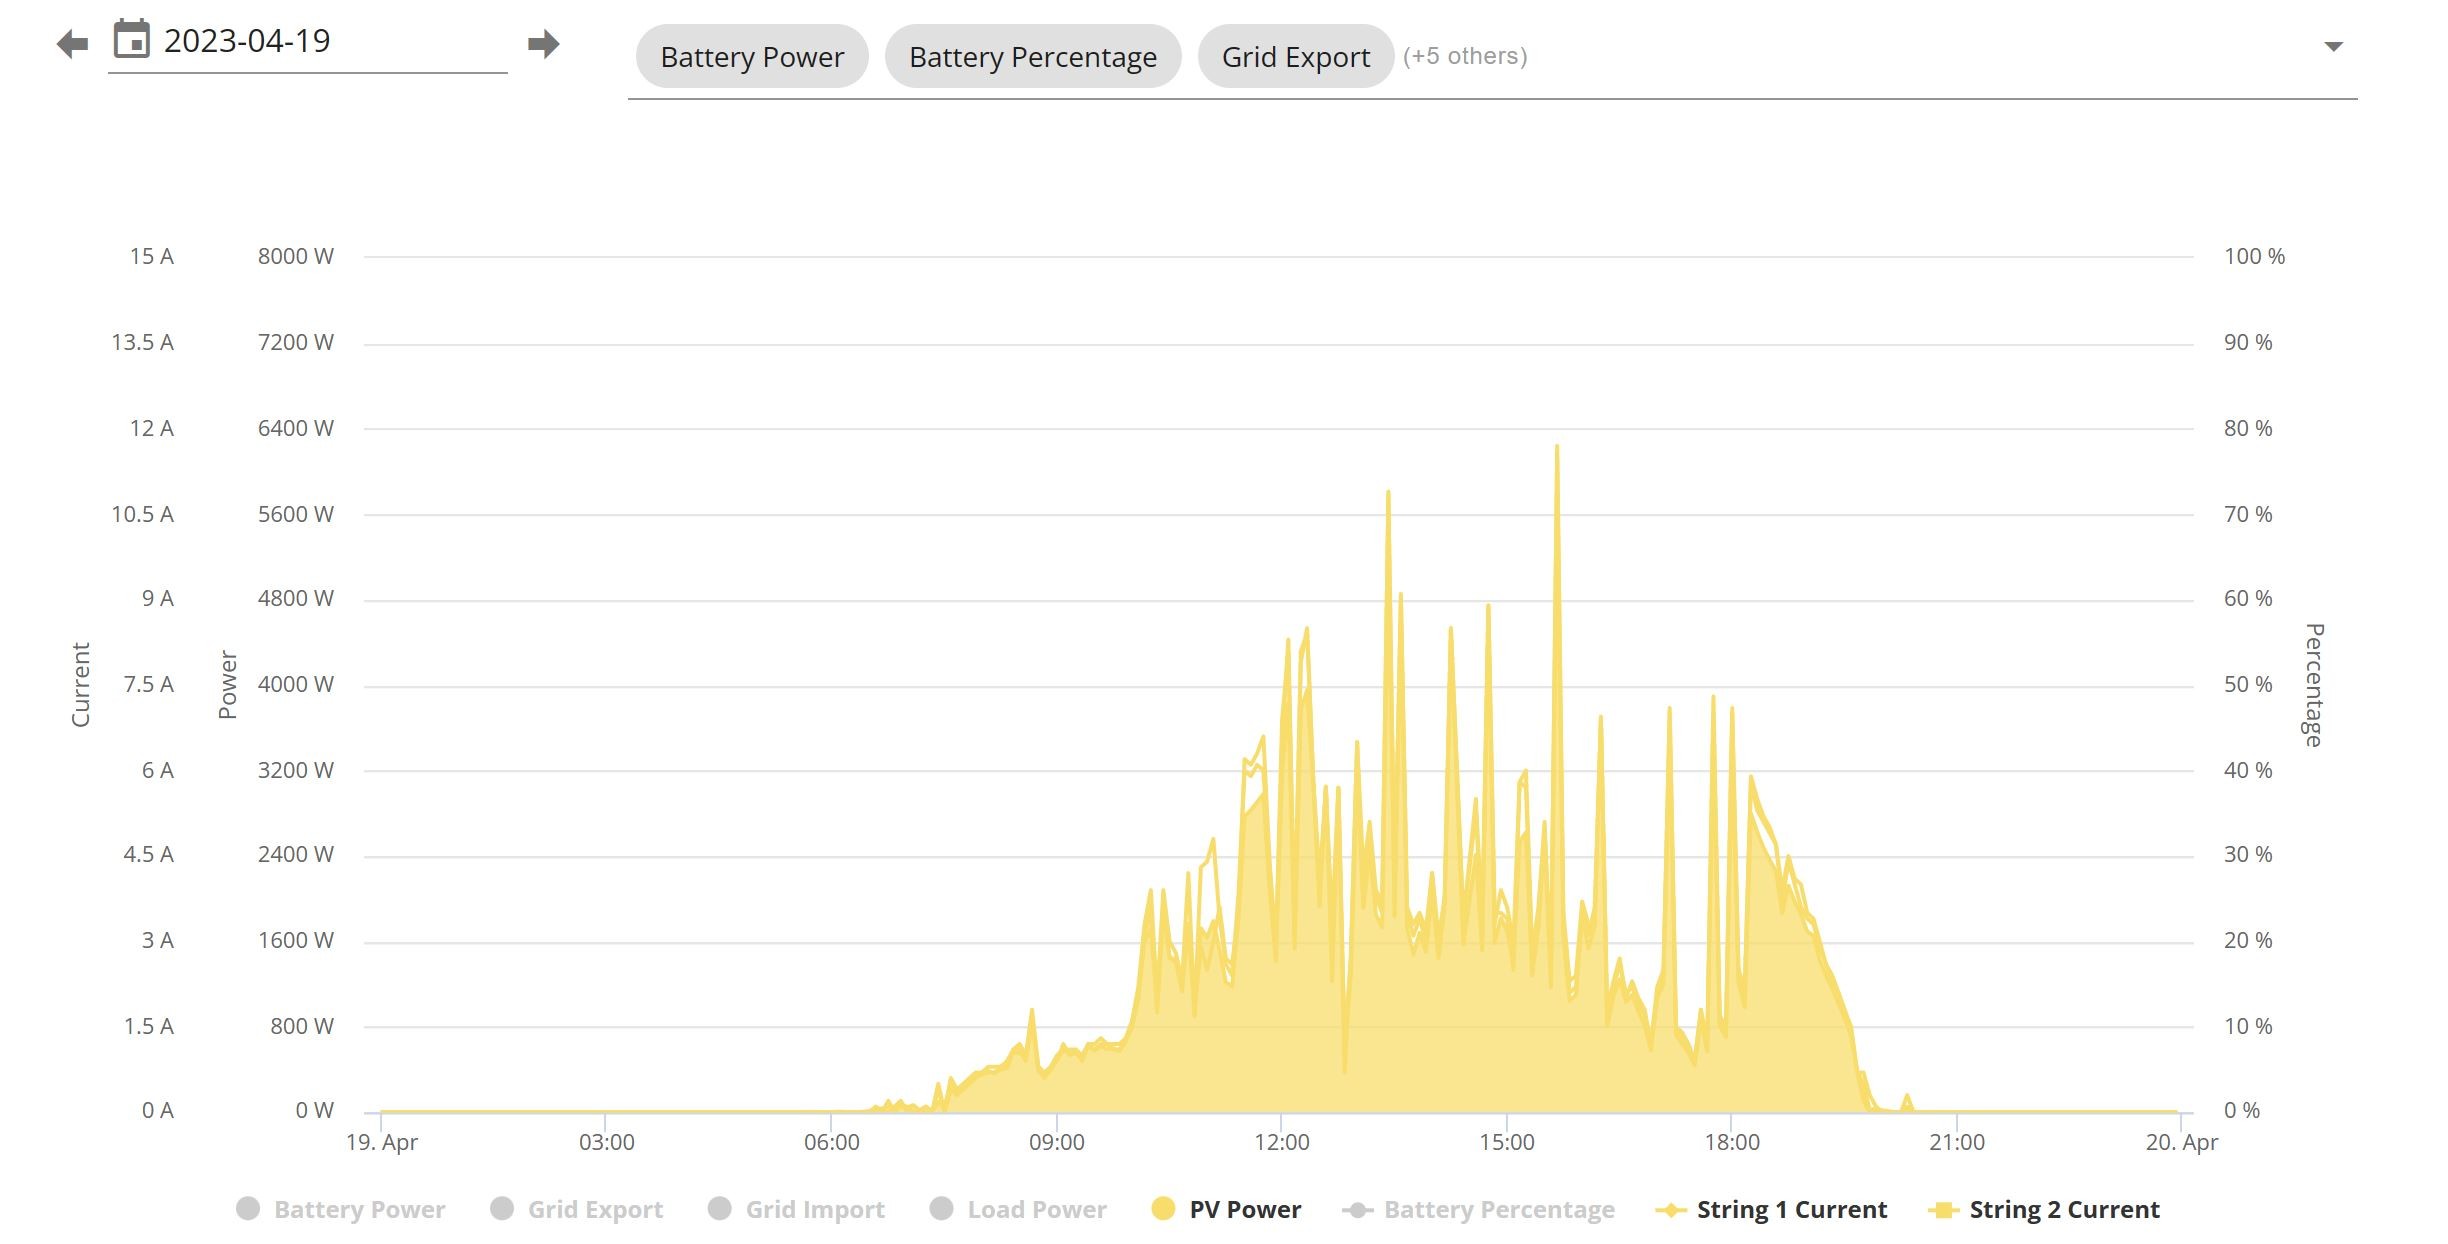
But, the day before which i thought was also sunny, although in total it was about 10kwh lower than the 20th. So, clearly a very different day in terms of light intenisty despite the human perception of conditions.

But, if i look at another daya where it was only about 3kwh different to the 20th i see a similar performance. Which suggests similar light levels. Although there are more eratic dips in performance.

S
#16 SilverArt

Maxwell It looks as if it is clipping at an inverter max of about 3.6 kW export, any spikes above that appear to be reaction times. Are you limited to 3.6 kW export?

#17 Maxwell

SilverArt Yep, 3.6kw inverter.

#18 Maxwell

On the topic of solar intensity i was wondering why pv installs don't come with a solar intensity sensor fitted which would be a useful indicator of the solar intensity. Now, i know there will be the additional cost argument for not doing so and on some installs with arrays facing different directions or some have partial shading at times then there won't be a simple one size fits all solution. But, surely one sensor on each array somewhere would give a good enough view to help show those times the intensity and address those concerns about people's perceptions of what is actually was.

D
#19 DD

Maxwell On the topic of solar intensity i was wondering why pv installs don't come with a solar intensity sensor fitted which would be a useful indicator of the solar intensity.

Have you looked at solcast.com ? In addition to predicting future solar generation for your setup, I think it can produce output which shows what your system should have produced in the past, given the (now known) solar intensity in your region. I have no idea how it works - perhaps it collects actual generation data from people ? Anyway, it might serve a similar sort of goal.

(Other similar services are available, I believe.)

S
#20 SilverArt

Maxwell I wonder if it would help any more than looking at the "PV Power" on the GE info?
A say 6" square sensor would either need to have a 'wide angle lens' on top, to capture a large sky area. In which case it would need extra cooling to get rid of the heat or, if it didn't have one, it would only 'look' at a very small area of the sky which may or may not be a good comparison. I guess in order to be accurate it would also need cooling/temperature control.
I agree with DD probably the best comparison is to set up Solcast or similar which will give a best estimate comparison of expectation v realisation in the GE portal.

W
#22 wilfleek

I have found solcast to be more than pretty fair in forecasting solar generation. Especially after I "tweaked" the details of my installation to get a good correlation on a cloudless day. Now I would say solcast is within 0.5kWh of actual most days. That isn't bad for free!

A
#23 Anomnomnomaly

Ulven

I went through this when I first had mine fitted... Couldn't understand why clear days produced much lower than some cloudy days.

Basically there's a combination of factors... direct sunlight is not always good, thin and high cloud is... solar radiation reflects back up and back down of the higher thinner clouds which can boost production. Clearer skies can mean the whole system runs warmer, which can lower efficiency.

Right now, mines been bouncing around from 1.5kw to 3.5kw as the clouds pass overhead. But we've been using vacuum cleaners a lot this morning, so draining the battery along with using the solar... and we've still got back up to a 87% charge. Which will be 100% in an hour or so.

I'll be cooking lunch shortly... for free... and if this holds through the day as it's predicted too... will have a full battery for this evening.

M
#24 Michael91

I used pvGIS to predict hourly output before buying my system. It showed max direct sunlight of 950 w/m2 with a small addition from scattered light, or, with cloud, much smaller direct sunlight but scattered light input of up to 350 w/m2.
My explanation for the high spikes, which I saw on day 1 of operation, is that with broken cloud I was intermittently getting full direct sunlight plus scattered light from nearby clouds (power that would have gone to my neighbours without the cloud) so total input was about 1100 w/m2 and the panels output more than their rated power, which is measured at 1000 w/m2.
After fully charging the battery, the Giv 5kW inverter limited the panel output from 1 string, but left the other string at full power, so that remained visible on the giv cloud record.
I now arrange for the battery to have room for charge during peak generation time, to capture all available solar energy.

D
#25 Dom66

For me, I found it impossible to explain the varying PV levels - clouds, no clouds, sunlight, heat etc…. At times it just made NO sense. Something must be wrong. I thought the inverter temperature seemed high when PV was lower than expected so I bought a fan. At times, it seemed to help - but did it really, I know now that it had NO affect. Maybe it was the TIGO optimisers? Turning them off to set PV to zero and then back on again would give boost in PV for seconds, sometimes minutes…
Eventually, as I have explained elsewhere so sorry for all you who are getting bored, I realised all the issues weee connected to the level of battery charge. This was proven by turning off the battery and seeing the PV level jump from 500W (unexplainable amount for a sunny day) to 4kW! But if course you need the battery, especially between 4 & 7pm when I get low PV (I have East panels only) and on Flux, the rate is highest. But battery would not discharge with high SOC so turning off TIGO optimises to set PV=0 fixed this. A bit rubbish, but at least explainable. Inverter seemed to be setting the PV rate to no higher than battery requirement! Low battery charge all OK.
Upgraded inverter to v909 - all issues fixed! Moral of the story - if it doesn’t seem to make sense, there is probably something wrong. It should make sense.