Inconsistent Power Graph scale

6 comments started 2023-04-28 last 2023-04-28
Beta PortalCloud Portal
S
#1 SilverArt

Have I missed a trick somewhere? I find the Power Graph annoying. On the 26th my "Power Scale" shows as -8000W to +12000W and on the 27th it shows as -4000W to 6000W which is far more sensible.
If I deselect"Battery Power" the 26th range changes to -3000W to 7000W (probably the ideal range for me) and the 27th to -2400W to 5600W
If all I select is "PV Power" the 26th is 0W to 8000W (Max 5918W) and the 26th 0W to 4000W (Max 3763W) which, if looking quickly through the days makes the 27th look like the better day.

Is there a way (or should there be?) of fixing the range?
R
#2 Rubikcube

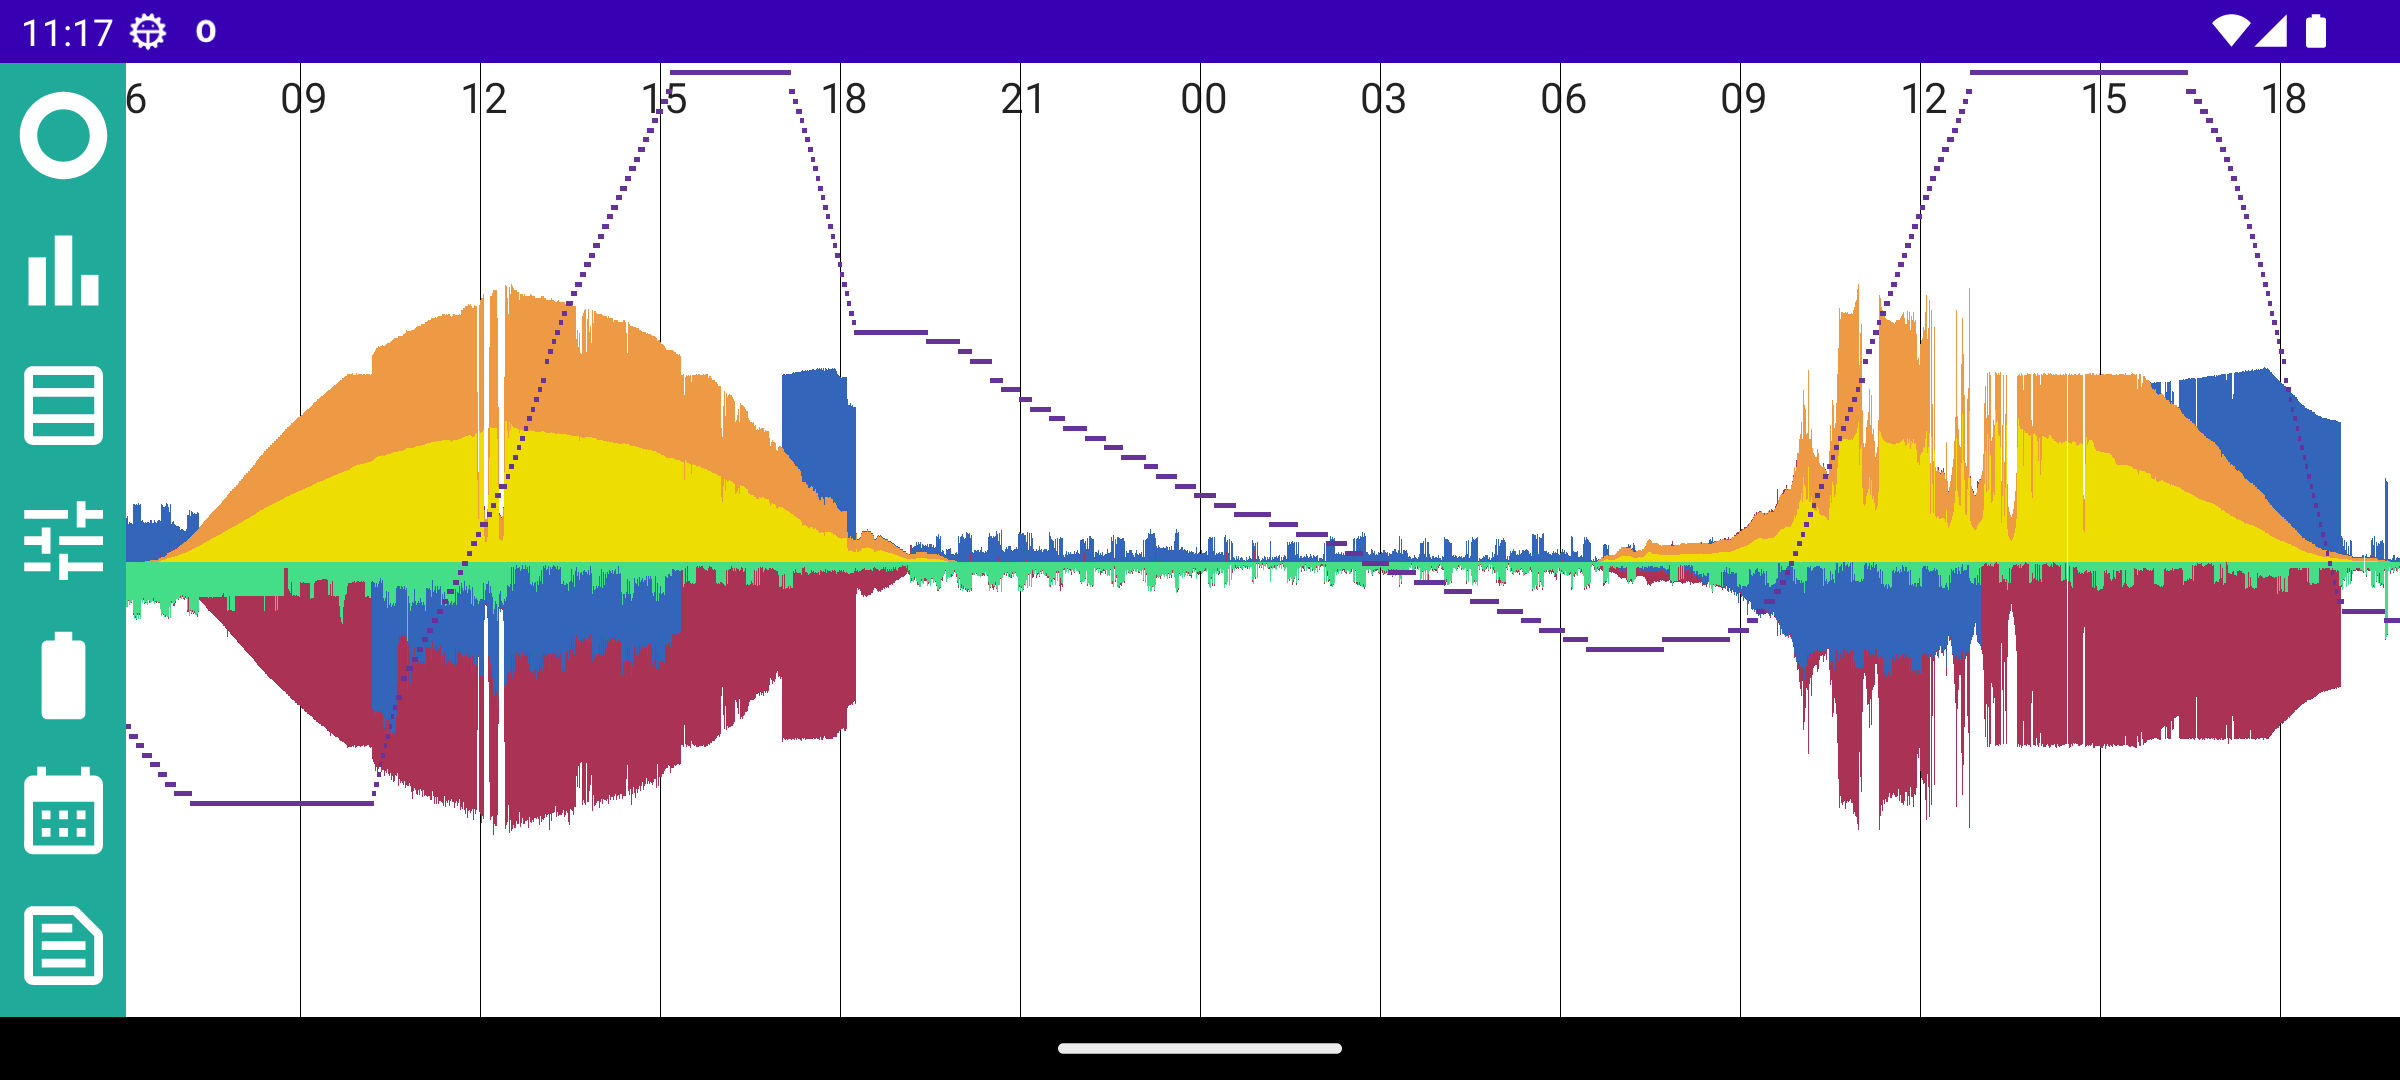
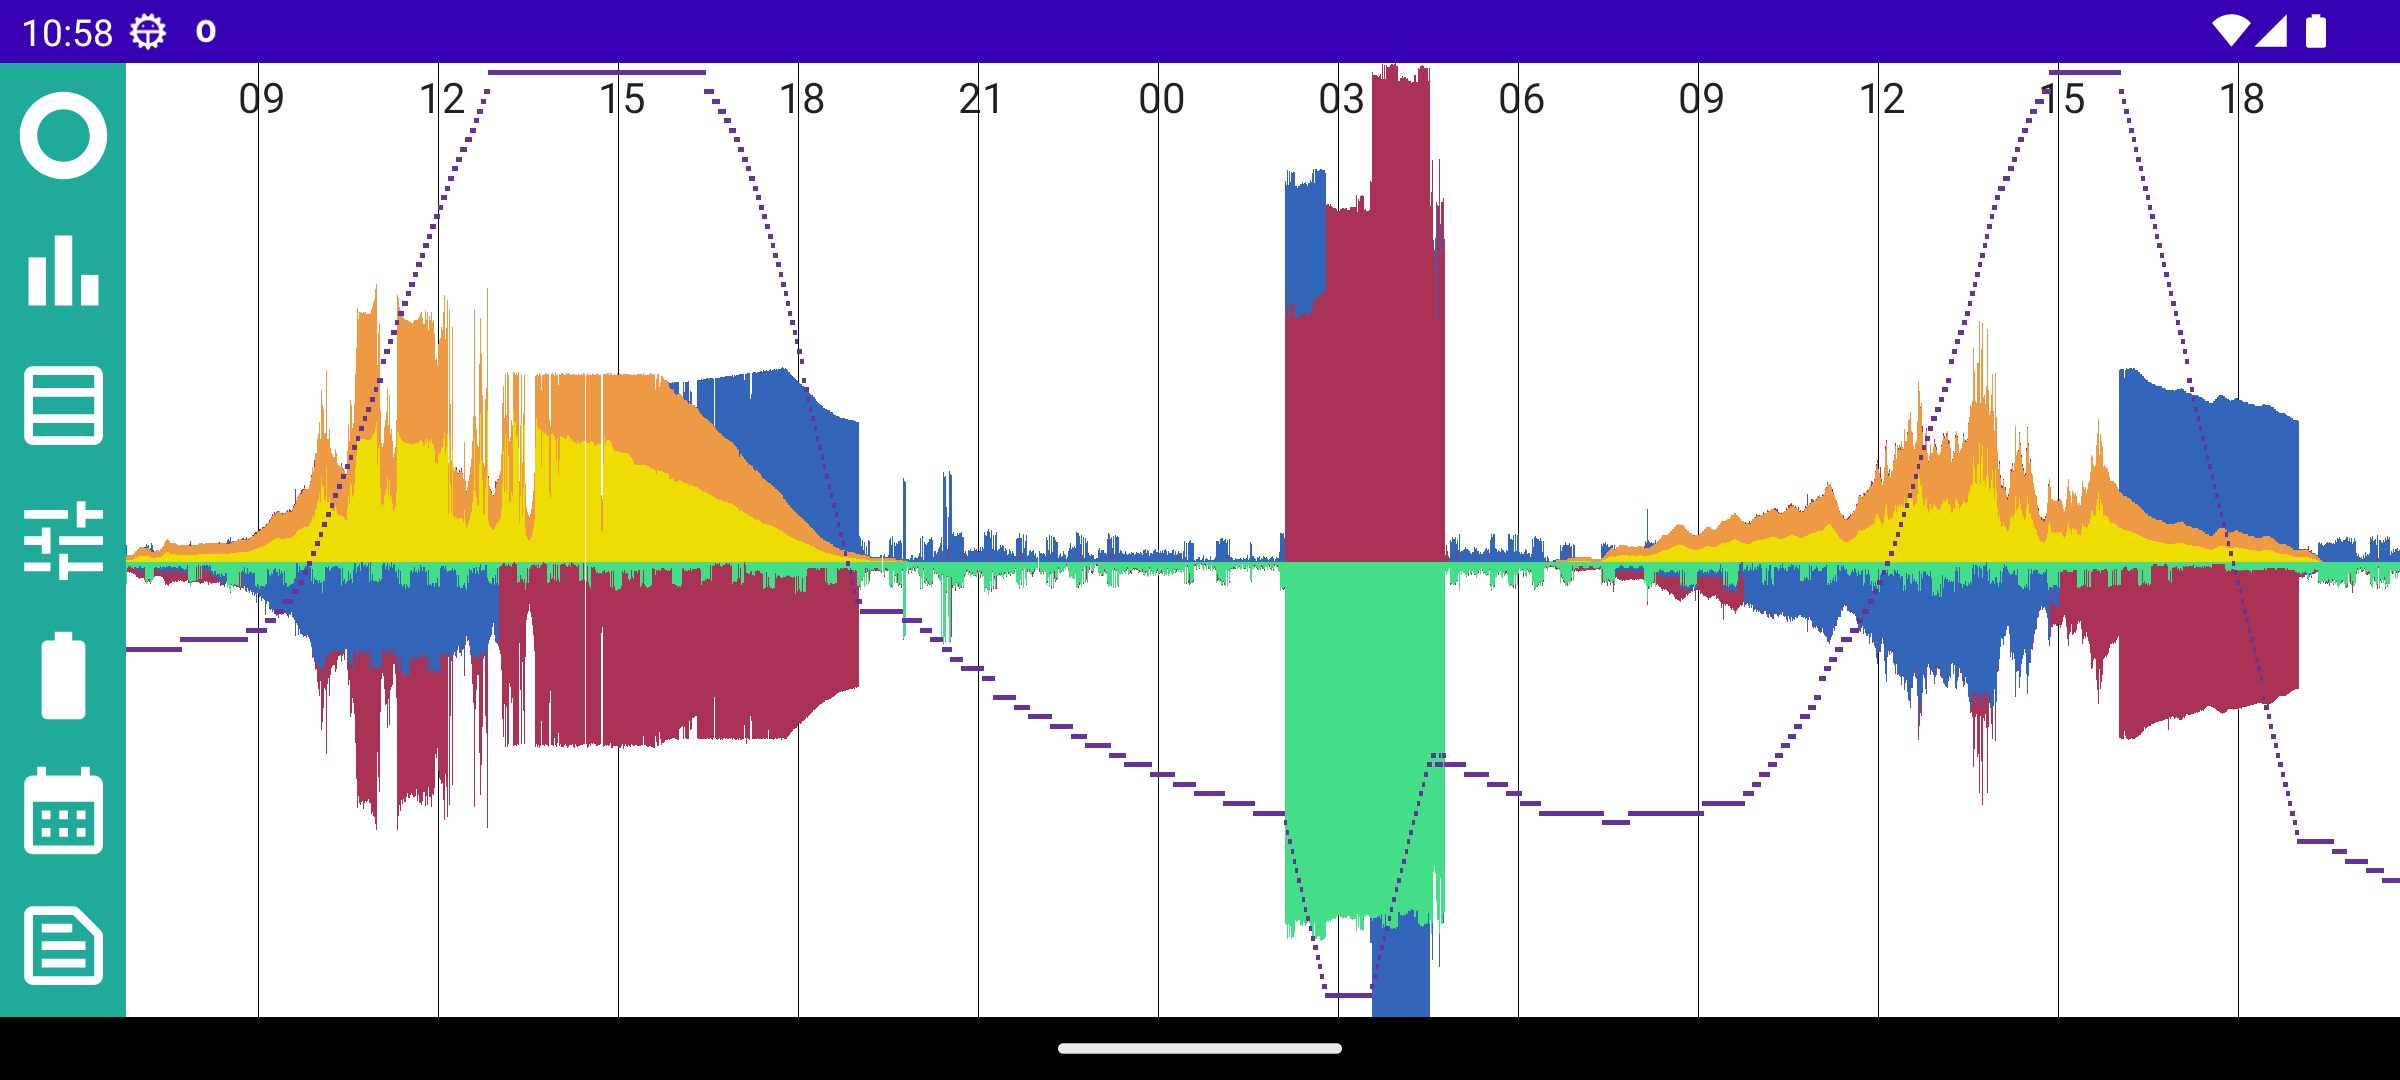
I find the same thing with the portal graphs. I have been working on extending my android inverter monitor app to record the data and display it on a graph.

Not ready for general release yet, but would this be something you might be interested in? Because it uses local network only you would need an android device that stays at home; a tablet or an old phone. It won't work on your main phone that you carry around with you (at least not without a VPN).

C
#3 chris_p

Rubikcube I'm very interested! Looks great!

R
#4 Rubikcube

Some days I even manage to get the settings right to avoid clipping ...

C
#5 chris_p

Rubikcube If you want a beta tester then I have an Android device running 24/7 displaying the GE app in our kitchen so I can see at a glance what is happening. Happily replace it with yours!

S
#6 SilverArt

Rubikcube Its baby brother is always on on my desk, happy to test if you would like.