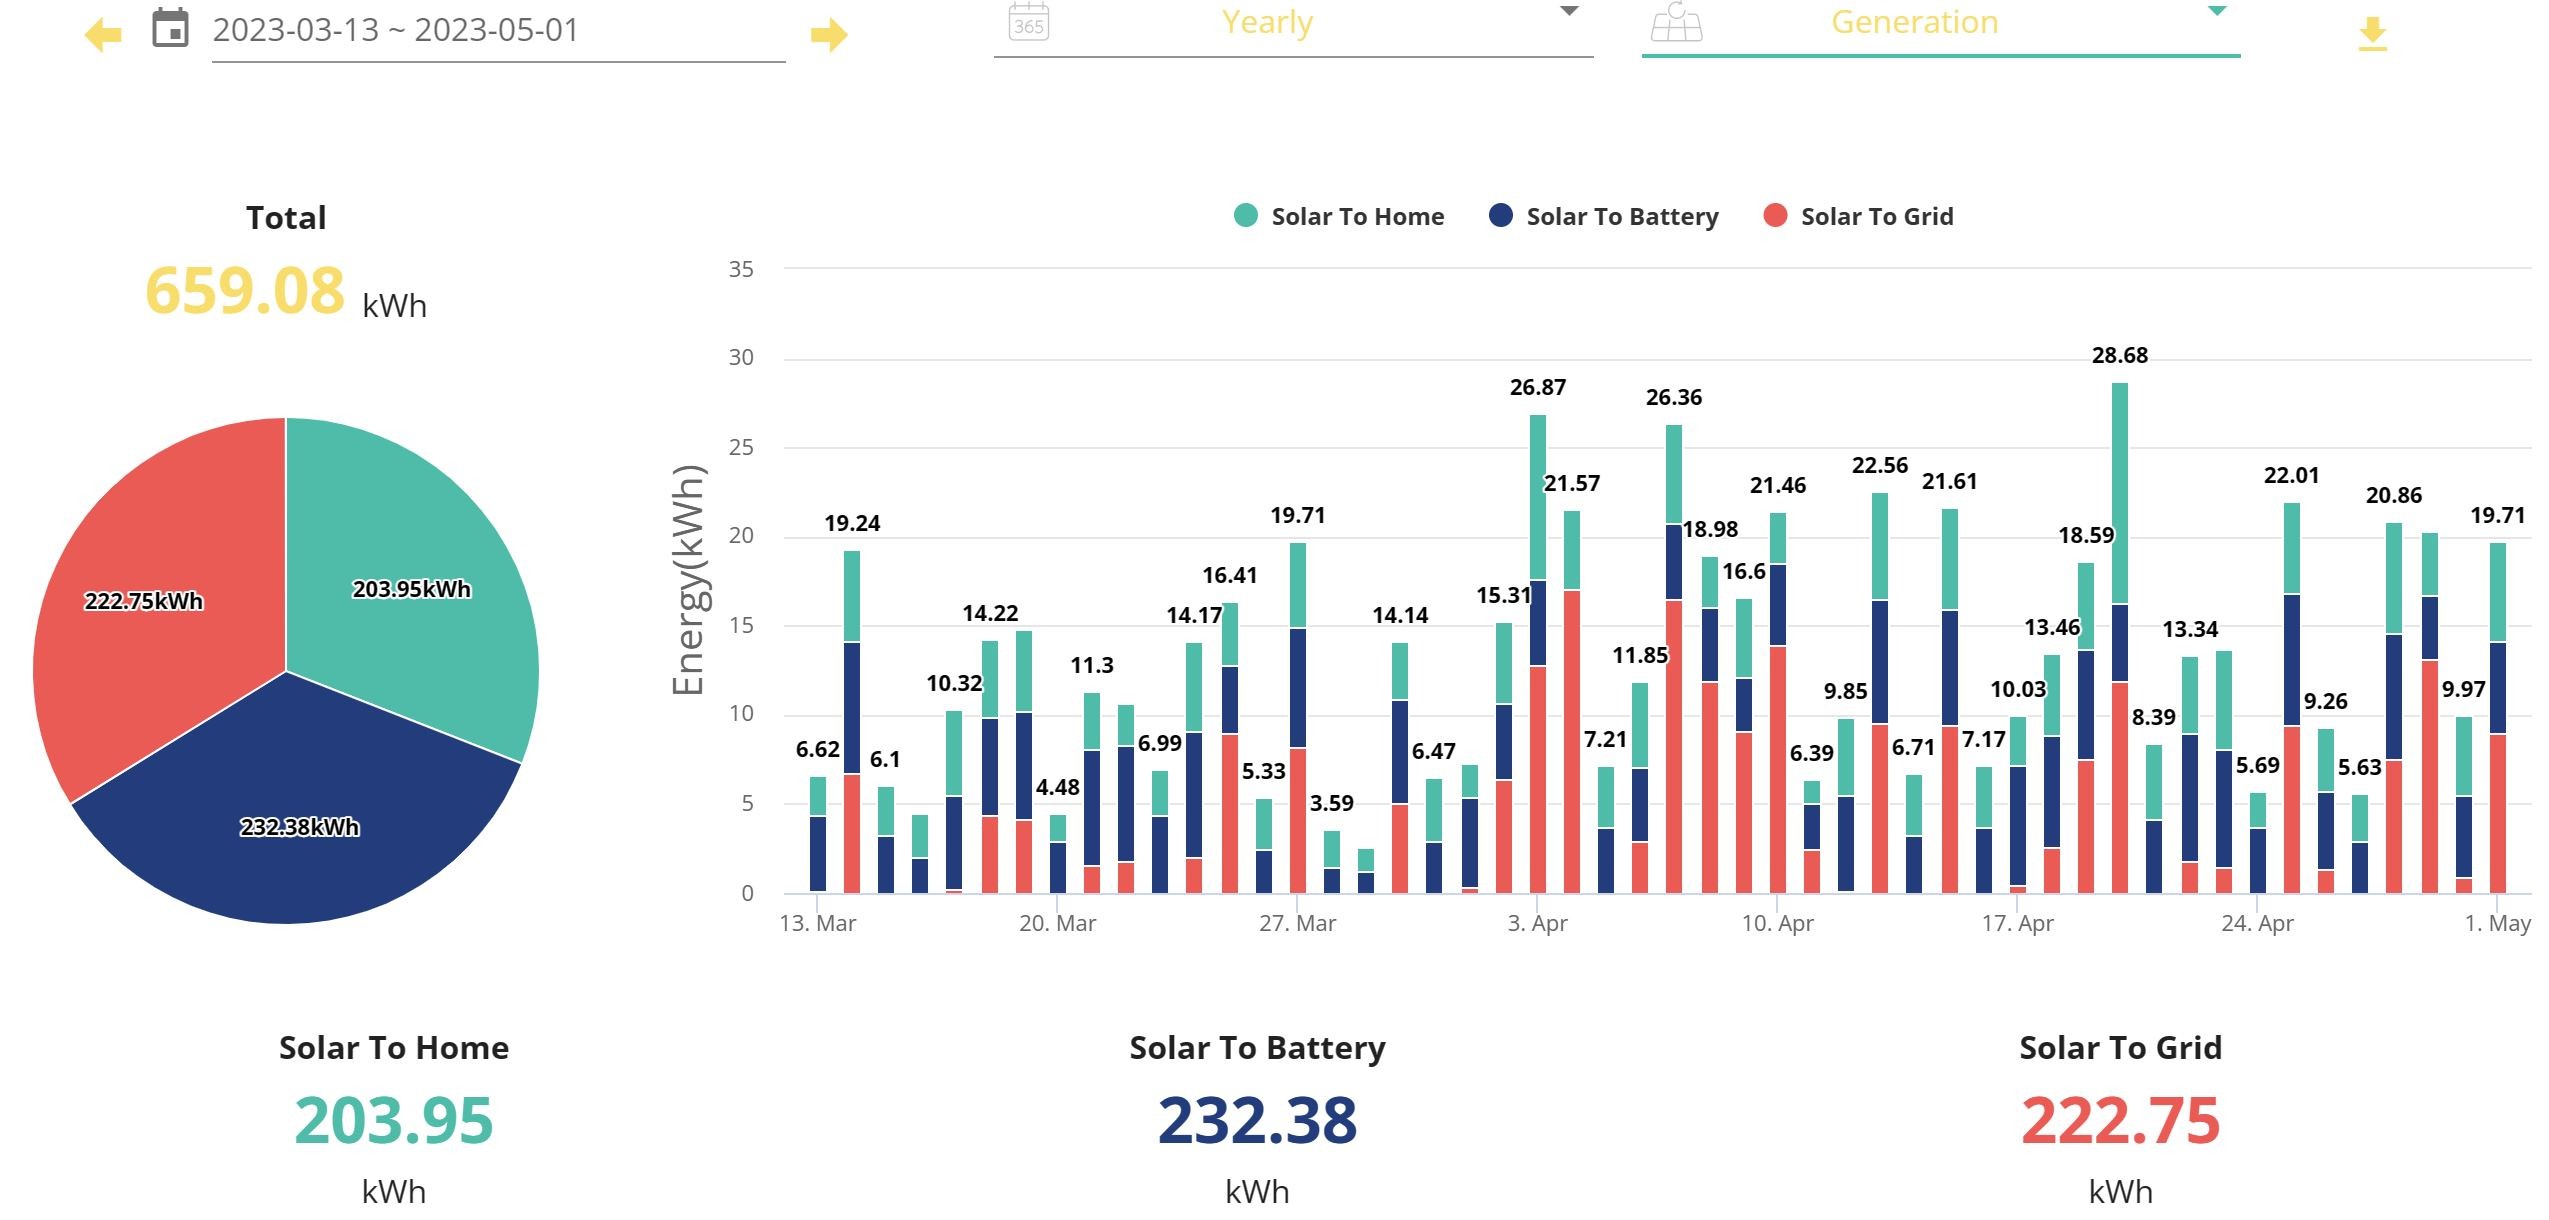
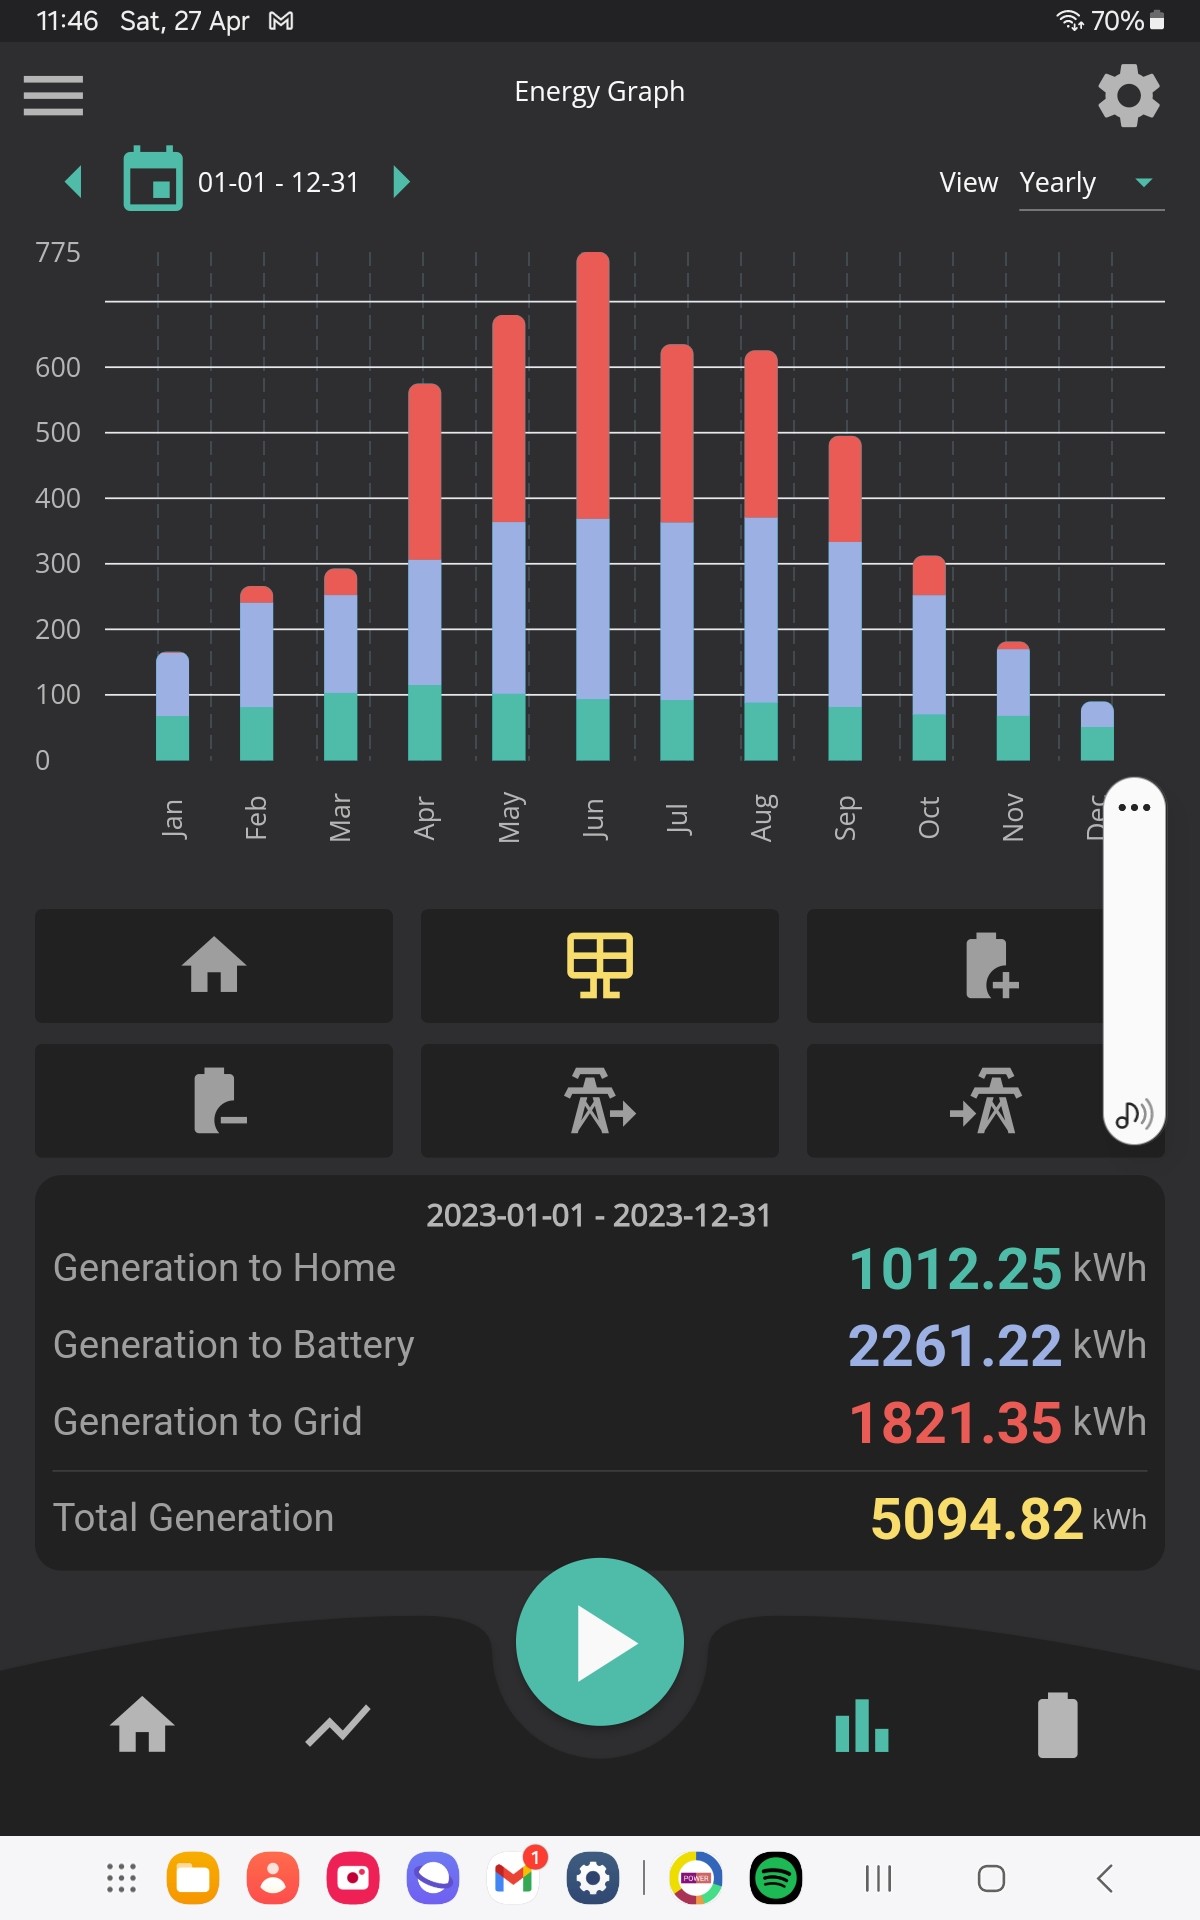
Hi All, I am new to solar and to the forum. Below is my first months graph, my question is what does this look like across a full year. I want to try and gauge my annual generation (obviously weather will determine) but if anyone has full year(s) use I would appreciate a look to give me an idea of how solar runs in the real world.
Right, I have a load of text above here, this should be a picture?
The number of panels etc is irrelevant to me, just want a picture.
Or as a really rough idea, maybe multiply April’s figures by 8?
(I looked at my own generation for April and for the year to get that multiplier - various factors could be at play, like is yours south orientated too?, etc)
N
#4naltsta
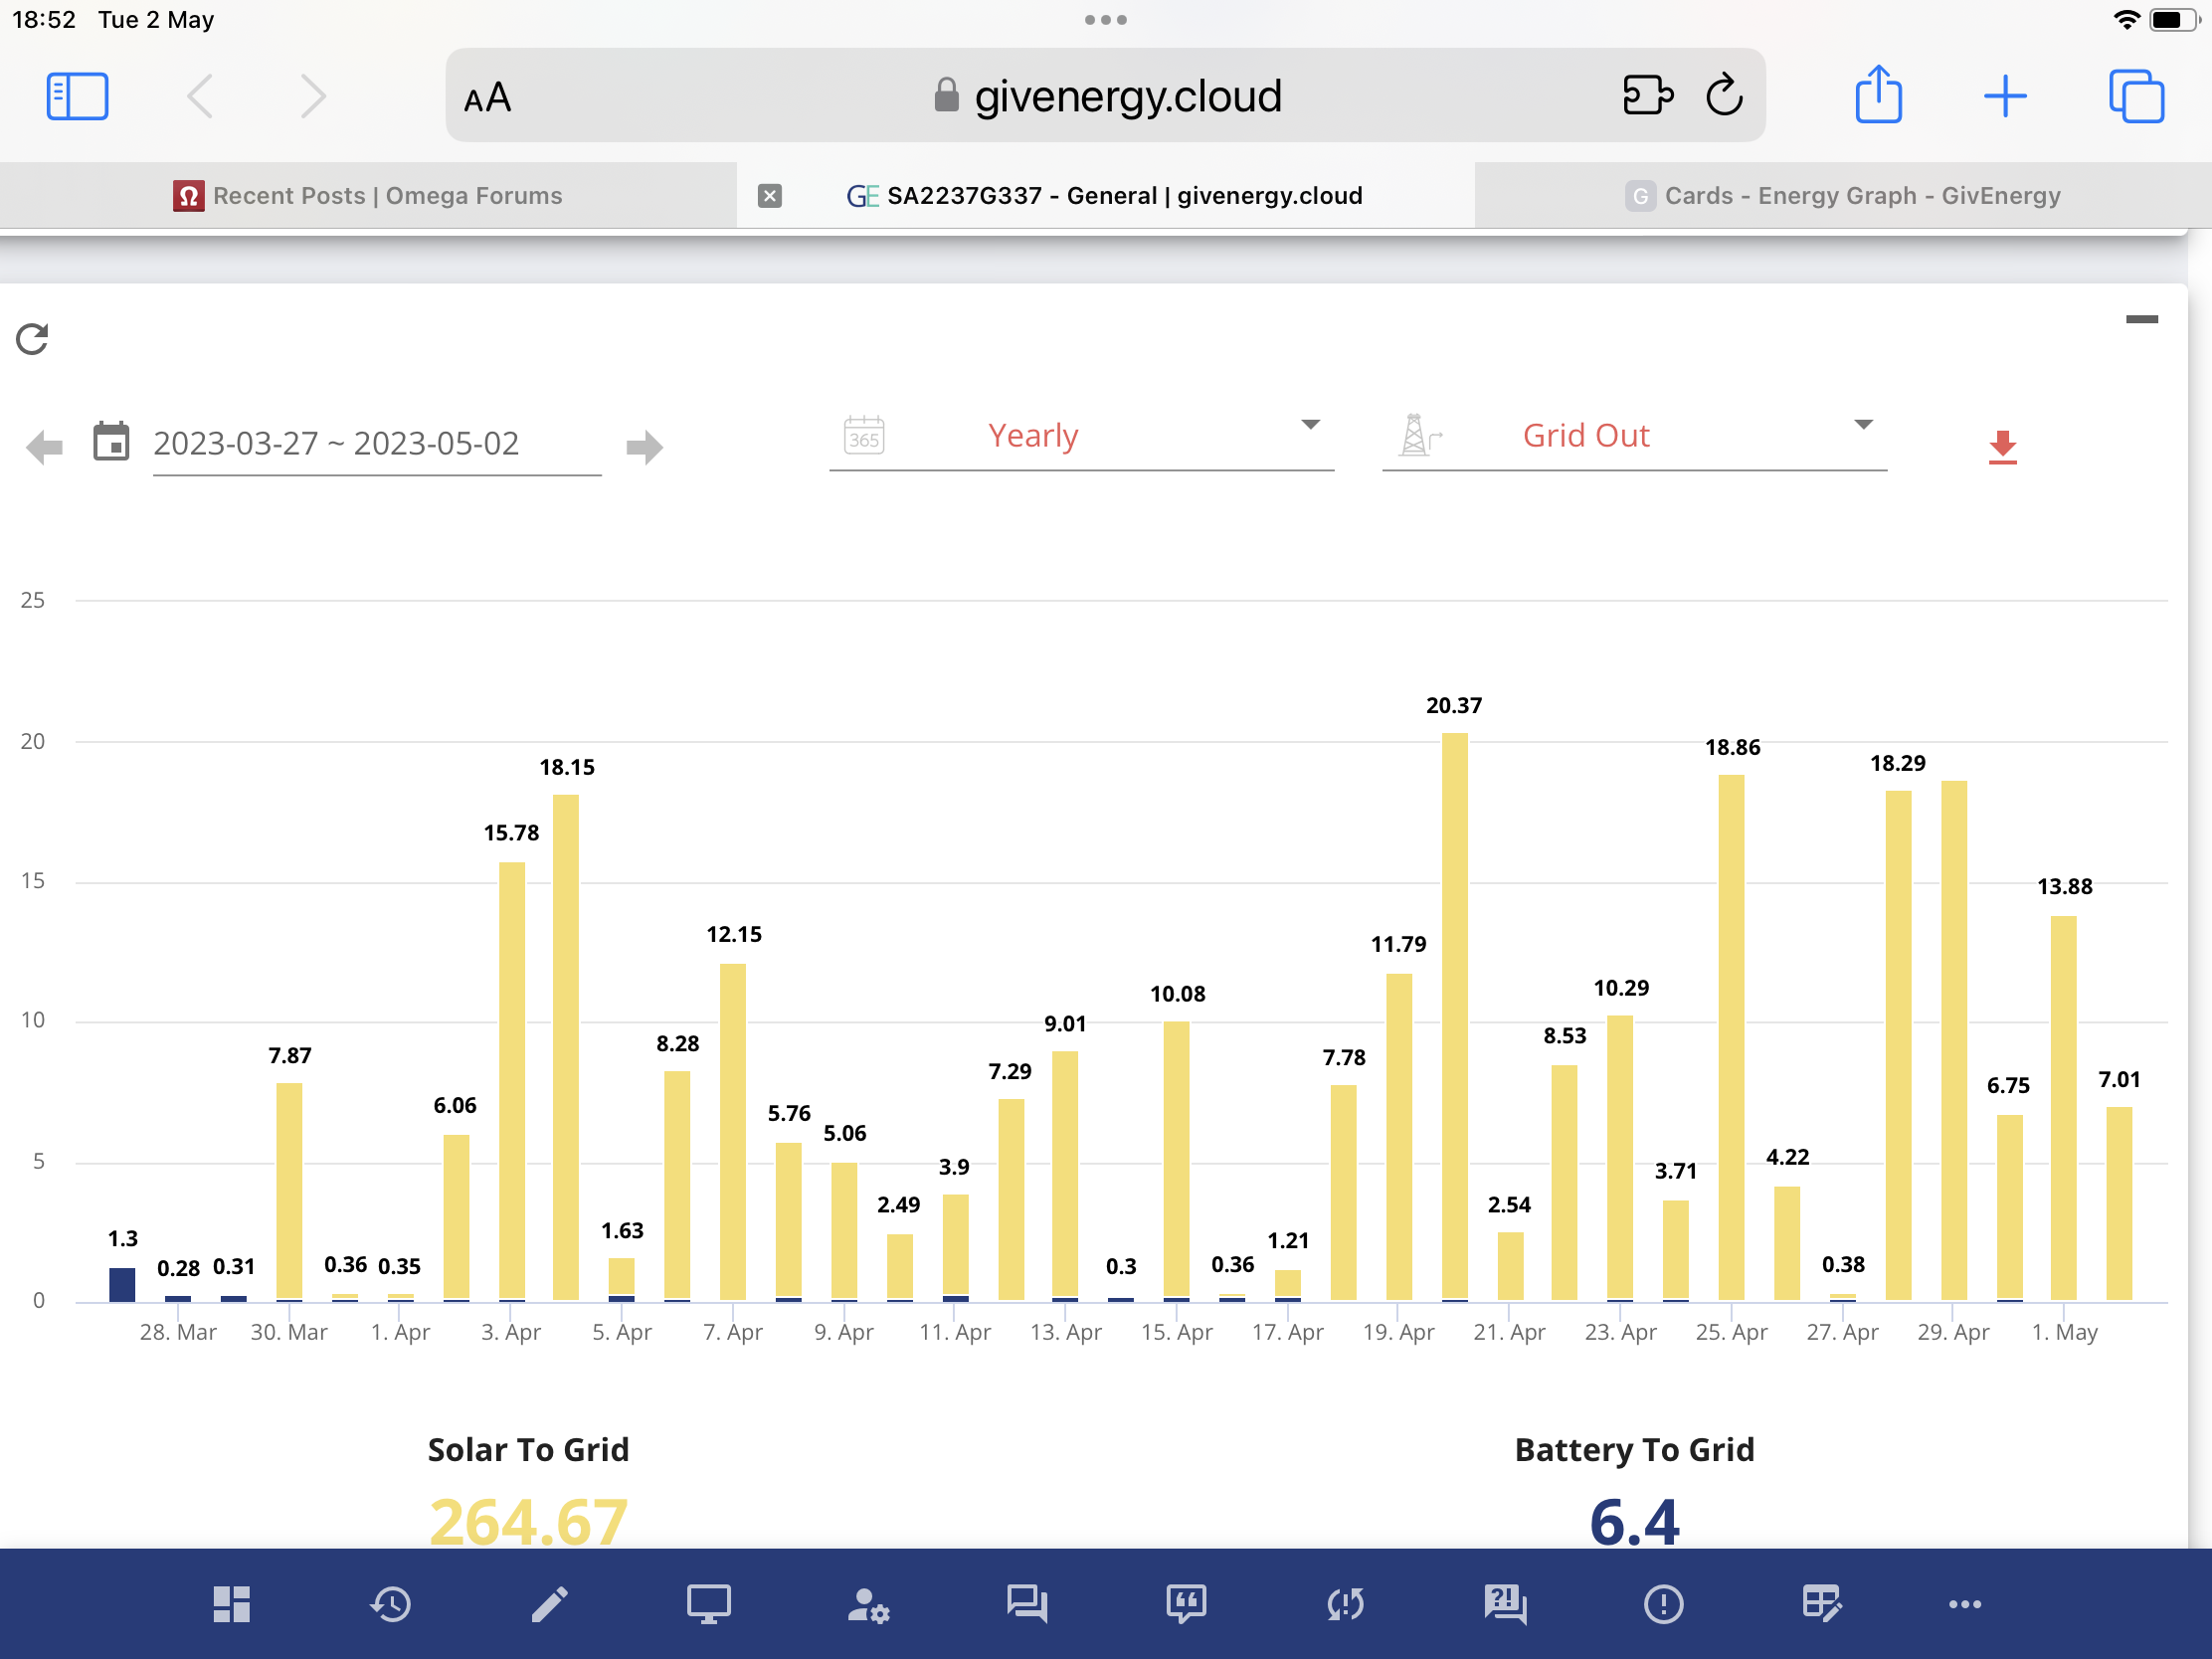
Watcher You probably want to compare solar generation rather than grid out...
Yes, exactly this. I was hoping to see a bell curve from someone to see what ‘average’ looks like through the year.
Like the 8 multiplier for a number but it will give an average not a visual.
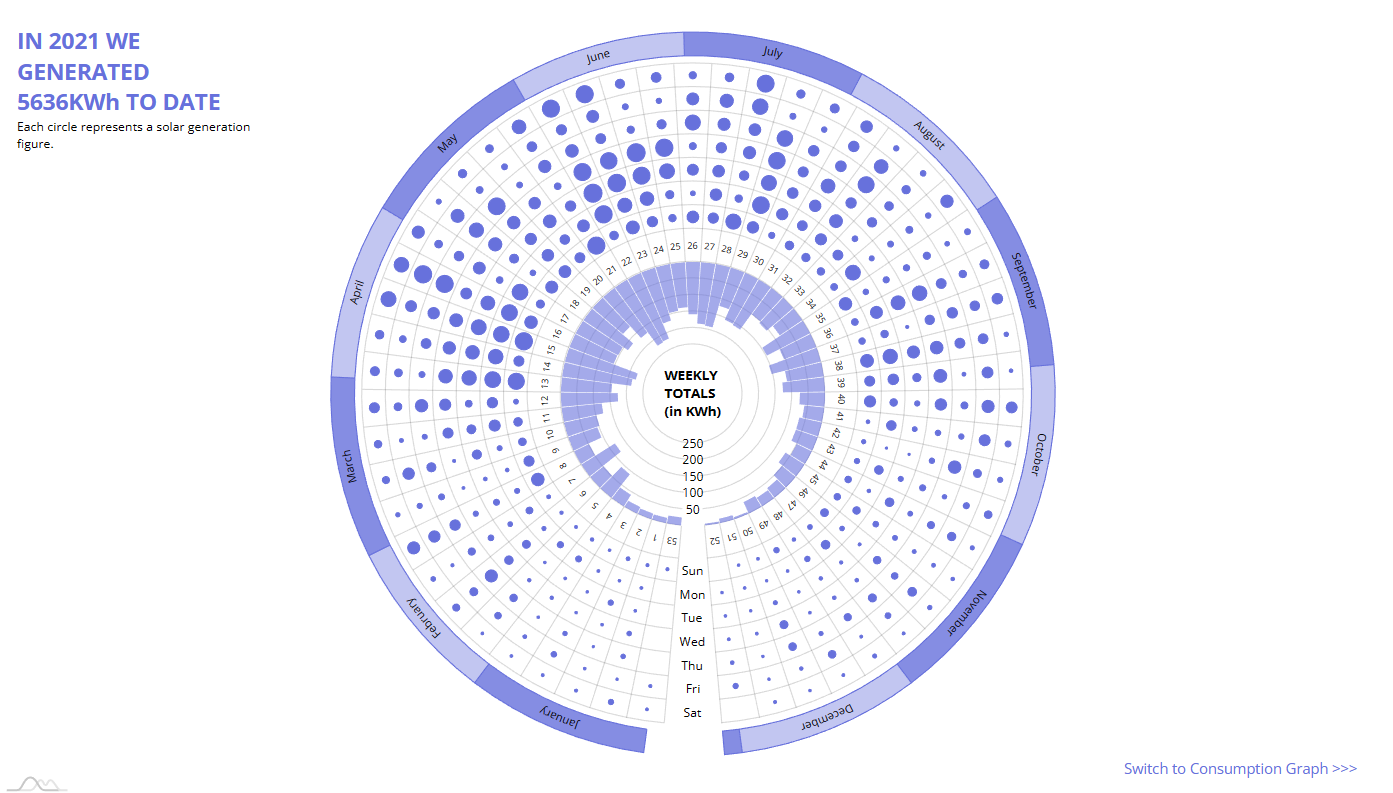
I did do another power wheel thing for mine: Every day of 2021 & half of 2022 (Givenergy's API changed and broke my data collector and it's yet to make it to the top of the To-Do List)
Can hover over each day & cycle through PV Generation, Consumption, Import, Export. https://terravolt.co.uk/live-pv-production/
M
#10Mal-Givenergy
My average for April on a 4kW system is 483kWh (12.4% of the annual production)
I have over 10 years of data for a south facing system for a rough guide to monthly averages.
As a guide a 4kw system should give around 4000kWh per year on average (usually a bit less)
Jan is around 4.5% of total production
Feb is around 8 % of total production
March is around 12% of total production
June is around 15% of total production
July is around 13% of total production
Aug is around 12% of total production
Sep is around 9% of total production
Oct is around 5.5% of total production
Nov is around 3% of total production
Dec is around 2% of total production
#11judgepd
Have a look at https://pvoutput.org/ it's a website where solar owners upload their data for logging and comparison purposes.
You can search by region, postcode and system size for a system similar to yours near to you and have a look at the data.
Mal-Givenergy Thanks. April and May are missing from your list - do you have them?
M
#13Mal-Givenergy
4monks
Sorry don't know what happened there.
April 12%
May 14%
May is usually really good but depends on direction and angle of the roof.
M
#14Mal-Givenergy
Actual values for each month and percentages.
Mean value 97.62 175.26 324.28 482.96 552.90 527.53 517.29 450.03 352.67 220.30 123.03 74.89 3898.76
Year portion 2.50% 4.50% 8.32% 12.39% 14.18% 13.53% 13.27% 11.54% 9.05% 5.65% 3.16% 1.92% 100.00%
T
#15Tim
Mal-Givenergy As a guide a 4kw system should give around 4000kWh per year on average (usually a bit less)
The amount is sensitive to orientation, roof angle and latitude. Our latitude is about the same as Liverpool (53°) for which there are solar charts going back ten years or more, and for our orientation (218°) and roof angle (43°), the average (according to the Liverpool data) is 950Wh/kWp installed per year. Our 12kWp arrays generated just under 10MWh last year.
X
#16x5toledo
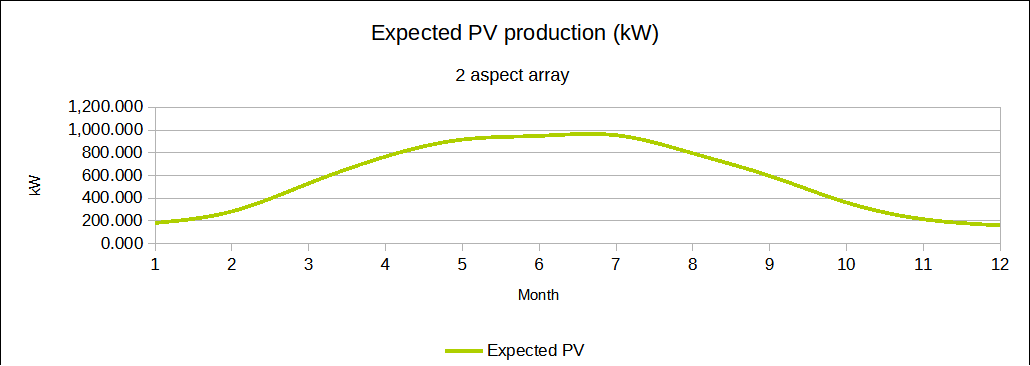
Before I got the solar array I went to the public site data for Solar Edge, and looked for a comparable latitude setup of similar kW size in the UK. Then I downloaded the data for this and shaped a curve from the four or five year's worth of readings, and plumbed this into a yield model for my panels. It ended up being pretty darn close! For those looking for similar models you can poke around here: https://monitoringpublic.solaredge.com/solaredge-web/p/home/public?locale=en_GB
S
#17spawneydave
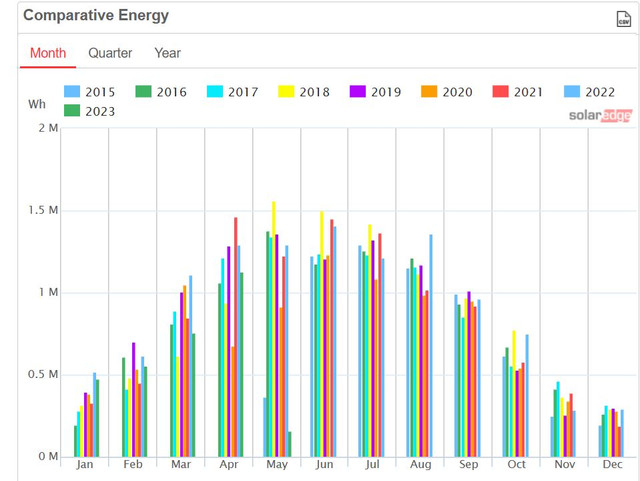
This is my graph for 8 years of production from my 10kw Solaredge system, every year is a little different but the trend is consistent, there is only 3 months a year when consumption is greater than production,.