Pete Thomas
There is quite a lot of discussion about this on various forums but from what I’ve learned and “simply put”…
LFP batteries have very different characteristics than other types of battery chemistry.
They have a non linear voltage throughout their charge/ discharge range. It’s a pretty flat line for most of the capacity range, unlike other chemistry batteries where you may see an almost straight line across most of the SOC range, or some type of predictable parabola.
It is notoriously difficult to assess the actual capacity remaining. I think it’s something like 70-80% of the voltage range is within a couple of 0.2 volts. ie if you just walked up to an unknown LFP battery and measured the battery voltage and it said 52 volts then the capacity of it could be 70% or it could be 30% ! The voltage also varies with temperature!
Because of this, displaying the “actual” percentage of an LFP battery is partly a guestimate or derived from input/output, look-up tables and some sort of accounting method combined with measurement.
When it’s charging and discharging, it indicates a slightly different voltage to when it’s at rest. And in addition when it’s discharging at different rates it’ll display a slightly different voltage too.
It was described to me once as kind of like measuring a fast flowing choppy river level from a boat: The measurement you get depends when and how choppy it is and how fast it’s flowing.
However if you measure it when the river is calm and flat it’s a lot more accurate. Same for LFP batteries, if you measure them when they are at rest, you get a far more accurate indication.
Solar/ house batteries are hardly ever at rest, so it makes it all the more difficult. When these batteries are “at rest” (‘fully’ discharged or charged - or at some manufacturer set ‘at rest’ parameter) this is when the system can attempt to get a reasonable guess at their true state of charge.
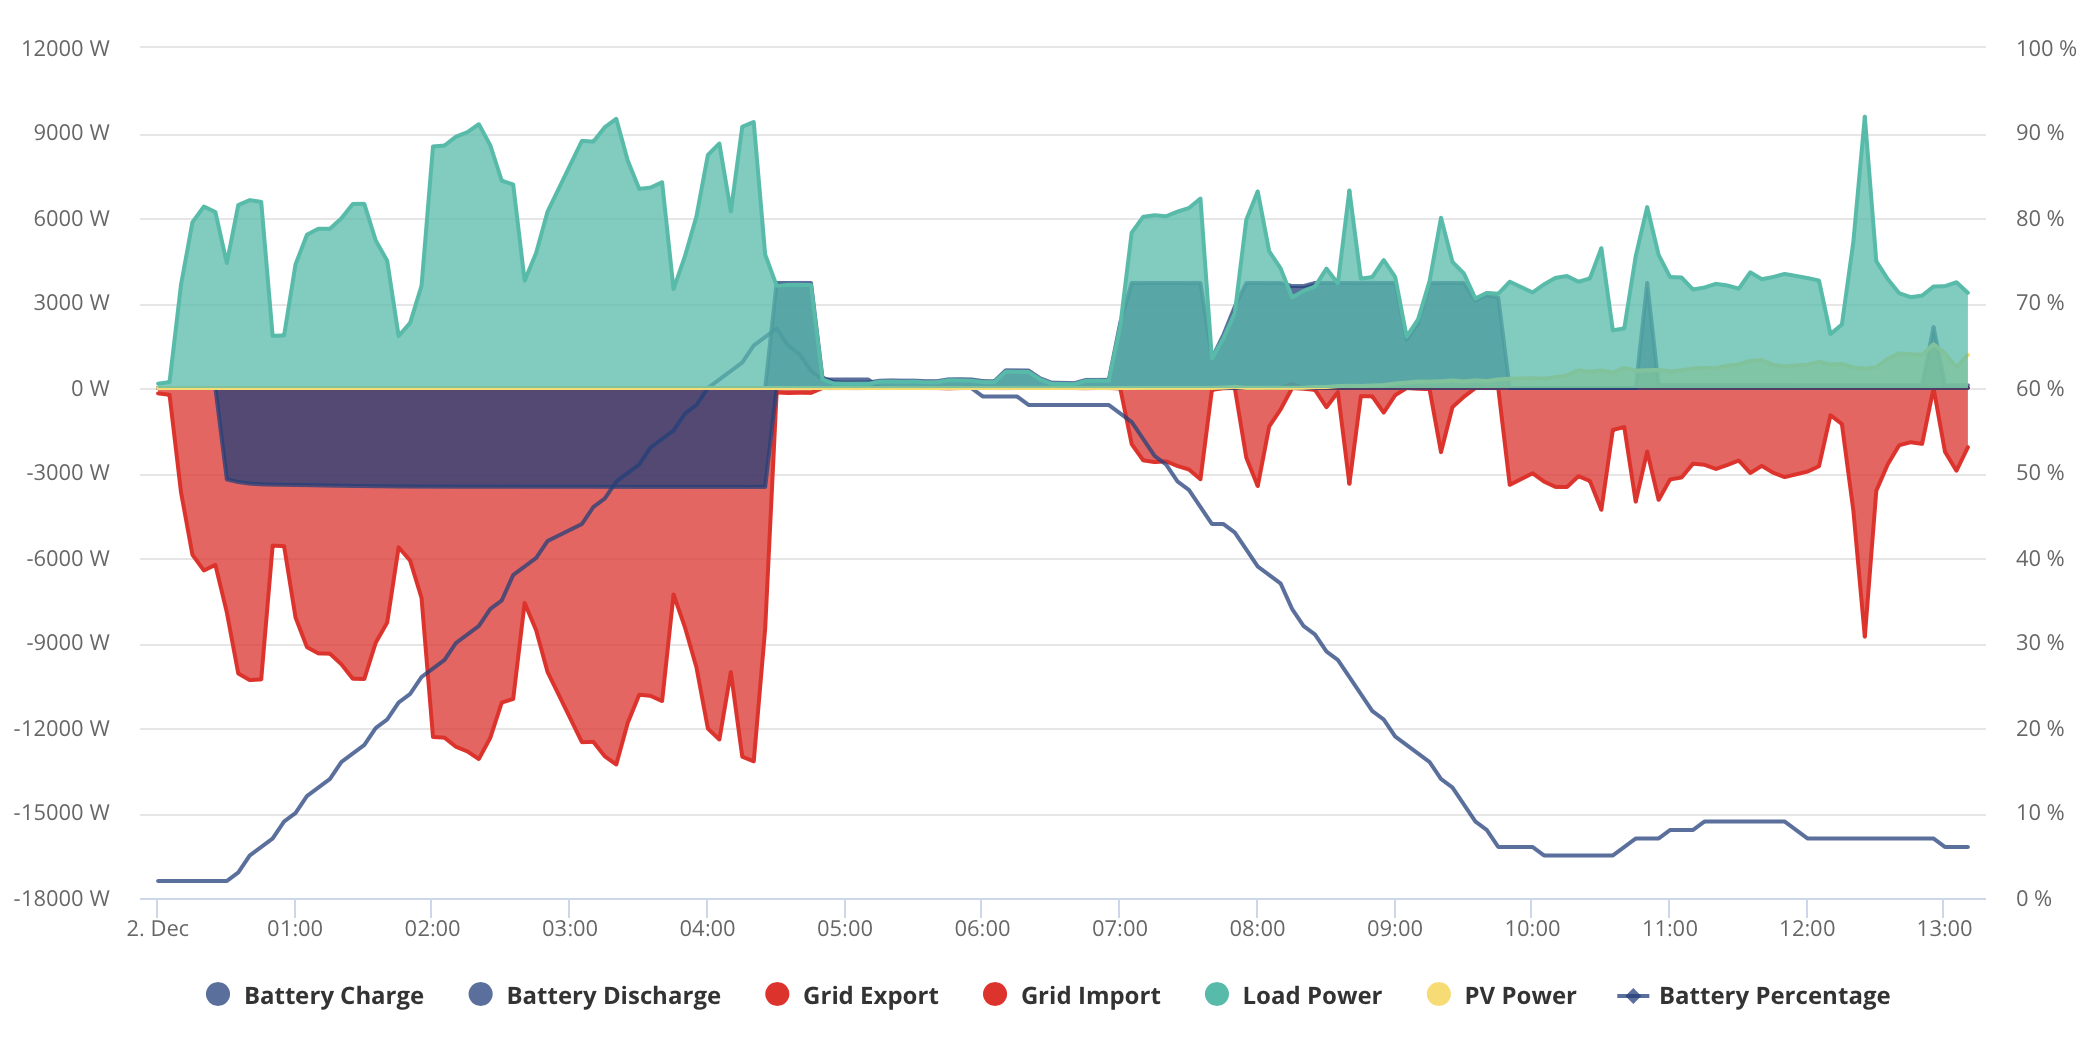
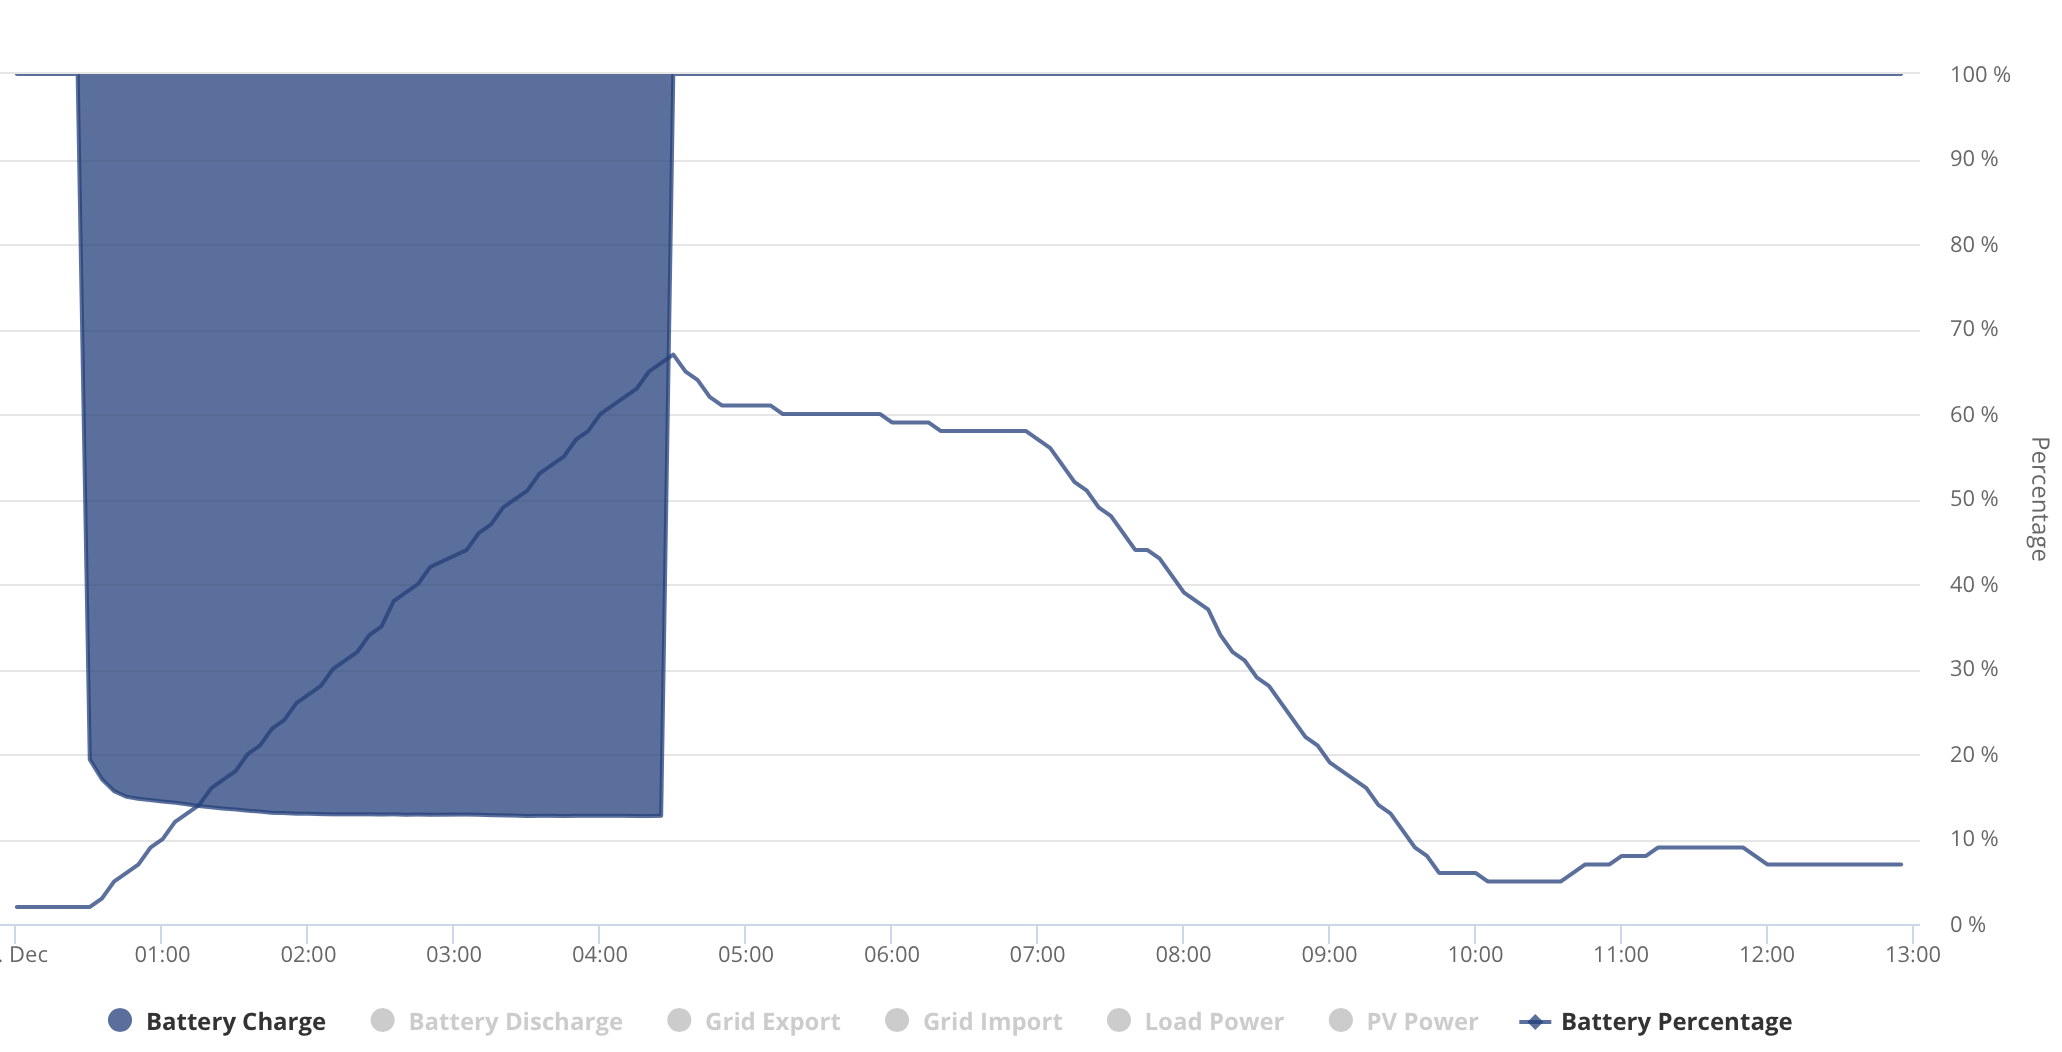
With your system what you are seeing is the battery re-calibrating itself to adjust the displayed percentage SOC (the ‘guesstimate’) closer to the actual SOC measured in the battery to correct your usable range of power and display it to you more accurately.
This is called the OCV calibration and it runs at certain times when the battery is at ‘idle’. Of course people don’t know this because it isn’t mentioned anywhere that the average customer would look.
We are all seeing this behaviour with the batteries and it’s “normal” for this type of GE battery (even though it’s a little bit frustrating and non-intuitive). We’d all just like to see it go from 0-100% and back again! It’d make planning much easier.
Previous firmware versions used different versions of this re-calibration method that produced different results (some a lot worse!). But I think that with the latest S/W versions GE are starting to Nail it down a lot better. (AIO excluded from that comment.)
You’ll see the SOC vary slightly at the top and bottom end / ‘at rest’.
This is my current understanding and I hope that explains what you’re seeing.