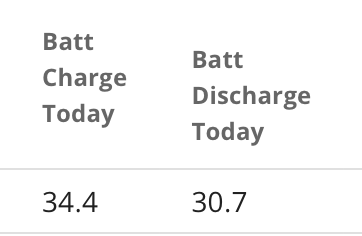
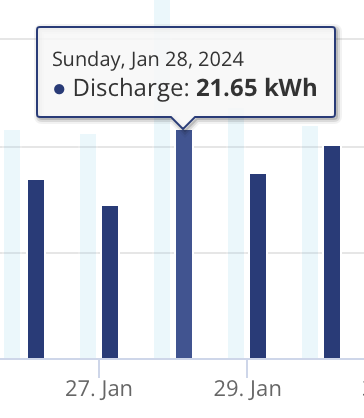
hoggy I was looking at this today too.
I downloaded data from the power graph
First thing to notice is that there are two bugs in the data pull
1) the columns are not labelled correctly
2) the total sums are not a correct addition of the numbers above, but the columns if they had been labelled correctly...
This suggested that my battery losses are a LOT over the last c.12 months to date -
Batt Charge 3134.07
less
Batt Discharge 2431.83
equals
Batt Losses 702.24
= 22%
I then started looking at the meter data from my AIO as hoggy suggests above.
That gave different readings for a random day (13-Feb-2024)

So it does appear that the sampling / calculation might be partly to blame for such a big disparity The biggest errors were for solar generation (erratic on a partly cloud day) and battery discharging in ECO mode is even more erratic given solar + home consumption needs. Plus a small SOC crash to add to the mix...
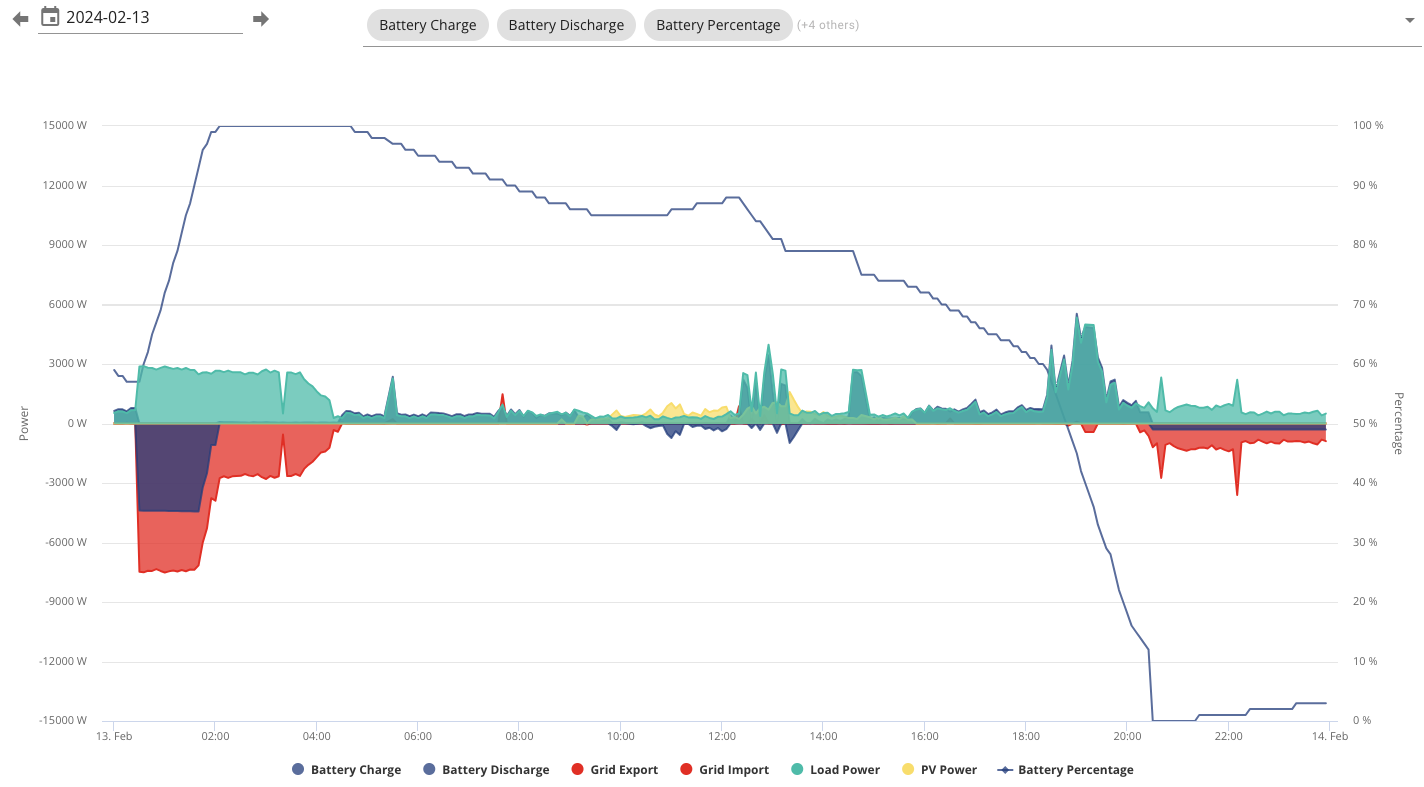
Looking at more recent months, the raw battery losses based on portal data have come down a lot - it's now more like 11% +/- 1% per month. A few thoughts as to why
- later firmware - better performance? (Currently on BMS9)
- warmer months - less heat losses?
- portal updates - fewer data issues?
So I pulled a more recent (and SOC crash free) day - 13th July - and the result showed a slight improvement in accuracy - albeit a fairly grid neutral day.

Googlesheet shared here in case anyone is interested:
https://docs.google.com/spreadsheets/d/1lMIPDcVCf1aLtZ-v5lgQDRRjEiGaKv7Qc5x_XTla2l4/edit?usp=sharing