Hi all, I've just had Solar panels with GivEnergy Inverter and battery. I'm struggling to understand how the system works.
My view is that the system should do the following:
Priorities energy from the solar panels to the demand of the house
If there is excess solar energy send this to the battery and then once the battery is full send excess to the grid.
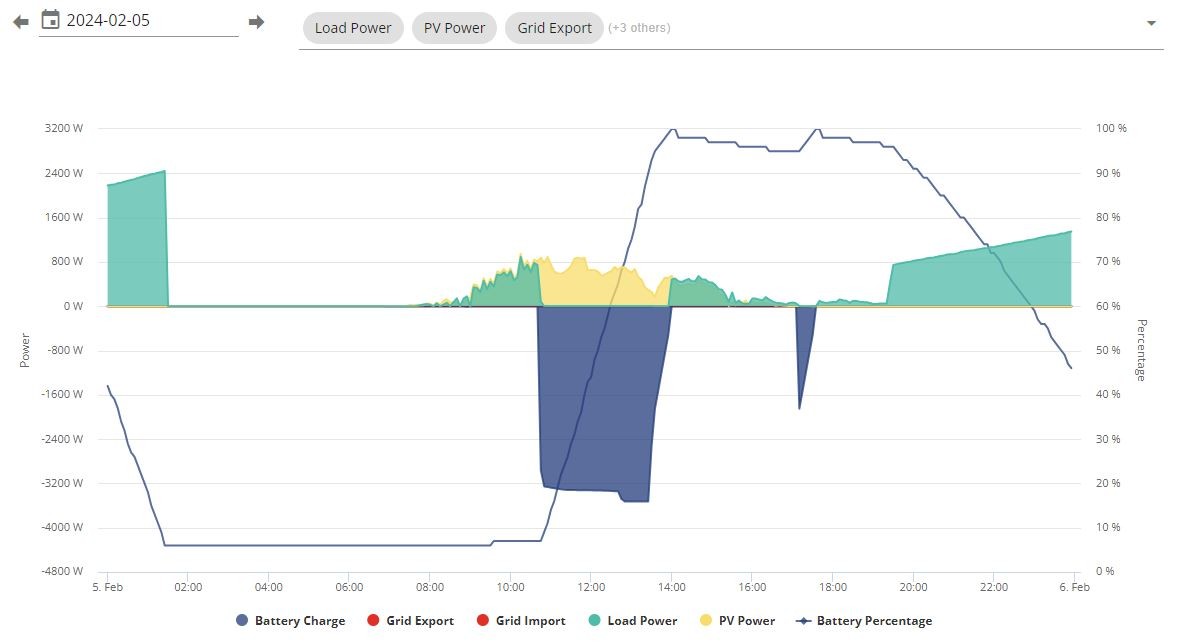
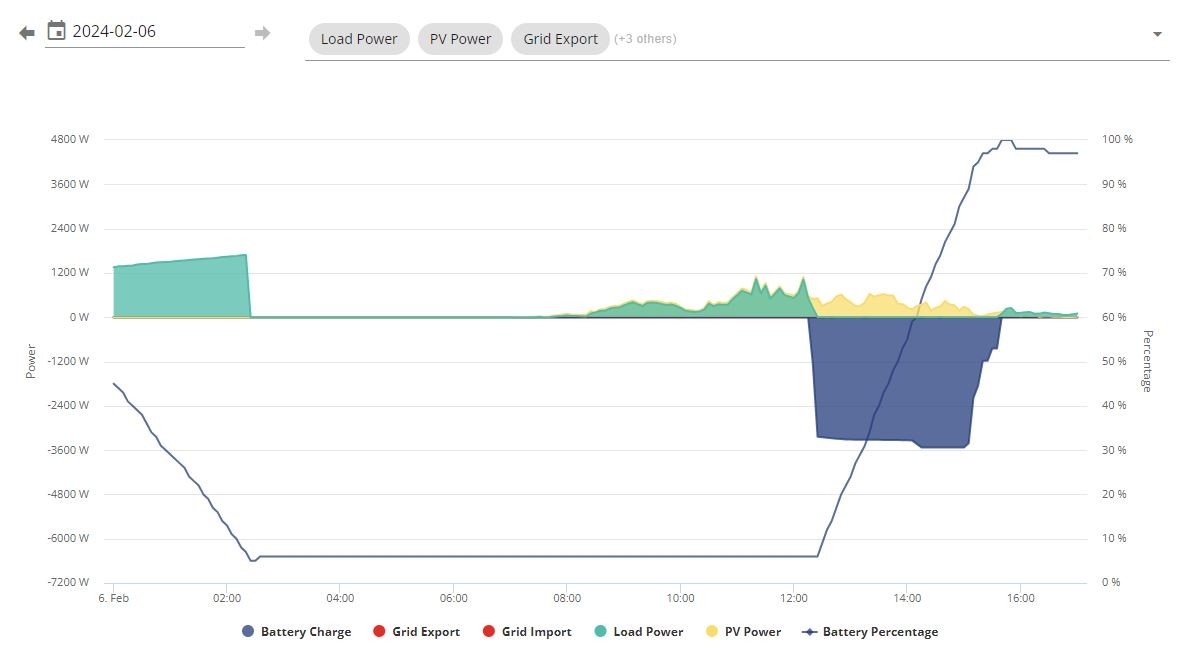
However, when I look at the charts, it looks like the solar generation maps the demand from the house, the battery remains empty unless i force it to charge and I don't see what is happening to any excess power that is being generated.
Nothing is coming from or going to the grid!
Am I missing something?
S
#2SJB
It sounds like your system has not been set up correctly. I would suggest getting your installer back in to investigate.
For most Givenergy systems the data for import, export, grid voltage/frequency/power come from the EM115 meter. If you are not getting any import/export data then it sounds like this isn't working as it should and without load data from the meter nothing else will work properly.
Once you have got your system working to get what you want the system to do then go to My Inverter and Click on the Settings tab, you'll want to enable ECO mode, leave the timed modes disabled, and ensure that the battery options are set to the maximum values for your inverter and battery (sliders across to the right).
D
#3DD
TokstolleUK However, when I look at the charts, it looks like the solar generation maps the demand from the house, the battery remains empty unless i force it to charge and I don't see what is happening to any excess power that is being generated.
Nothing is coming from or going to the grid!
Am I missing something?
Hi,
welcome to the forum.
The behaviour you describe is indeed the way the system should work. The excess power has to go somewhere - either there is some grid import/export, or the battery is involved. It is very unlikely that the solar power matches house consumption at all times.
Which chart are you looking at? Perhaps post an image? On the app, the power graph (jagged line icon on the bottom) shows power over time. There are 4 icons underneath it, depicting solar, consumption, battery, and grid. Touching an icon will toggle its line on the chart. Is it possible that you've turned off the display of the battery, which would result in a chart you describe (power apparently missing).
By what means are you forcing the battery to charge ?
T
#4TokstolleUK
T
#5TokstolleUK
I forced the battery to charge via the green quick settings button on the App which allows you to charge, discharge, resume or pause!
I waited to see if it was charging the battery but there was no activity, so I clicked on the "Charge Now" icon.
Z
#6Zakalwe
In the app click the cog-wheel in the top right of the home screen
Under Battery Charge Settings change the Charge mode to Solar+Grid.
Under Battery Discharge Settings change Discharge mode to Dynamic
Then click on the Save button.
This will give you exactly what you are after.
Z
#7Zakalwe
Also, if you have a cheap rate electricity tariff then you can also tell the system to charge the battery to whatever level you want (the SOC-State of Charge). Go back into the cog-wheel and under Battery Charge Settings click Start Time and set the start of your cheap period. Click End Time and input the end of your cheap period. Click Charge up To and enter the SOC level that you want to exit the cheap period with. Again, click Save.
Z
#8Zakalwe
Finally, leave the Quick Settings on Play. In this mode, the system will try and meet any house demand from the batteries and solar generation, assuming the batteries have some charge. If there is excess solar generation then it will try and charge the batteries. If the batteries are full and there is excess power generation then it will export.
D
#9DD
TokstolleUK Nothing is coming from or going to the grid!
This is based on the GE data? How about your smartmeter - does it agree? IHD may not be able to show export - I don't think mine does - but it would show import. The meter itself may have an LED which flashes to indicate activity, and mine has a tiny icon to show whether that activity is import or export.
As above, I'm thinking CT clamp isn't correctly fitted, or the EM115 meter (in the CU) isn't working. You may be able to tell from its display what it thinks is going on.
DD It is very unlikely that the solar power matches house consumption at all times.
If the CT clamp is broken, then the inverter probably would believe that consumption exactly matches solar. Though clearly the battery does discharge if it has power and there is no solar. (Odd that the load appears to increase linearly over time at night.)
T
#10TokstolleUK
Zakalwe I have done this, will see what happens. Thanks
T
#11TokstolleUK
DD i will check the meter. It's just odd there is little to no Grid activity since commissioning on Friday.
T
#12TokstolleUK
T
#13TokstolleUK
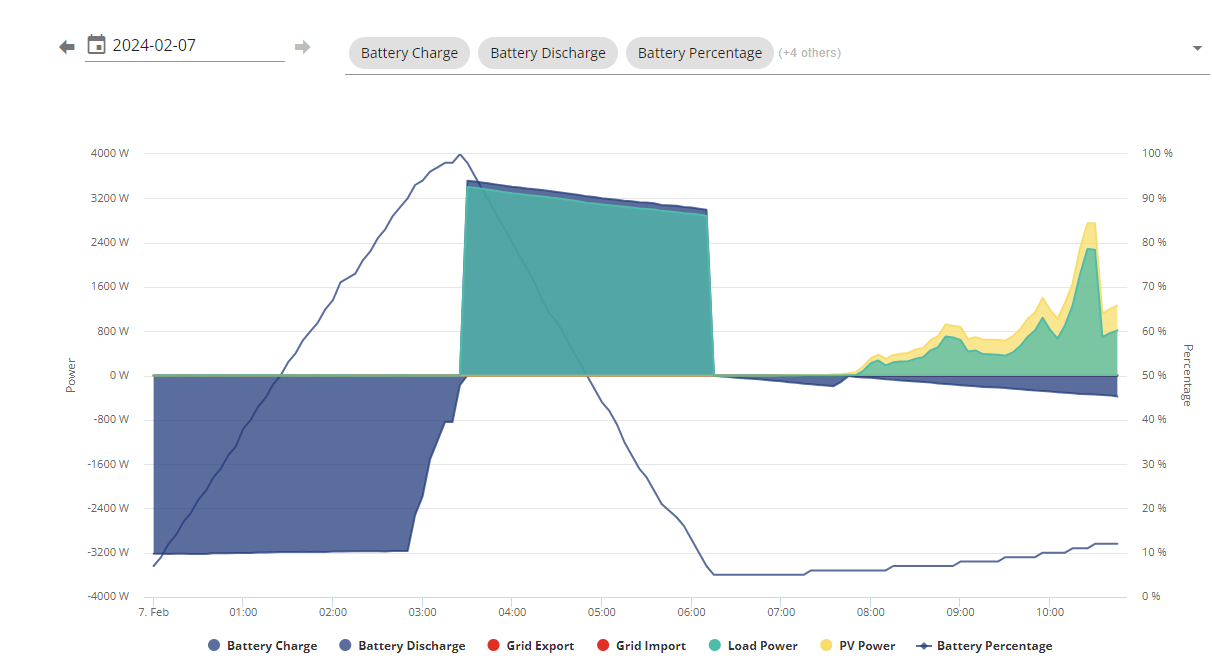
I made the suggested changes and this is what i have.
Why would there be a peak in Load Power between 3 and 6:30?
Why is the PV power and load power aligning once the sun comes up?
Why is there no Grid activity?
S
#14SJB
TokstolleUK Why would there be a peak in Load Power between 3 and 6:30?
Who knows but it looks as though your battery was discharging to meet the load, or perhaps it was discharging and generating the load figure because the inverter is not getting any grid data. Check your settings again to see if any discharging or charging sessions were specified. Check the remote control log to see if it's recorded any activity.
TokstolleUK Why is the PV power and load power aligning once the sun comes up?
If you have no grid data then the load power can only follow the PV power.
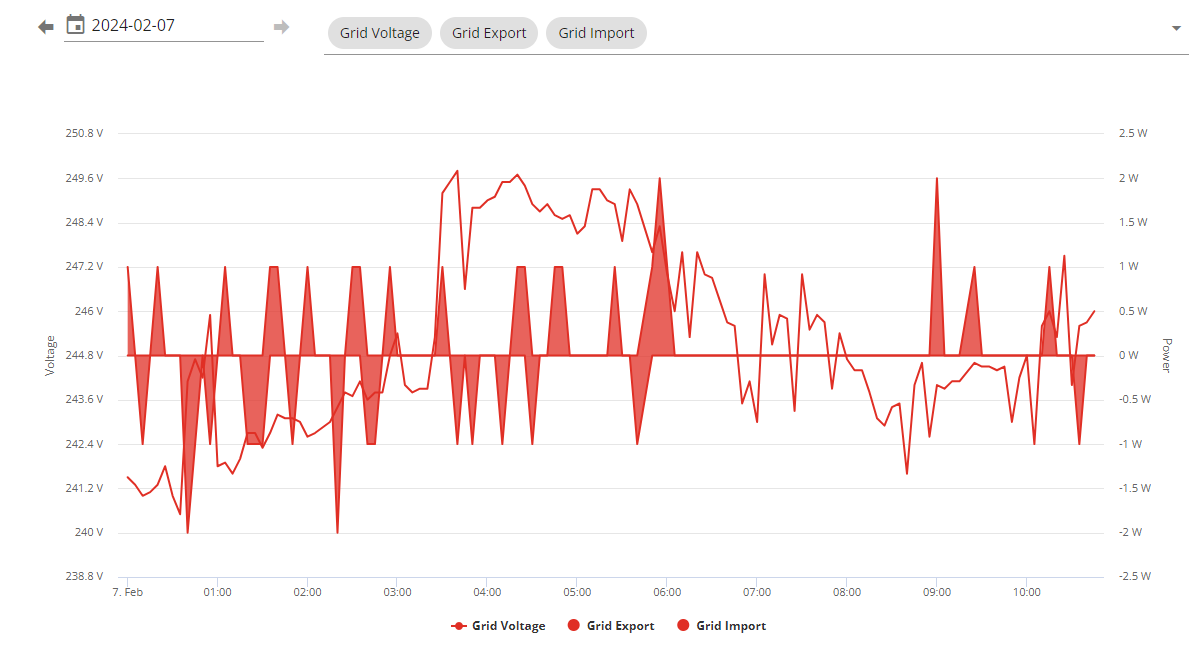
There is always Grid activity - if it is not showing in the portal then there is a fault in the system. As mentioned above this is likely to be a fault with the EM115 or the CT clamp it uses. It may be possible that it is not connected to the inverter or that the inverter is faulty.
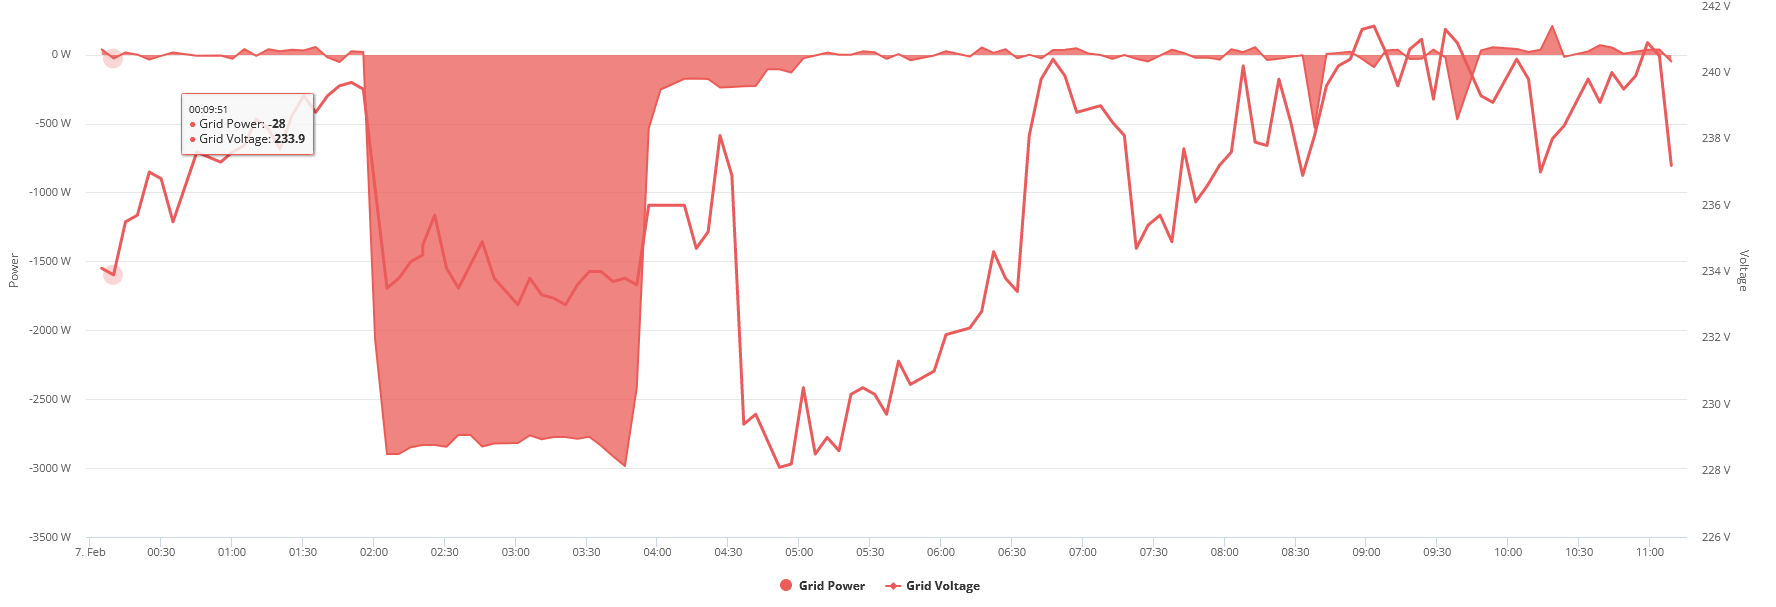
Have a look at the Grid Tab the chart should be showing lots of fluctuation - here is what mine looks like:
You'll see lots of little fluctuations throughout the day, I have a large amount of import between 0200-0400 where my battery is being charged. I would guess from your graph that you should have import between 0000-0300 and export from 0330-0800.
Get your installer to come back and check the system.
T
#15TokstolleUK
This is what I have the voltage and power look very low compared to yours.
I will contact the installer.
D
#16DD
TokstolleUK I don't know for certain, but I think the inverter has to infer the consumption, since it cannot measure it directly. On a working system, the only measurement it has is the grid import/export through the meter tails. And it knows how much AC it is generating/consuming. So it infers that the consumption is the difference. Your system appears to be unable to measure the grid activity, and so it basically incorrectly calculates that the consumption is whatever it is doing on its AC port: if it is generating 1kW, and it can't see it going out on the grid, it must assume it is being consumed. This is probably why it wasn't charging battery from solar: it perceived that all the solar was needed for the house load. It's basically getting into a stable equilibrium, and doesn't change anything because what it's currently doing appears to be working - the primary goal of eco mode is to ensure that grid import/export is 0.
I've been pondering why the blocks of power were gently tapering, and my best guess is that it's just an effect from feedback. Eg produces very slightly less, sees that the grid export doesn't change, so assumes consumption has gone down very slightly. And so it continues. Someone else's system might very gently increase the power in the same situation - there's probably some randomness. (Unless GE deliberately designed in a feature to try making small reductions to measure the effect. But if that was the case, I'd expect it to tail off a bit faster than this.)
T
#17TokstolleUK
GivEnergy has seemingly fixed the issue. They said the issue stemmed from an incorrect meter setup on the portal, where it was set to "CT" instead of "1xmeter" This misconfiguration led to the system erroneously treating house load and PV values as identical!
The charts look a bit better now, although i can't really tell if the Solar is doing much with the weather we are currently experiencing!