C
#1 Chaz
I have 2 strings on my house. Using the Inverter & Power Graphs I can separate them to show the power output at a given time.
Is there a way that I can see the energy that has been created with the separate strings on a given date?

I have 2 strings on my house. Using the Inverter & Power Graphs I can separate them to show the power output at a given time.
Is there a way that I can see the energy that has been created with the separate strings on a given date?
Not on the portal as that information isn't displayed - its available, just not displayed.
You could do it using GivTCP/HA.
Vestas I've just set up HA and installed GivTCP. I'm still new to HA but I can't see what the entity would be for energy per string. I can find one for total PV but not individual string.
Any ideas?
Chaz they’re called sensor.givtcp_xxxxx_pv_power_string_1 and _2. There’s also current_string_1 and 2 and voltage_string_1 and 2
Eg 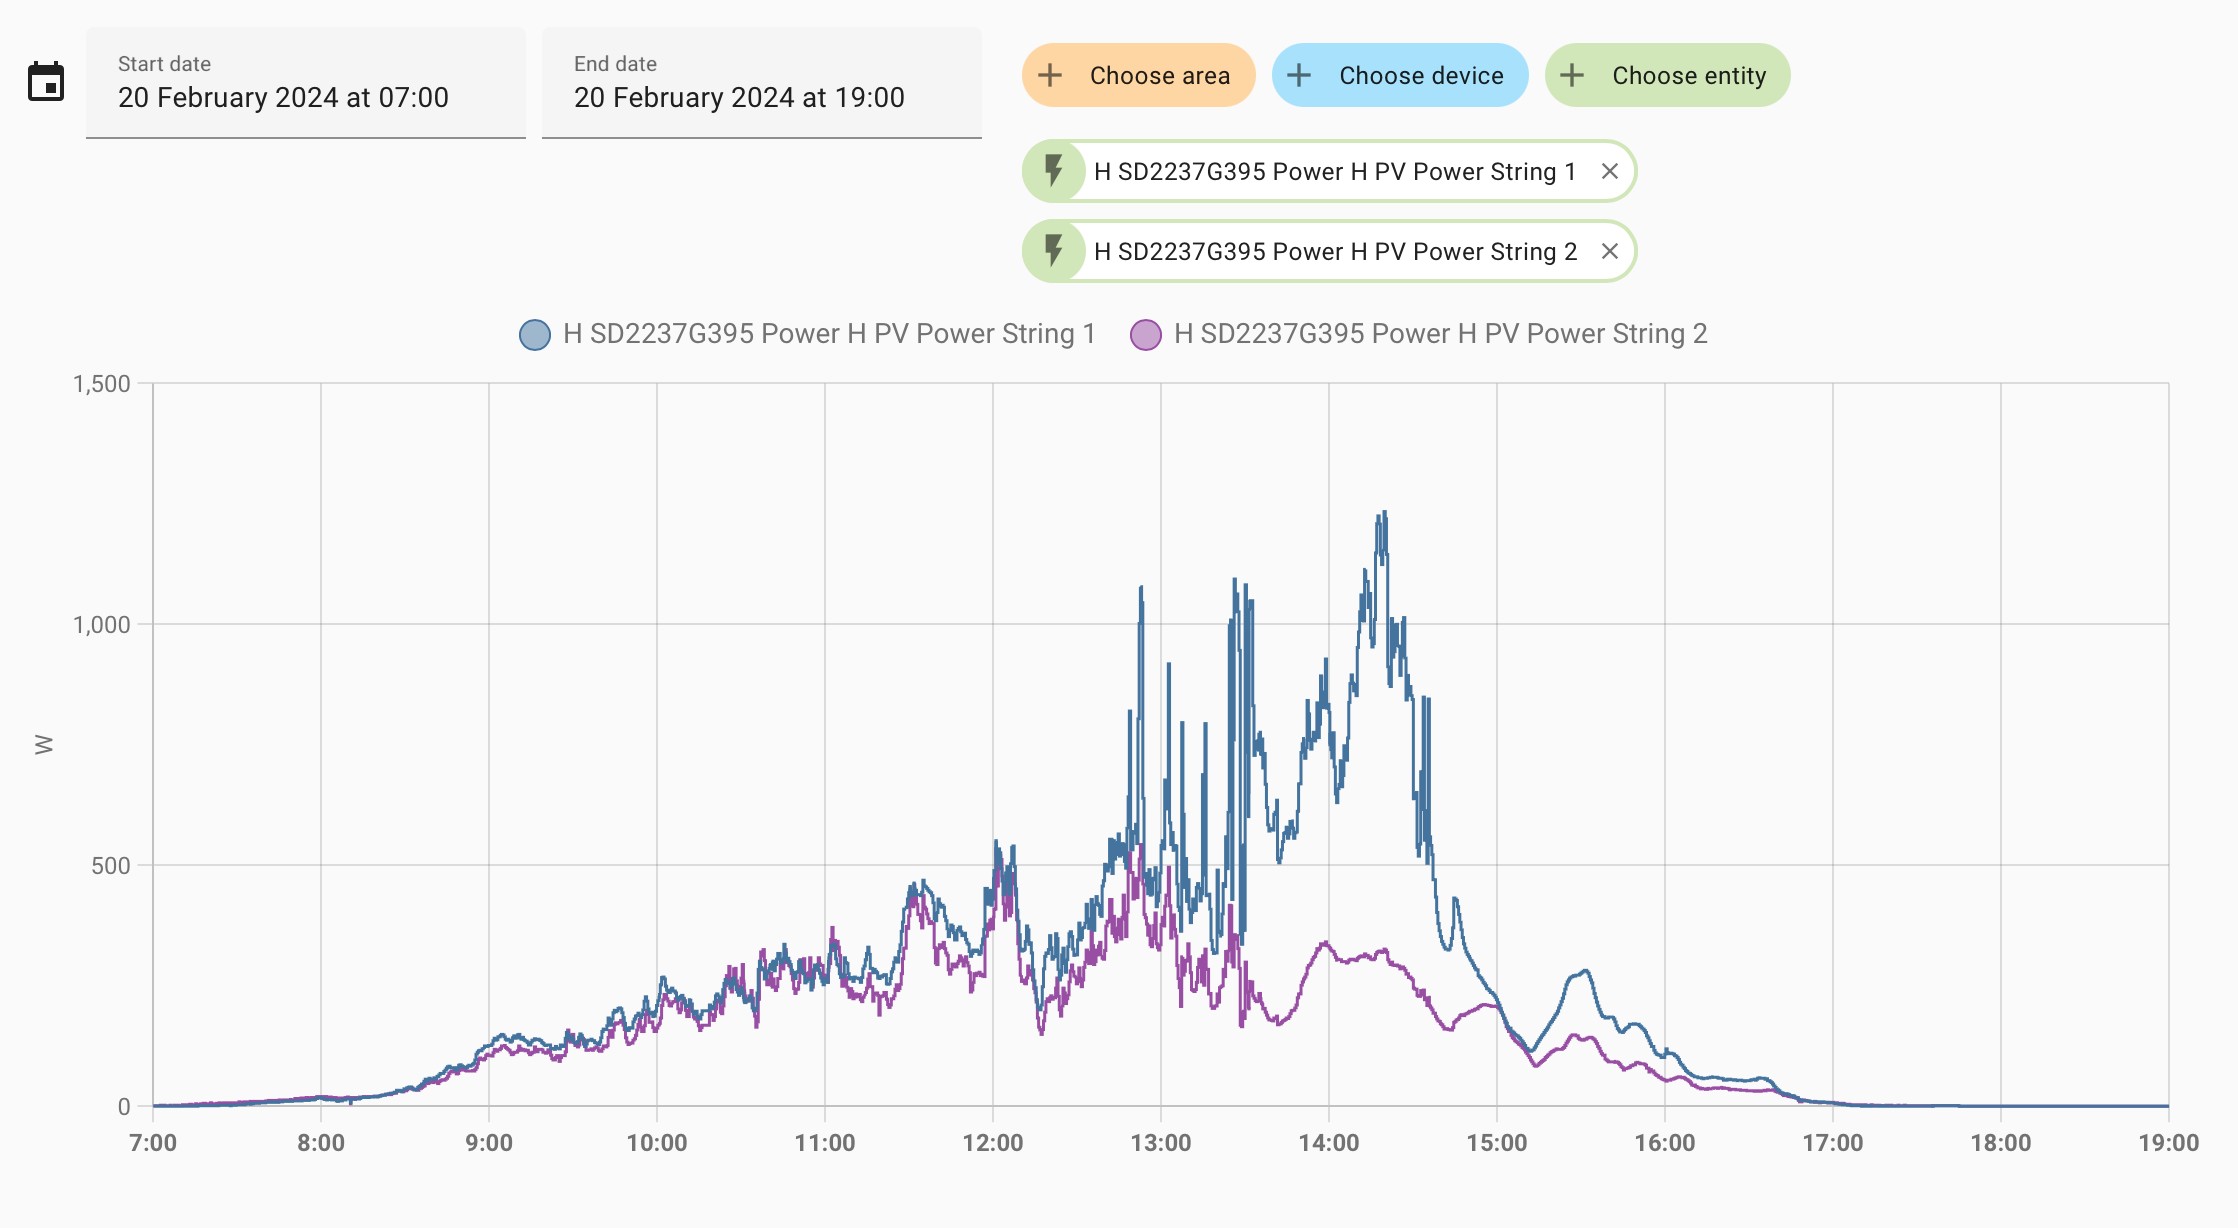
Cheers. I got those but what I was interested in was energy generated per string rather than total.
Chaz These sensors are instantaneous power, etc for the two strings.
If you want to a daily kWh then you’ll need to use a Riemann Sum to create a new sensor that converts the string power to kWh energy.
Finally if you want a daily total you’ll need to use a utility meter to record the kWh over the day and automatically reset it at midnight each day
Here’s a help article
Cheers mate I’ll take a look.
As GC mentioned you need a Riemann sum to take the power to energy, use the left option when creating. Then create utility meters to take the riemann sum entity into something you can use.
Personally I split into 5 meters, because I like numbers and I can, so I have various reset periods with dedicated entities I can add to dashboards. Even if I can see some of the data in the energy dashboard.
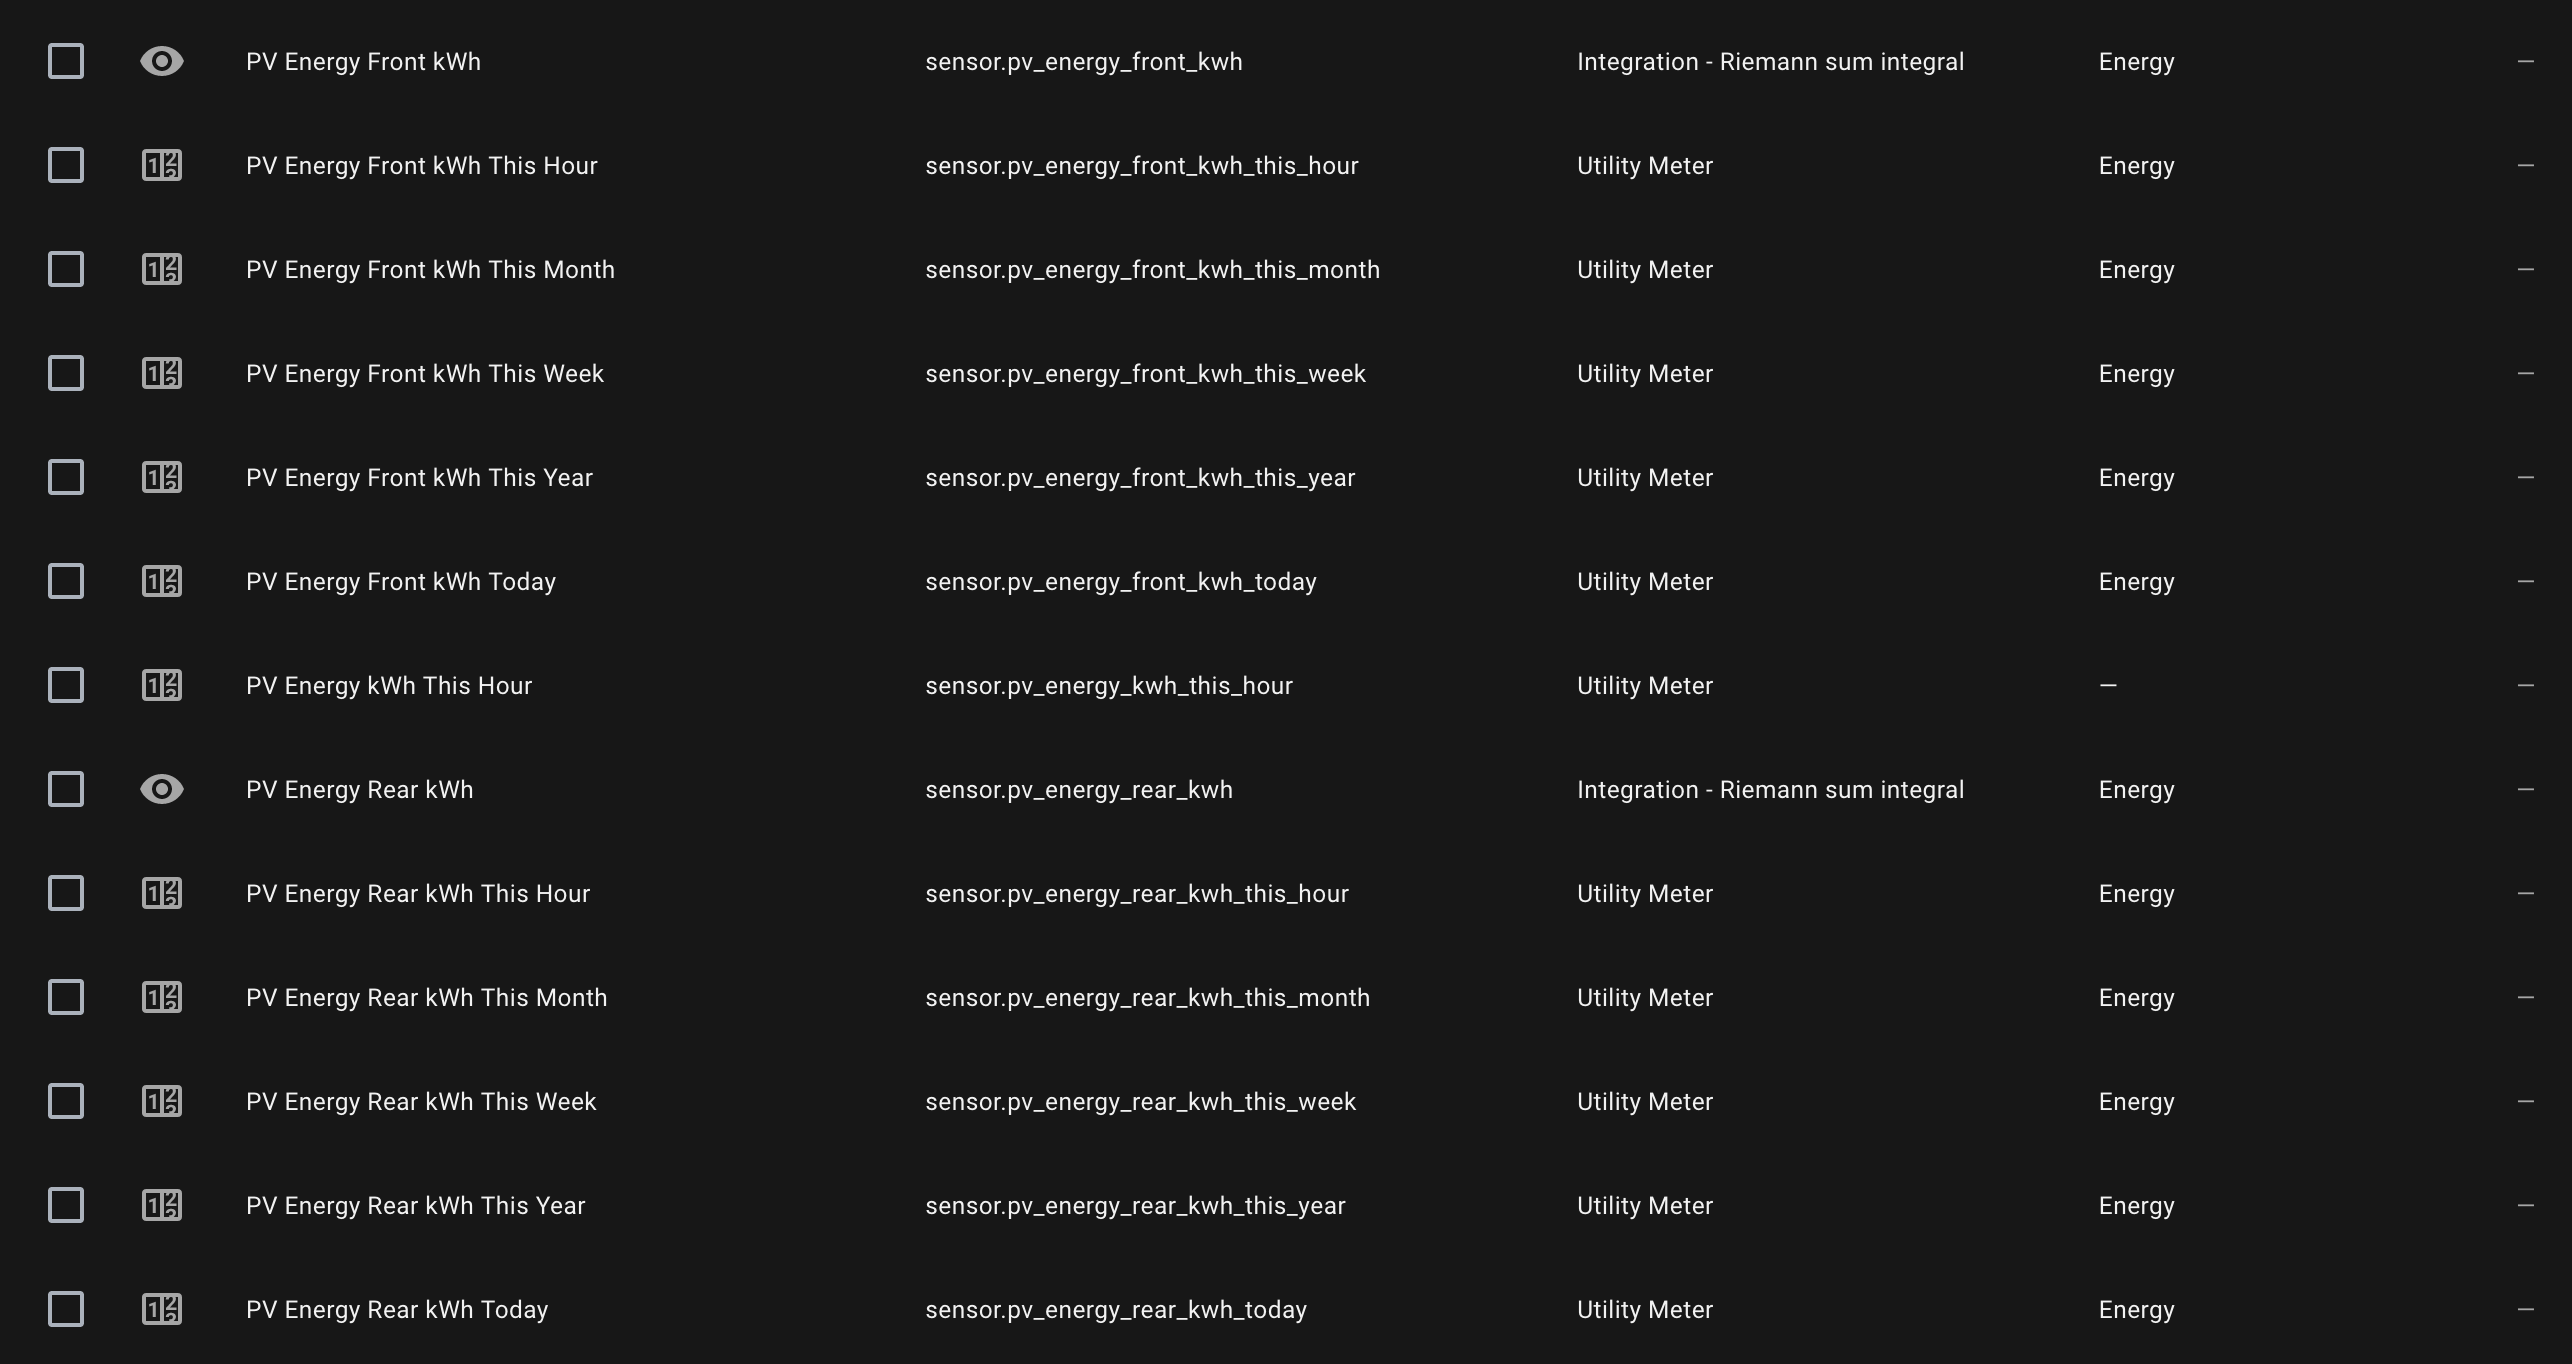
In the energy dashboard use the today entities to show string differentiation.
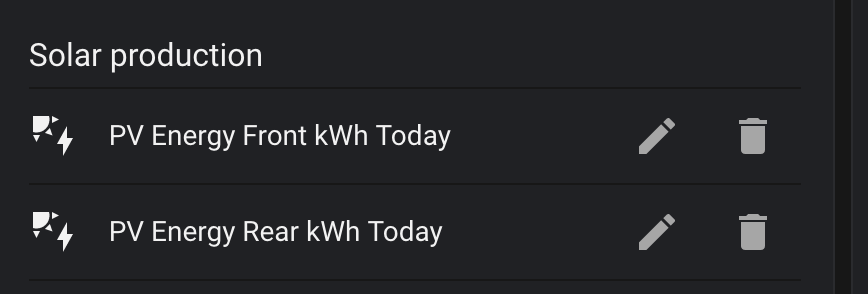
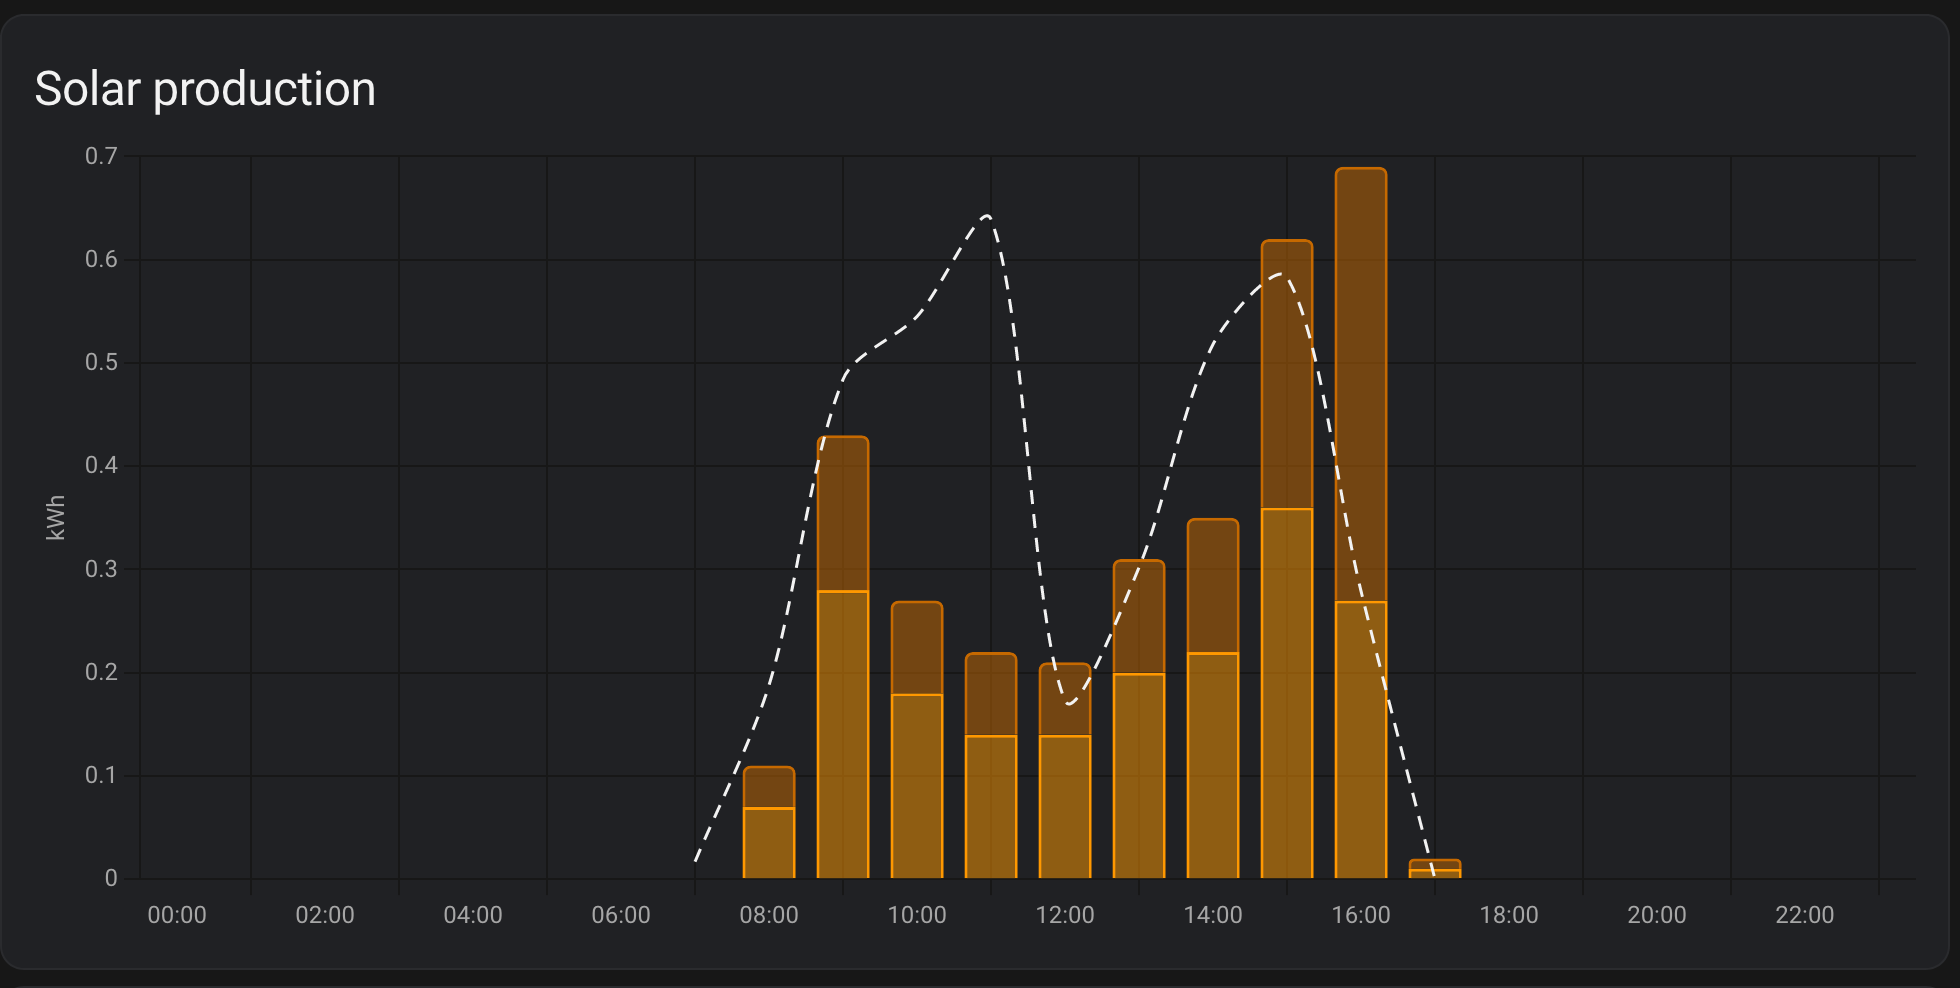
Wow brilliant I like that set up.
Just got to work through it myself. Being new might take a bit of figuring out but I’ll do it!!
Cheers.
So you need 1 Reimann Sum for each String?
Then You create as many Utility Meters from that 1 Sum repeating at the interval you choose?
Chaz yes, if you want to build it up from string level power data as there isn’t a per string energy kWh sensor, you’ll need the reimann sum first. The utility meters give a different time based way of looking at the data.
I personally don’t look at per string data as only one of my arrays is split across different orientations, the other two are entirely on one roof face so it’s not something I’m massively bothered about.
I feed the solar kwh energy sensors into the energy dashboard and do any comparison views of different time periods there.
But if you want different dashboards of per week/month/year the multiple utility meters as Arg0t has done is the way to go.
Several ways of doing things in home assistant
OK team I've done it all up and running thanks.
The reason I wanted to monitor per string generation is to prove to myself that I was right in doing two roofs.
My house has Northeast and Southwest arrays. A couple of companies quoting me told me I was stupid for having panels on my Northeast roof but I pushed ahead and paid a little more and had them on. This is to show me I was right!!! LOL
Thanks again.
Chaz In the grand scheme of things, solar panels are relatively cheap (compared to batteries and inverters). If you’ve got scaffolding up, my view is you should maximise the panels on the roof.
Having panels on different orientations gives a longer solar generation day - my East/West roof generates electricity from about 5am to 9pm in summer
Chaz I don't think you'll be disappointed with NE facing panels. They'll probably do quite well in the summer with the sun on them for a significant part of the day, in the winter they probably won't do so well on sunny days but on cloudy days they should be on a par with your SW facing panels.
I have some North facing panels - in the winter on cloudy days they are at least as good as the South facing ones and occasionally out perform them. Of course on a sunny winters day they don't do as well because they are shaded - about 10% of the production of the South facing panels. In the summer they are in sunlight most of the day - the poor angle obviously means they don't produce as much as the South facing panels, but they generate significant amounts of power for 4 hours longer.
In total last year the Tigo data shows that the North facing panels provided half the power that the South facing panels provided, which is about what I expected.
However, I don't really know how well the North facing panels perform in the summer as there is some clipping on my system, it definitely affects the South facing string as it hits the 2800W string limit (gen1 3.6 kW inverter) and probably affects the other string which has the North facing panels and a few West and East facing panels.
I'm not sure that I would recommend North facing panels as being cost effective but every extra kWh 'saves' me money. Without them I'd probably be just covering the electricity bill with my exports or worse paying for electricity instead of looking to get £230 back.
Chaz same reasoning, I have a little more space on the front and a lot more on the rear. The numbers help understand the different profiles through the year and if a future extension of PV would make a better payback on front or rear. Panels are cheap but you get fleeced on scaffolding and fitting so you want a decent return.
The data is there, no harm in having HA capture it even if it's redundant in many ways. Bonus it teaches you how to create a riemann sum and utility meter.
Enjoy.
Hi,
I have been following this thread as I am also trying to achieve the same (string level performance).
When setting up the Left Riemann Sum does anyone know what time unit to use?
If someone can provide any information it would be greatly appreciated.
Thank you
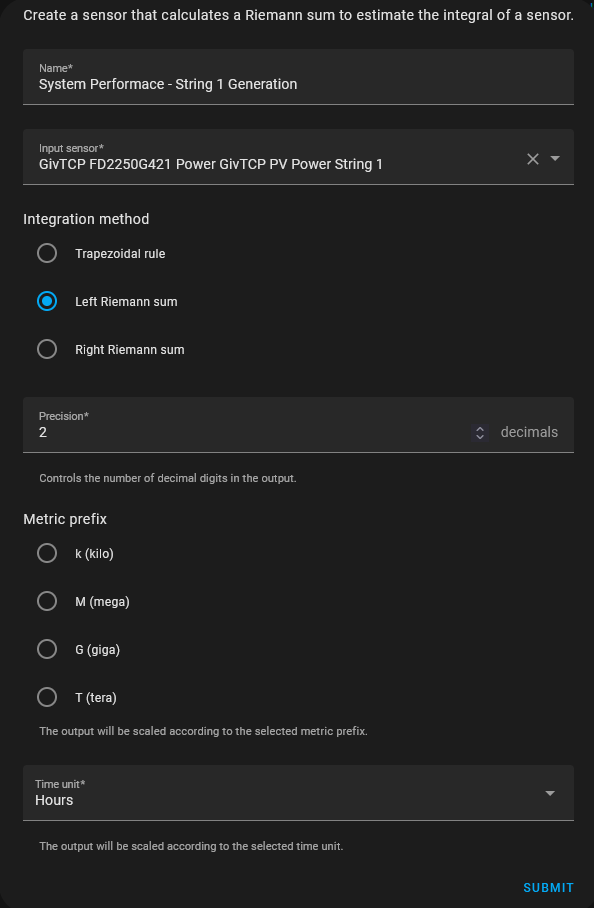
Kilo and hours.
Then put the 2 entities into the Energy dash and the graph will show front and rear.
Chaz Put them in to the energy dashboard after setting up a utility meter helper?
Qyaunos1 correct yes. Create utility meters with daily reset and unit of measurement = kWh.
Give it a few hours to populate the utility meters and the history statistics, then you can add them to the energy dashboard