S
#1 SteveCook
Why does small screen show Todays Genertion 2.4kWhr and big screen Generation Today 4.7kWhr
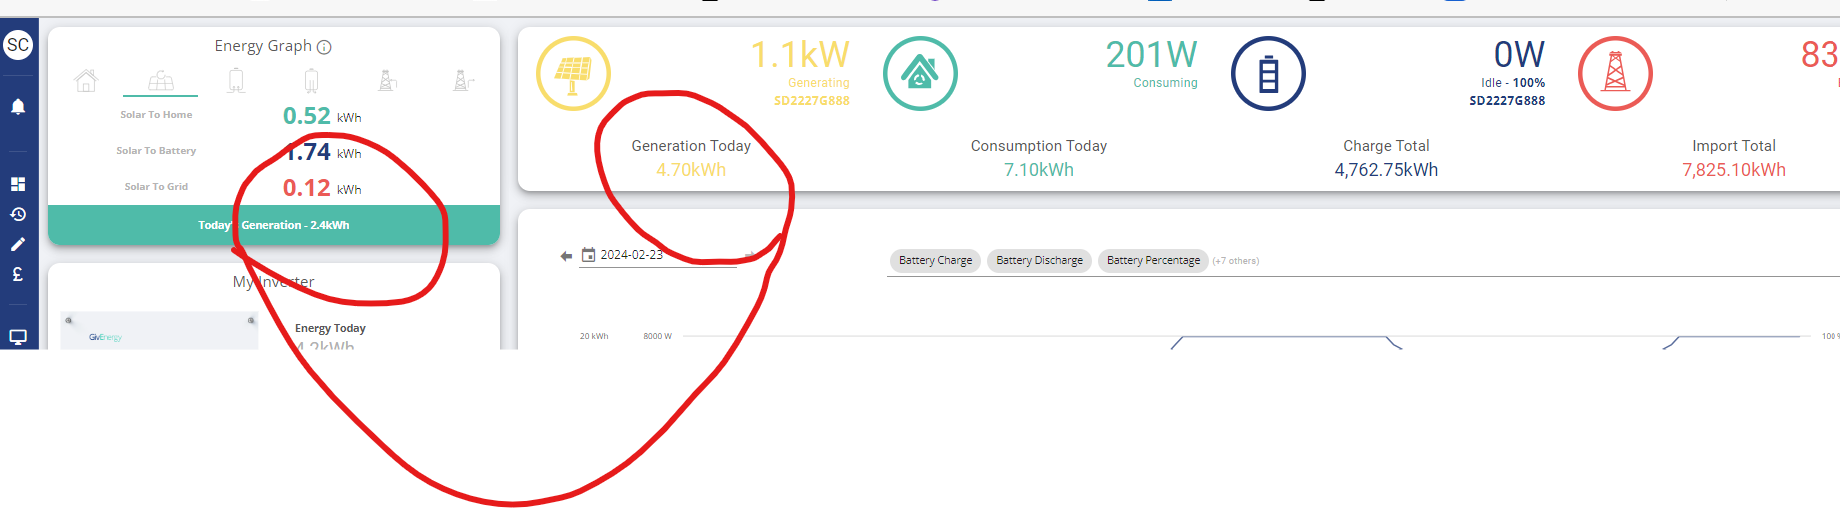

Why does small screen show Todays Genertion 2.4kWhr and big screen Generation Today 4.7kWhr
I have checked phone app and it shows 2.4kWhr- ie agrees with small screen
The big one cycles between 'generation today' and 'generation total'. That makes me think it's coming from the meter data. The small figure, on the other hand, comes from the energy data, which is, I think, integrating the snapshots of the power figure over time. (For me, they're quite close - 10.2 vs 9.95)
If you expand the energy graph, then hover over the circled-i in the top right, you get a popup disclaimer. I can't capture it, but it says it may not represent actual energy usage.
if you go to the inverter page, and go to the last tab, the meter data, the top line (latest result) will probably match what's showing in the bigger screen.
See also the disclaimer in the API about energy data:
https://givenergy.cloud/docs/api/v1#energy-flow-data-POSTinverter--inverter_serial_number--energy-flows
It should also be noted that, because these are calculated values, they are simply an indication of energy values from different sources
SteveCook Because the sun is shining!
If you check this evening after dark, you should find the figures are closer.
Thanks I get the timing issue, but one number approx 50% of the other number does not feel right
Oddly, going back to the page now, the energy graph still says 9.95kWh, whereas top figure is up to 11.2kWh. But the energy bar graph only has data up to noon, so it seems to be missing the last couple of hours.
There's been another thread recently talking about how the energy graph seems to get behind. Could that be what you're seeing too ?