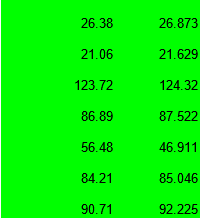
My grid export that is shown on my Octopus bill is at least 10% less than what’s shown on my GivEnergy system. This applies to any month over the last year. Has anyone else checked their figures and what results do you see? Any idea of how this is possible and if Octopus is ripping me off. When I look at the figures on energy I have taken from the Grid over the last year the difference between the 2 sources is less than 1%. Is there any possible explanation

Energy bill export 10% less than GivEnergy figures!
APROPHET which GE figures do you use? I think the metered data tends to be more accurate than whatever it is they use to generate reports.
DD I used the numbers on the monthly graphs on the old dashboard. Is that accurate / where else can I see the figures which are accurate?
APROPHET The totals shown on the dashboard are probably the metered data. That is also available if you go inverter data and choose the 'meter data' set.
But the generated reports seem to use something different. Eg for me, meter shows all-time solar generation of 3535, whereas the report says the total solar is 3499. Or for grid import, 2192 vs 2027 on the report.
I think the problem is that the meter data counts it regardless of where it went, but because the report is trying to break it down into where it all went, it seems to come up with a different figure.
There was a recent Q&A video on youtube, and I think he said they were going to be trialling a new way of doing the reporting.

The portal (used to) take the 5 min updates and extrapolate from there converting to kWh.
If you have a quite peaky day (clouds between sunny spells, spikes loads) then it can drift a fair bit from the meter data as its basically making the assumption that everything for that 5 min period was static for the duration.
Not sure if it still does this.

I record what is given by the weekly reports.
for me they are very close but Octopus is always a little more export reported than GE

GE on left Octo on right