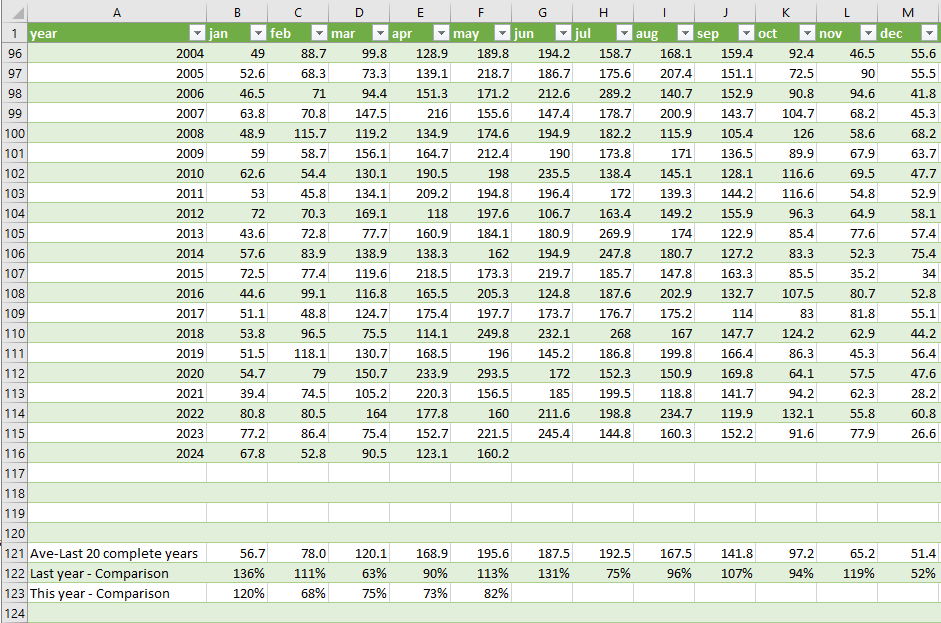
Most youtubers that have solar use pvgis, you put in your lat, long, panel size, orientation, etc and it gives you the generation figures. Of course you then have to work out how much of that will be self consumed which depends on loads of different factors so there’s no simple model.
These are my own figures for example, its complicated by the fact that we have an older FIT array and then the new GivEnergy arrays in January 2023, then only started getting paid for export in late August 2023.
High winter consumption due to a heat pump.
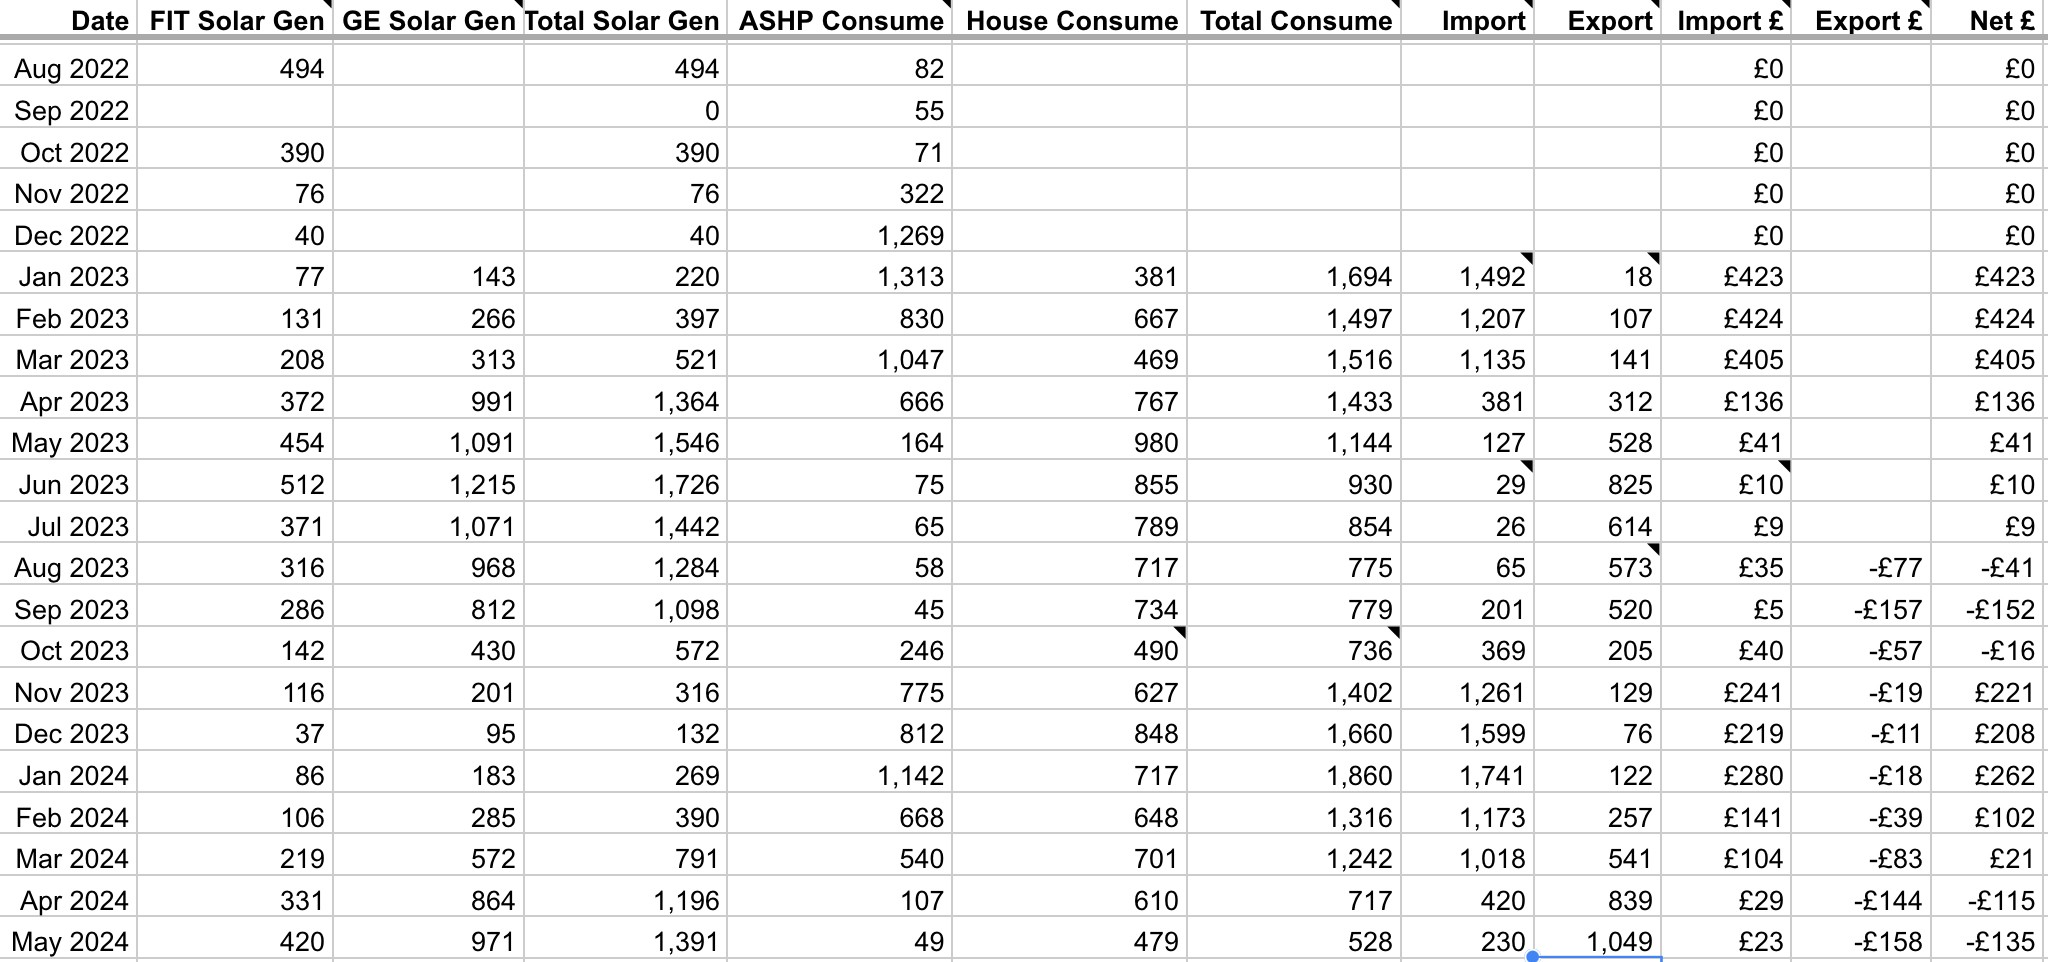
Last year we started exporting more than we imported in May (inverters on Eco mode), but this year the changeover was in April as we’re now on Agile and use Predbat to automate the charging in cheap periods.
So no simple answer I’m afraid.
The quote you had for solar generation should have had MCS approved standard estimations of payback?