J
#1 JHP
I'm still getting used to the new portal, but have a query.
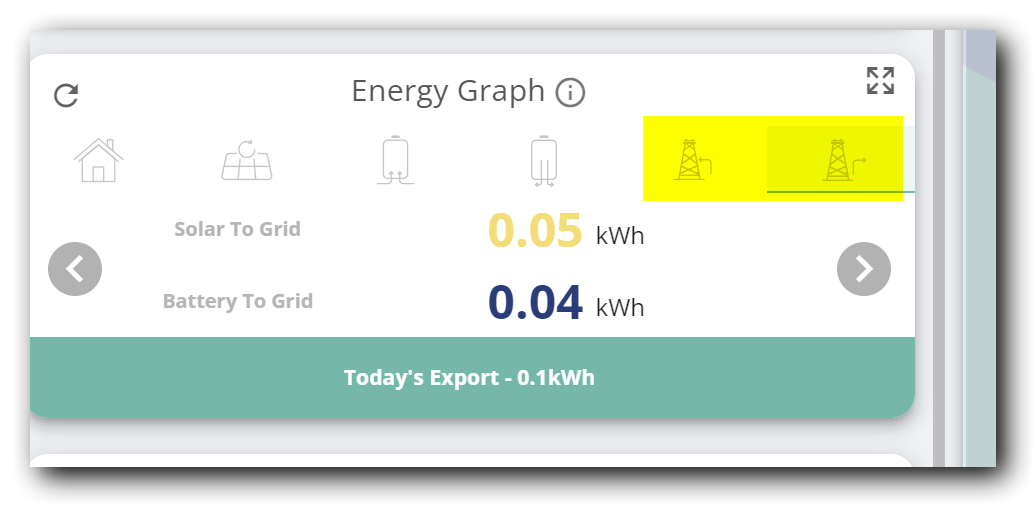
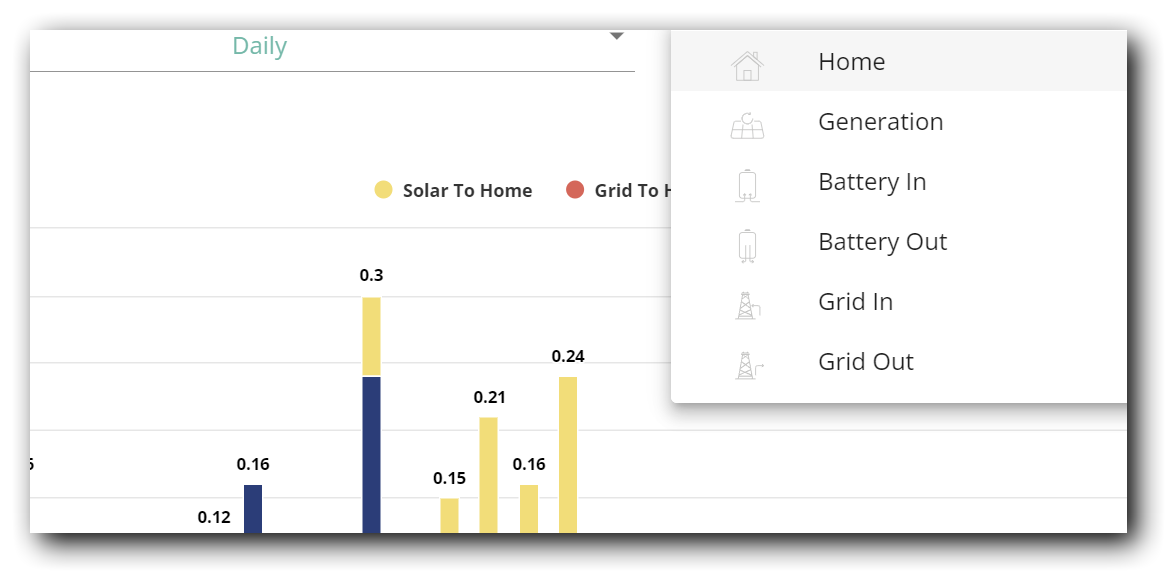
Why does the energy graph in the portal only show generation, grid to home and battery to home. The old portal also showed export to grid. The current graph is pointless as for today it shows only the summary of the 3 sub headings, and does not include the total generation. This seems to make this chart totally useless, as it is not recording the true picture, as a large slice just 'disappears'.
So with this new chart I have no clear idea of total generation over the year, as a large chunk of data is simply ignored.
This current portal doesn't seem fit for purpose!!
John