
Just spotted the neat update to the solcast card. Rather than just showing the graph it now provides figures for actual verses estimated. Only snag the graphs and the figures do not appear to match. For instance one day the estimated was 11.44 and actual 21.60. Would expect to see a big difference in the graphs but the actual and estimated were very close to each other. Interested if others are seeing this?
Solcast Estimated V Actual discrepency
locked If the data comes from the Solcast site, it is the estimated actual, based on actual weather, rather than your actual generation.
Still not adding up for me. The actual generation figure and graph match the data from giv. The estimated figure and graph which both come from solcast have big discrepancies. Today is another example the estimated figure is 0 but the estimated graph tracks closely to the actual graph of 16kwh
Will check tomorrow when back on laptop but from small screen it looks like the estimated figure matches a graph from a different day. for instance the 0 estimate of today matches the estimated graph of -3 days.
I have also seen this and it is quite frustrating for me as it as if they are matching the forecast to the actual rather than showing that the forecast was not as accurate as it was shown the day previously.
I think this is coming from the Solcast site - if you look there you'll see the estimated figure after the fact is quite different to what it was beforehand. I agree though that it would be more interesting to compare the prediction with the actual (I download the figures from Solcast every night for that very reason, so I can look back at the prediction)
assumed the data was from solcast but the part that still does not make sense is why the blue estimated graph and the estimated figure are so far apart. For example one day It shows estimated figure of 11.44, actual of 16.00 yet the blue estimated area of the graph has a larger area than the yellow actual area, which is the opposite way wrong to the figures.
for info, provided feedback to giv who are now investigating.
My historic versus actual is wildly off when you look at the graph trace.
Had a day where it's spent most of the time exceeding the blue coloured value but I've generated 19kwh (yellow value) with the blue one showing 29kwh forecast.
It's no-where near that sort of split between the 2!
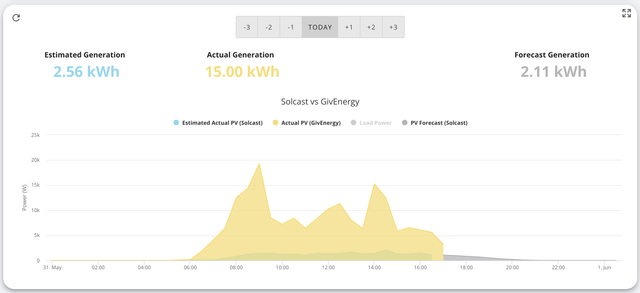
After today's update the Actual Generation on the Solcast page is broken - it shows 5x bigger generation than the actual is...
Numbers are correct, just the "yellow" area/ values are higher than the real numbers...
The problem is only on the Solcast page. The Power Graph is correct...
Anybody else noticed this?
kerik same for me :-(
And me...
and me
kerik Yep i see exactly this. at least 5x out. Something seems to have happened in the last update. I just wanted to check here to see if other see the same, guess they do :-)
Point time example:
Solcast Estimate = 650W
Actual PV (GivEnergy) = 8,417W (I wish, from my 6.3kW system)
The actual recorded output at that time above was 923W
steve Same. Crazy wrong representation under Today, -1, -2, and -3.

for info, raised a bug report yesterday. @Sam D (GivEnergy) was helpful when looking at earlier snags with the card
Yep, it's gone nuts.
About a week ago it was almost spot on. I have just checked my stats and they are the same as the others reported.
Mine is also showing silly amounts of generation - 20kW + on a 4.8kWp system
Experiencing the same - was very accurate upto about a week or so ago. The the "Actual PV" figures seem to be about factor x5 out. e.g. Widget graph can be predicting i've been generating 25kW, but my system has max 5kW generation. Predicted solcast figures still seem ok.
Looks like a graph scaling issue, hopefully a quick fix.
Just looked at mine, seems to make sense. Bug fixed?
I take it back, wrong today!