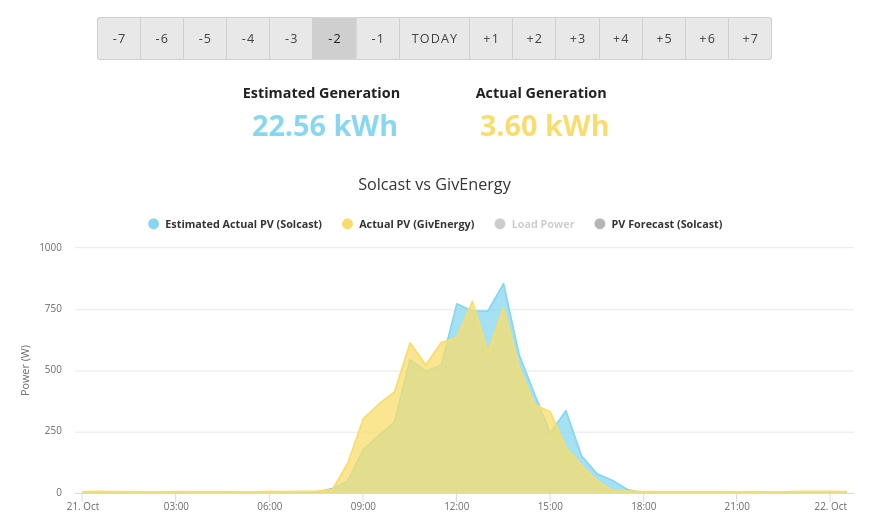
Can anyone explain what the Solcast card is displaying for estimated generation? This is my card from 2 days ago. The actual generation at 3.6KWh is correct as per the GE data and the two graphs roughly align. So how is the estimated generation 8 times that amount? What is it referring to?
T
#2TX200
It's actually showing "estimated actual generation", but is shortened in the header at the top.
I assume it is what solcast thought you would have generated based on the actual live solar forecast.
Obviously things are never perfect, for example shading could be an issue (buildings, trees, etc) which solcast can't account for.
Plus if the details in solcast aren't quite right, then the estimates will be out - for example is the location 100% correct? Is the angle of the house 100% correct? Is the pitch of the roof 100% correct.
Then maybe heat can be a factor, panels may have degraded performance in hot weather. But different makes of panels, ages of panels and roof mounting systems (e.g. on top of roof or in roof?) could all mean a slightly different impact on generation for the same weather.
#3Windy Miller
TX200 There is a factor of 8 times different so all those things would have to be seriously wrong for the Solcast estimate to be so far out.
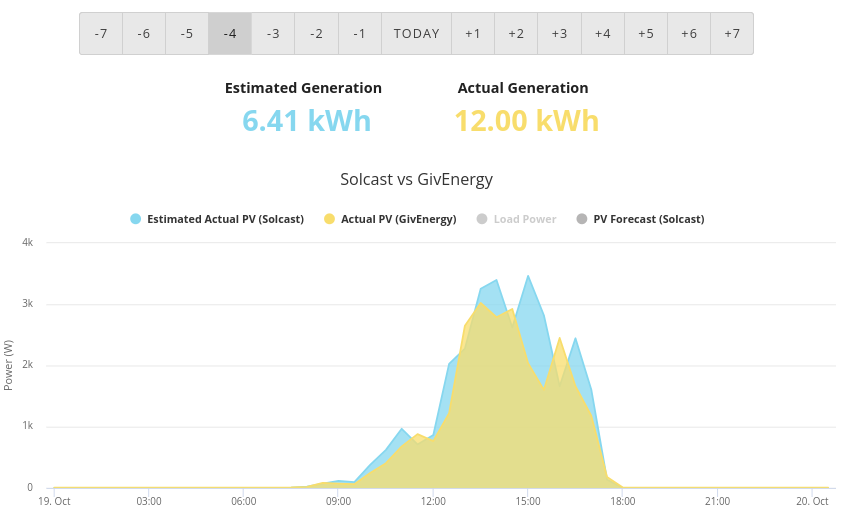
Another day and Solcast estimates less than actually happened and yet the two graphs still track
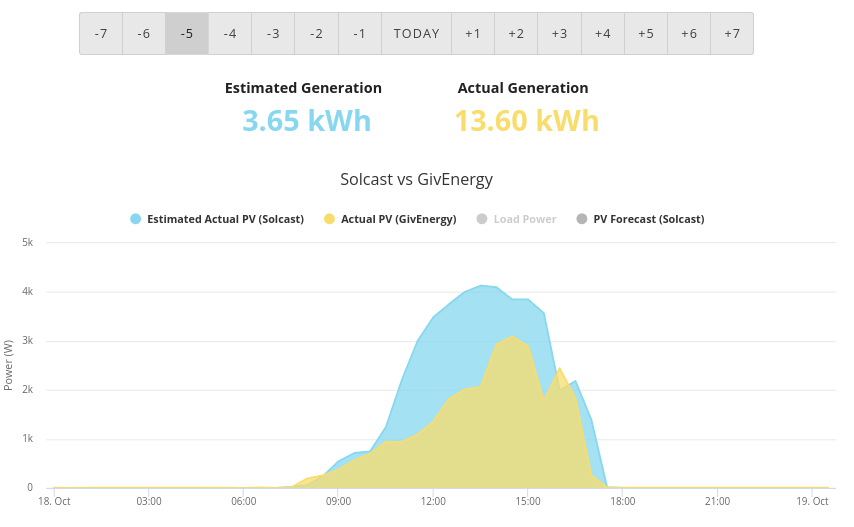
and this one where the graphs are different (perhaps because of shading) yet the Solcast estimate is much lower than actually happened.
T
#4TX200
Maybe email solcast and ask them.
#5Windy Miller
TX200 Yes I might do although this is Solcast data on the GE site so I can believe that it is being mis-processed by GE. It is just the printed value for estimated generation that appears wrong. Generally the graphs do tie up and I do have morning shading which would account for the lower graphs on very sunny days.
Thanks for your comments.
G
#6geoffreycoan
I suspect Solcast is absolutely fine and the problem is in the GivEnergy portal's display of the solcast data.
I use Solcast all the time in Predbat and my predictions match (reasonably well) to my actual generation. I bet this is a portal display problem, as you say the graph tracks fairly well, its just the summary figure is wrong.
T
#7TX200
Yeah comparing the graphs and the header data, it does seem to be a bit wrong.
I think solcast data doesn't actually show yesterday on the -1 tab, I think it shows in 24 HR chunks, so depending on when you view it depends on what data you see for the -1 etc tab.
Most likely is giv are showing the wrong data on that header label. A bit like the columns being in the wrong order Vs the column headers elsewhere on the portal.
#8Windy Miller
I have noticed that, although they're close, the Actual Generation figures for the 7 previous days are not the same as the ones listed on the Portal. It's also a shame that I can't display the estimated generation data on the Solcast site for comparison purposes - I have to download and interpret it.
Without any help information for this GE card I don't think you can really use it for anything useful except as an indicator.
#9miffy
I found using Solcast on the GivEnergy site so annoyingly bad I turned it off. It's been broken for about a year, and I don't understand why it hasn't been fixed.
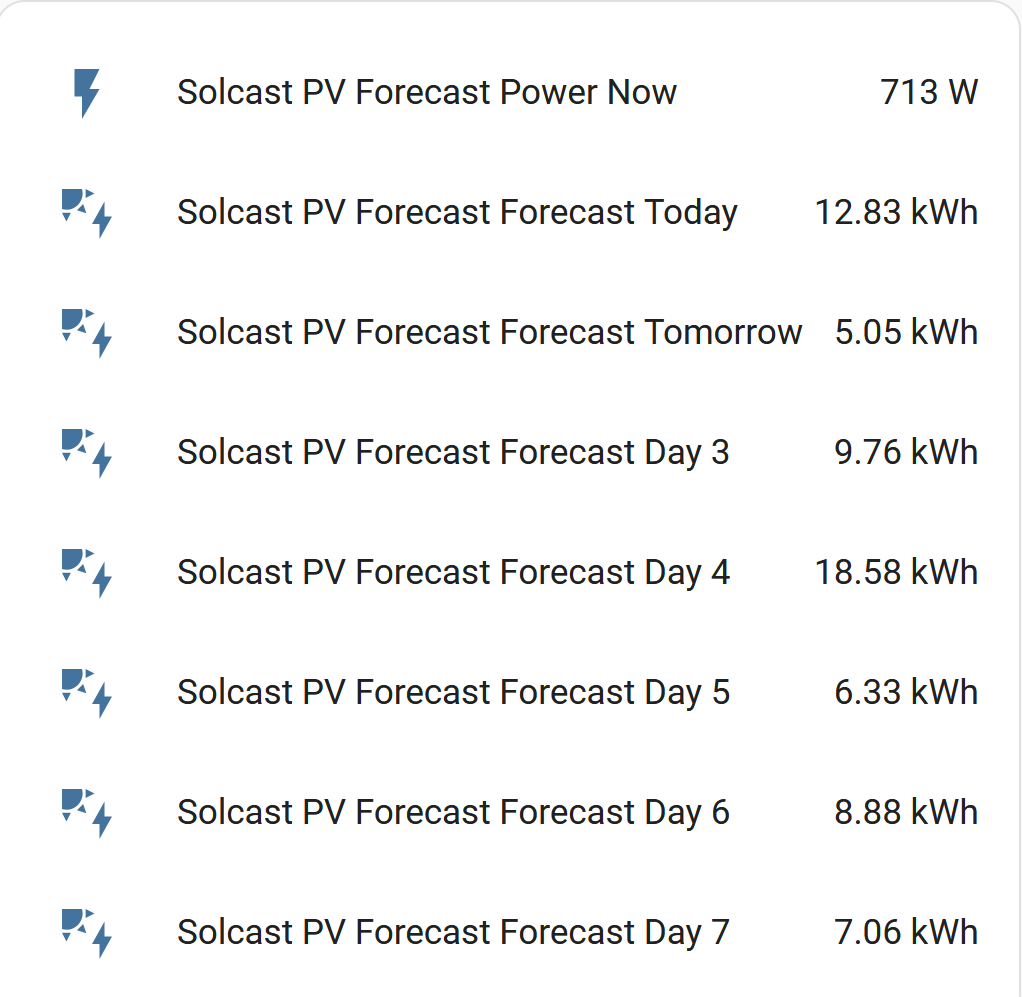
Recently, I got Home Assistant running, and there's a Solcast integration available for that, which allows me to display this:
G
#10geoffreycoan
miffy I gave up with solcast on the givenergy dashboard as well, not least of which is every time you refresh the dashboard page it polls Solcast. I have two sites (East and West facing), only 10 API calls a day, so 5 views of the dashboard and that’s it.
The Solcast integration in Home Assistant is great, lots of features and being enhanced all the time
#11miffy
geoffreycoan Ditto, I also have two arrays, SE and NW, and the Solcast polling was an additional reason I turned it off on the GE site. Until it was turned off, I used the legacy GE dashboard to avoid the unwanted polling.