Data with IOgo + Outgoing 12M Fixed

21 comments started 2024-11-01 last 2024-11-21
APIsHome Automation
#1 Searlee

My wife uses the cloud dashboard to check our data, incoming, outgoing, net spend, amount paid off from the initial spend etc and puts it into a spreadsheet,.

We've recently got an electric car and moved over to Intelligent Octopus Go in order to make use of the 7p import and 15p export so naturally I've automated it all so it dumps the battery in the evening and imports it again over night.

She's an accountant so knows her way around a spreadsheet but she's stumped on a way to get the correct data from the reports to work it out now that some of our energy is at 7p and some is at 25.03p. Has anyone done this? and if so where did you get the data from?

I'm a software developer so I can use the API if that's necessary, it's just there's a lot of data and knowing which bit of data to pull down would be very helpful.

Thanks 😊

G
#2 geoffreycoan

Searlee easiest thing is probably to get your import and export data from Octopus, they provide a download capability of the data in 30 minute blocks and you can then price it accordingly

There isn’t really any API’s to pull the data from the GivEnergy portal, just a CSV download but its one day at a time so you have to script up to repeatedly download the data for each day whereas Octopus you can download from a start date.

Or use something like Home Assistant and the energy dashboard to price up your import and export

#3 Searlee

geoffreycoan I am using home assistant so was looking at that. I'll have to dig some more. Thanks. 😊

G
#4 geoffreycoan

Searlee I am using home assistant so was looking at that. I'll have to dig some more. Thanks

If you are using Home Assistant presumably with GivTCP and the Octopus Integration then the Energy dashboard is the way to go.

Basically two ways to get your import and export data correctly priced in the Energy dashboard:

  1. Use the Octopus ‘current price now’ entity
  2. Create a utility meter for your import and have separate ‘offpeak’ and ‘peak’ tariffs on that UM, then swap between the two at the appropriate times of day (there’s a Speak to the Geek video on this)

You’ll need to have a way of getting current import and export kWh into the Energy dashboard. The different options and steps to get the Energy dashboard setup are covered in the Octopus Integration documentation, you can use an Octopus mini or a Hildebrand Glow device to read your actual meter data, or use the GivTCP import and export entities which is what I do as they are close enough.

I am on Octopus Agile so I use option 1 to price current consumption in the energy dashboard, but to handle the Octopus Power up and free electricity events I also have a utility meter with ‘day’ and ‘free’ tariffs that I swap between. Any import at the free tariff is at 0p, the day tariff is the ‘current price’ tariff.

X
#5 x5toledo

Home Assistant can track the rate at a given moment in time ('sensor.octopus_rate_in_pence') and this rate varies with the charging of the car - so it can move from peak to off-peak within a half hour time block. Which is why using it for exact number crunching this needs some smarts to determine if an off-peak rate occurred within a half hour time block (and if it did Octopus will reflect the whole block at the lower rate in the bill).

It's possible to track the sensor data over extended time periods by writing either the raw sensor data or some templated derivative of it to InfluxDB.

Rather than taking this approach my preference has been to scrape the pdf bills to get exact data - after all, these contain exactly what is billed. At present this is good enough for my recording of daily usage, it's just a little laborious to format the resulting text. If my requirement is to get a bit more granular then a curl request from command line to the Octopus API produces structured half hourly data for a specified time range and this is best for spreadsheet analysis.

In an ideal world an API call to Octopus that returns the price for each half hour time block would best suit me. Not having looked recently at the API docs if anyone knows please chip in :-)

D
#6 DD

x5toledo this is something I have on my (rather long) Todo list. I'm sure the historical price per half hour must be somewhere in the graphql list of queries.
In the meantime, would having a log of completed dispatches be a sufficient proxy? I've already got code that does that. They are kept for 12 hours, so polling every 6 hours, say, should be sufficient.
I'm not quite sure what happens if a dispatch was planned, but then due to Comms failure the car didn't actually charge - is the dispatch still marked as completed, or does it vanish?

I've noticed that IOG fairly regularly changes its plan as the night progresses - more than it used to. I had just been taking a snapshot of the state once, but I think I'm to have to switch to a model of updating every half hour while the car is plugged in.

X
#7 x5toledo

DD
1) Historical price per half hour would be great. If time permits this will be on my revisit list for the weekend.
2) Completed dispatches might be good - maybe cross-matching to reality could check? My records usually keep actual charge added in a session in order to figure out what actually went into the car but this gives no granularity to when the charging happened. Maybe track a flag for charger internal CT exceeding a threshold gets useful visibility of charge cycle durations? Just looking for something to make the cross match :-)
3) My recent observations are that charge cycles are much more variable in recent times, and also the Octopus app gets all shy about updating an initial planned schedule - the app just says it's planned or words to that effect.

D
#8 DD

x5toledo Historical price per half hour would be great. If time permits this will be on my revisit list for the weekend.

There is a graphql query for "applicableRates" which I thought might be it. But a thread on the octopus forum suggests it's just the tariffs standard periods, and doesn't let you ask what price you were paying for energy at a particular time.

They suggest archiving the completed dispatches and working it out for yourself, or just reading your bill.

P
#9 Pete UK

Searlee

Outside of the HA route;

Take a look at the free iOS app “Octo-Aid”. I think you should be able to get all the data you want from there.

On its home page you’ll get an overview of the number of on peak and off peak kWh for the current and previous month plus a % of how much was off peak and on peak and when and loads of other info. It will pick up your correct billing tariff from the Octopus API.

On its “usage” tab you can see more detail about what you’ve imported, exported, combined electricity net import/export, gas, total combined electricity and gas usage and costs of each and all of the above and you can also select different preset (and custom) time frames for all of the above.
Also it’ll add in any extra bonus charging/house slots from IOG (or you can add later manually if required using your Octopus bill). You can drill down into each daily half hour slot as well.

You can also export data to CSV to incorporate into your spreadsheet.

It’s a really great app.

P
#10 Pete UK

Just to add,

So I use Octo-Aid to keep track of the (daily, monthly, yearly etc) total net bills and IOG on/off peak energy use and cost(s)/ ratios. (Along with my Octopus bills)

(Not sure if you have solar or not but assume you do if you’re on this forum)

I also take the “generation today” figure from the GE portal at the end of each day and add that into my own spreadsheet to keep a track of my daily/monthly/ annual solar generation. So I can then know the amount of savings that came from solar. Or at least the number of units generated. Which is easy at the moment, as it’s all mostly exported. But tricky to know exactly what’s used by the house before it went out to export though. But it builds up a great picture of annual solar generation.

D
#11 DD

Pete UK On its home page you’ll get an overview of the number of on peak and off peak kWh for the current and previous month plus a % of how much was off peak and on peak and when and loads of other info. It will pick up your correct billing tariff from the Octopus API.

So it's able to correctly price any bonus charging periods you've been given? Even though that information doesn't appear to be available from Octopus's API ?

Actually, it must be available somehow... On the Octopus app, on the usage page per day it can estimate price, and it looks like it is pricing bonus sessions at the correct rate. I'll have another look.

X
#12 x5toledo

Octo-Aid is fine for some things - for instance the kWh by period is almost correct. 'Almost' because the API returns three decimal places so it's not exact.

For cost though it looks to me that the app is crunching default prices for the 48 daily timeslots - which means it doesn't know which timeslots were reduced rate for OIG. Hence the cost numbers are massively overstated compared to reality. Pick a day when you know you had additional cheap rate blocks and 'Show Chart' then compared to a real Octopus bill graph. The difference is plain.

Octo-Aid is a good app and looks to be made by an enthusiastic developer who cares. But it is limited to the same API which appears not to have half-hourly rate data.

It will be possible to extract the rate data from the Home Assistant sensor. When looking at the InfluxDB data using Grafana the rate transitions visually appear to be correct; this weekend might offer time for me to run an export and find out if it is genuinely correct when compared to a bill.

X
#13 x5toledo

So it was worth checking if the API rate data makes any sense, and by that my Home Assistant has the excellent Octopus Energy integration from BottleCapDave. Data is piped routinely to InfluxDB which can be queried using the influx CLI:

influx query 'from(bucket:"YOURBUCKET") |> range(start:-100d) |> filter(fn: (r) => r._measurement == "GBP/kWh" ) |> filter(fn: (r) => r["_field"] == "value")' > historic-rates.csv

(Your measurement field value may be different, so use another predicate filter to just extract the needed values.)

Checking this data against the actually billed data it seems that the rate presented in the Home Assistant API aligns to the subsequently billed rate in the relevant Octopus pdf bill. So it can be relied upon. Probably.

It would be possible to take the InfluxDB data and process it to find when the rate changes, then align that to the API output usage data in order to create a bill before Octopus send one. However, my laziness took over and thought it better just to have Home Assistant write a CSV file the columns of which may be offered to the API usage by time. So a recorder automation can write the two columns for subsequent spreadsheet monkeying:

alias: Octopus Import Rate Tracker
description: >-
  Ideally this writes the sensor value to file every 30 minutes at the end of
  the half hour time block
triggers:
  - trigger: time_pattern
    minutes: "29"
    seconds: "59"
  - trigger: time_pattern
    minutes: "59"
    seconds: "59"
conditions: []
actions:
  - action: notify.send_message
    metadata: {}
    data:
      message: >-
        {{states.sensor.octopus_energy_electricity_METER_MPAN_current_rate.state}}
    target:
      entity_id: notify.file_WHATEVER-YOUR-FILE-ENTITY-IS
mode: single

You need the File integration to make this work, with " allowlist_external_dirs:" set up correctly in configuration.yaml. Set the File entity up to have a timestamp in the File integration entries list (Click on the 'Configure' button and ensure that the Option to include a Timestamp is selected.)

Over the last few hours this has worked fine, so probably will do the job.

To get the data from the API for a given time period my preferred ('lazy') approach is to open a terminal where the data is needed and make a request:

curl -H "Authorization: Basic ENCODED-API-TOKEN" "https://api.octopus.energy/v1/electricity-meter-points/<MPAN>/meters/<METER>/consumption/?period_from=2024-10-01T00:00:00&period_to=2024-10-31T23:30:00&order_by=period&page_size=1500" > octopus_import_Oct24.txt

Use your own encoded API string, MPAN and METER, filename in the above and it's easy to turn the output into a usable CSV (using sed / awk / find and replace / etc). Then align the columns in your two data sources (API call plus Home Assistant rate recorder) and make your own [hopefully accurate] bills :-)


#14 Searlee

Thank you all for all of your help.

I'm sort of there with a mixture of HA, givTCP and Octopus HA integration (Sorry this post is delayed I've got a 5 month old baby and times between doing anything of note can be varied 😃).

I've got a lot of extra data to add in but I've got some basics working. It's a minefield of what I can add and what it does but I'm sort of getting there. The key is to get some usable data but I need to wait for some more data to populate before I can judge whether I'm on the right lines.

#15 Simon_C

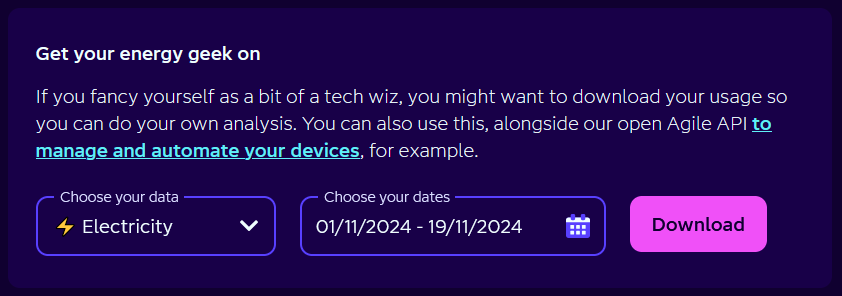
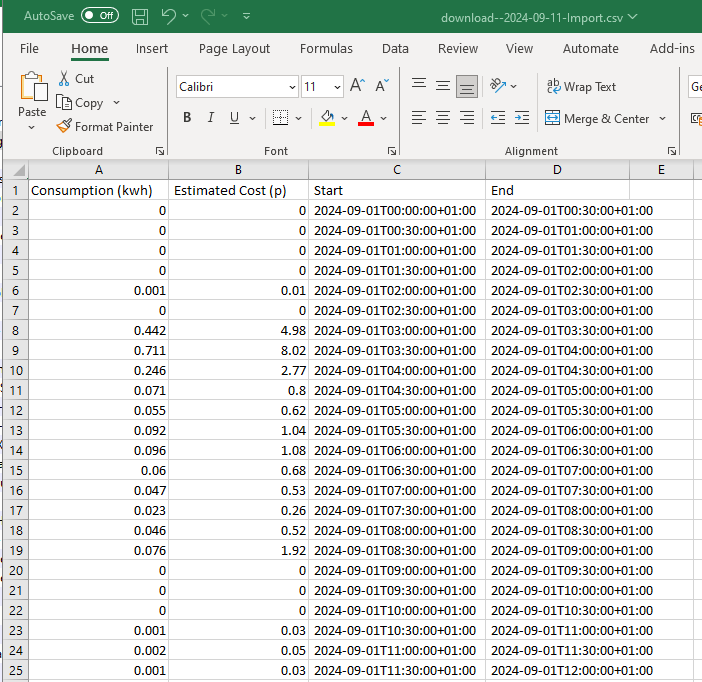
geoffreycoan, the newer version of the Octopus web portal has a CSV download facility that now includes the estimated cost for each 30 minute period.

I am on E7, but expect the IntelligentGo tariff provides the same data format. Before this new version with cost data, I just made up a spreadsheet to paste in 1 month of data then check the start and end times falling in the cheap or peak rate periods and total up the consumption for each on a per day basis.

The CSV example was in September when I did not need to use the whole 7 hours for charging between 0200 and 0900 BST.

X
#16 x5toledo

@Simon_C That's a great shout - having just looked at this in the web portal it does correctly show cheap rate blocks for one of the days of this month on OIG. It's going to need a laptop rather than the current tablet to be categoric but that's probably the best answer to the data requirement for correct half-hourly rates. A bit easier than everything else that has been on my mind! Thank you!

D
#17 DD

Simon_C Hmm... I'm not seeing that, just the 3 columns of: consumption, start and end.

My download widget looks slightly different - a single box with the 3 stacked fields, rather than a row of fields as you posted, and without the "if you fancy yourself as ..." Is the newer version of the portal at a slightly different url?

X
#18 x5toledo

Now at the laptop and seeing the detail of the Octopus download: kWh / Estimated Cost / Start / End. The price per half hour segment can be inferred - but only where there is a consumption element for that 30 minute block. Guessing that a missing price was just the same as the period before is possible... maybe inaccurate... but probably inconsequential in the final reckoning. So the downloaded data could be used as the OIG off-peak blocks between 05:30 and 23:30 do seem to show up in the csv.

My guess is that Octopus will make this download nice and clean with prices shortly before my Home Assistant shenanigans conclude!

R
#19 Rubikcube

DD The old url ends with 'consumption/home'. The new url ends with 'my-energy'.

D
#20 DD

Rubikcube Hmm - if I edit the url to end with that, it just seems to redirect me back to consumption/home.