R
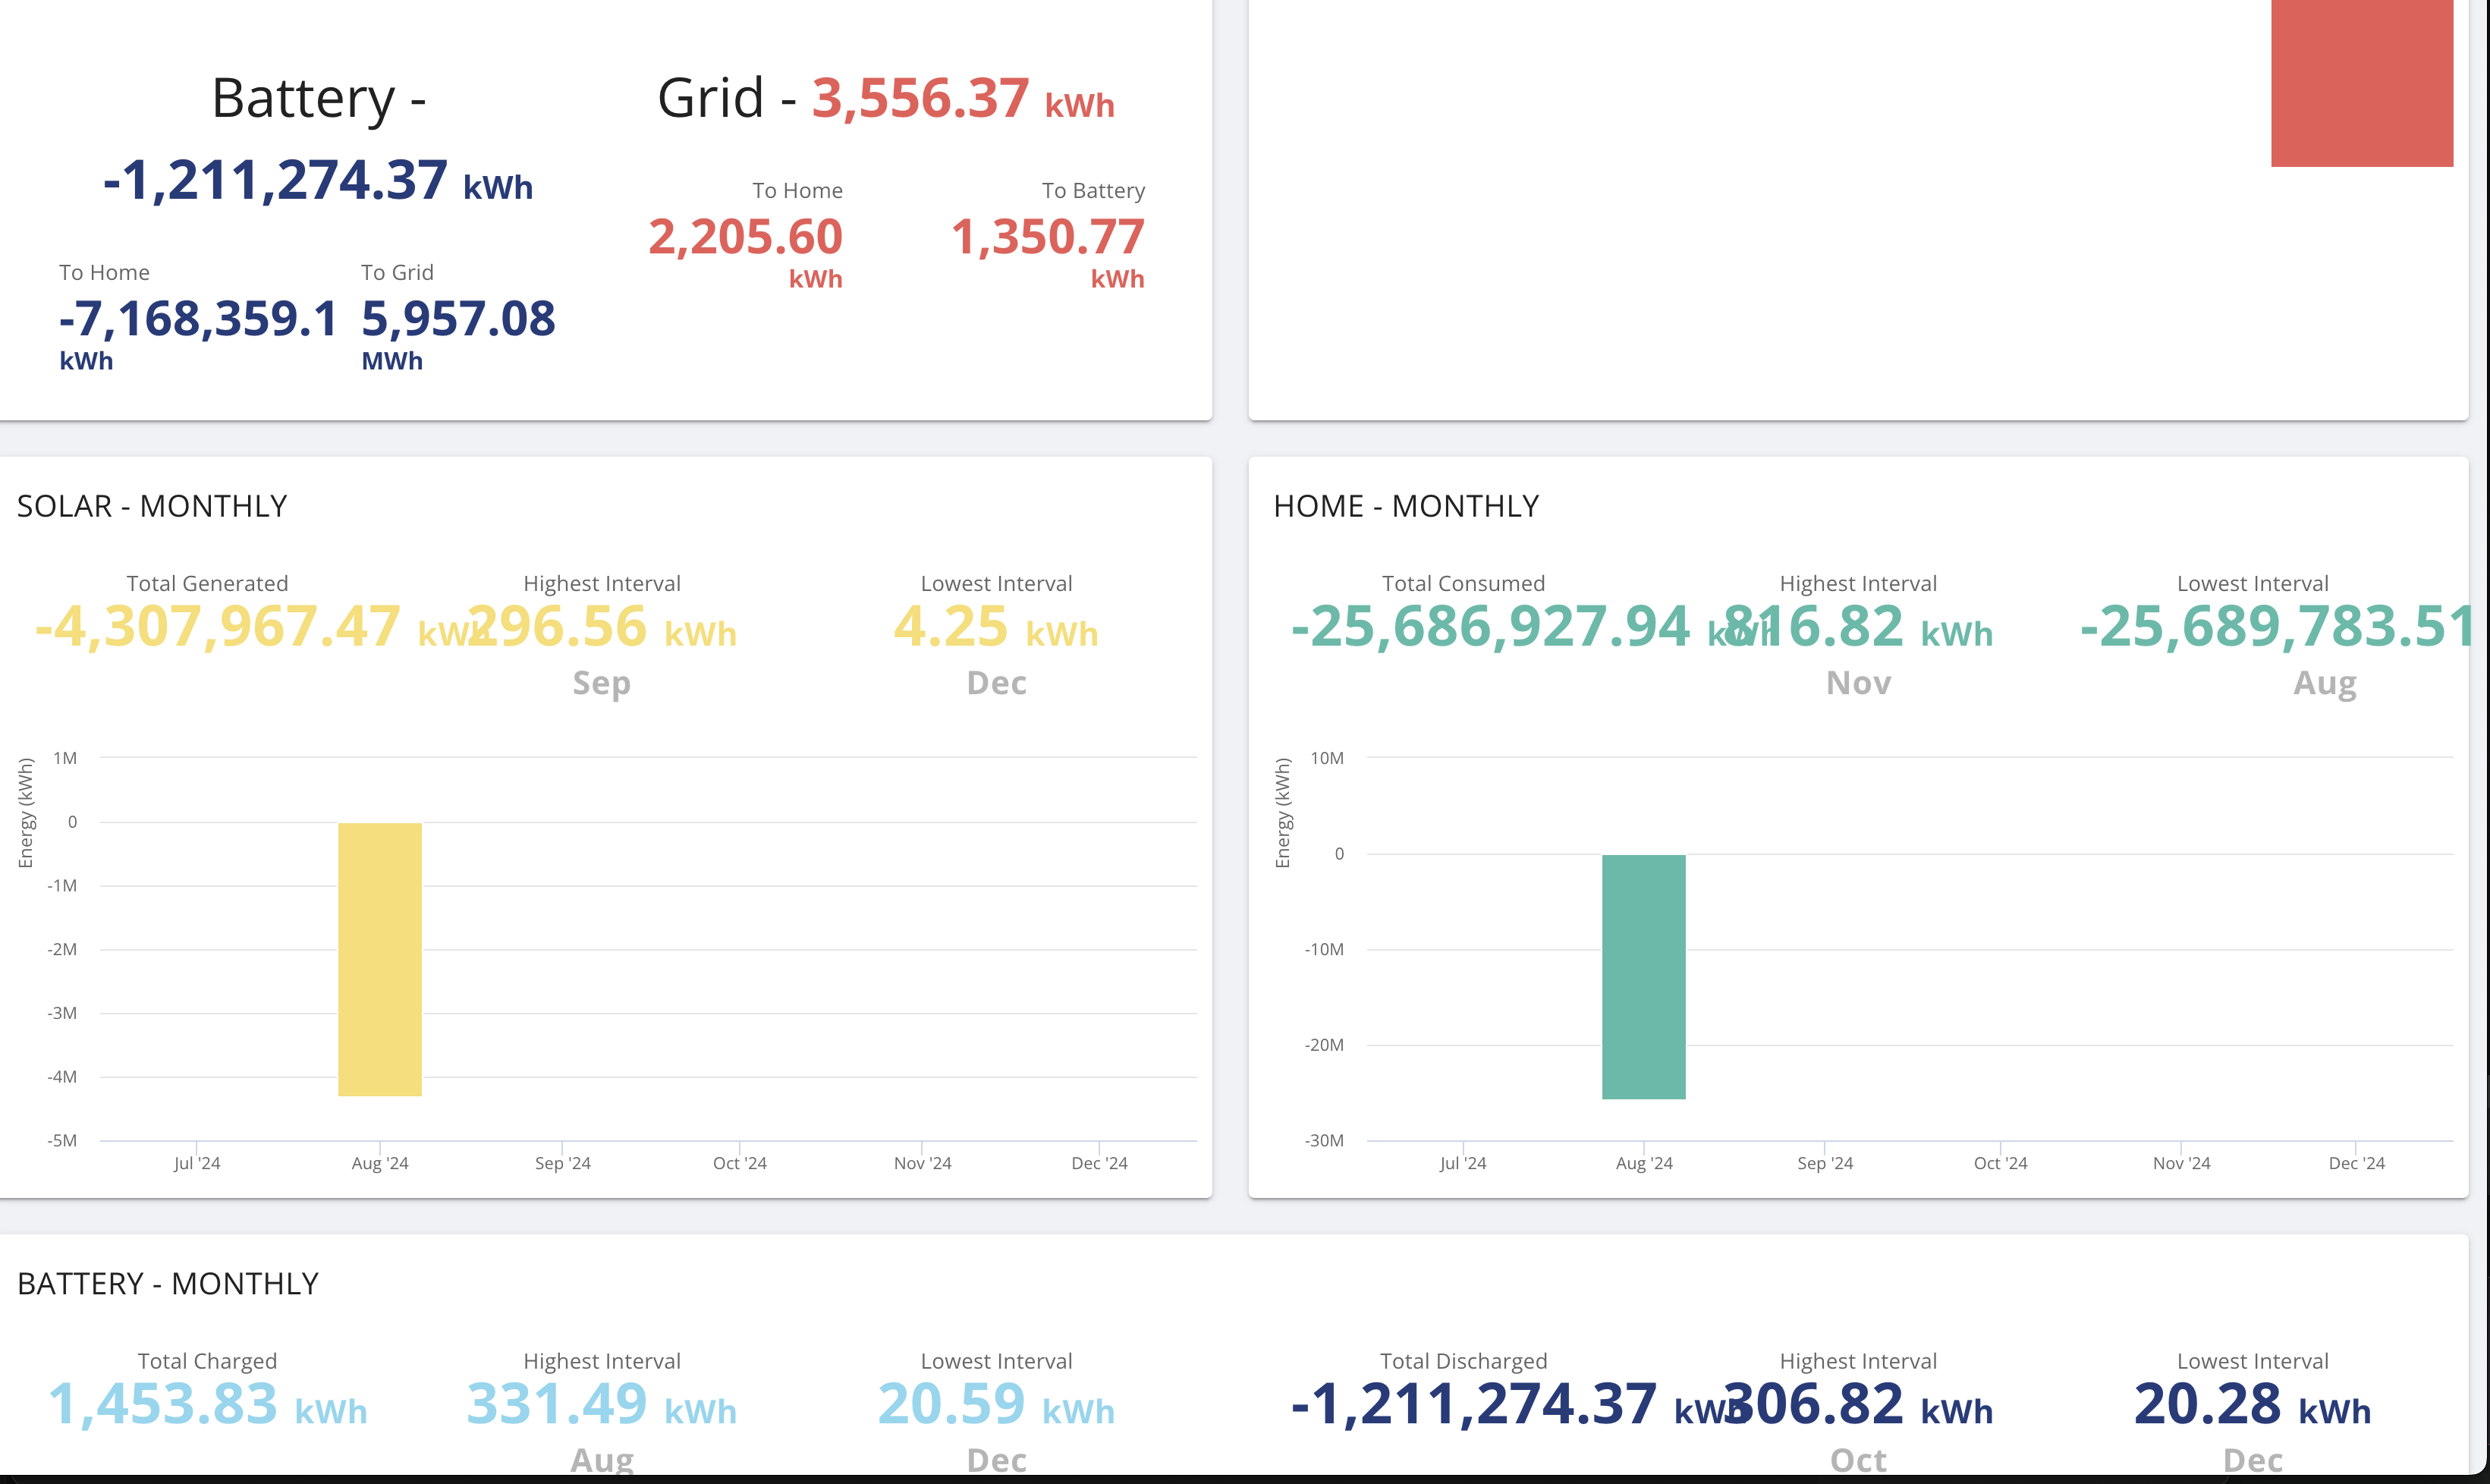
Generating a report for a custom timeframe from the dashboard produces inaccurate results, values to unreadable precisions and layout/readability problems.
See screenshot - in August I generate -4.3 million kWh of energy which may mean I'm expectedly living in a mini blackhole. Then nothing for any months beyond that on the graph but headlines show some spurious values.
Is everyone seeing the same kind of results or just me?