Spurious GivTCP readings in HA energy dashboard

27 comments started 2024-12-17 last 2025-02-08
Home Automation
J
#1 Josephiah

Hi all, have any of you come across an error like this? For the last few days my HA energy readings have gone haywire:
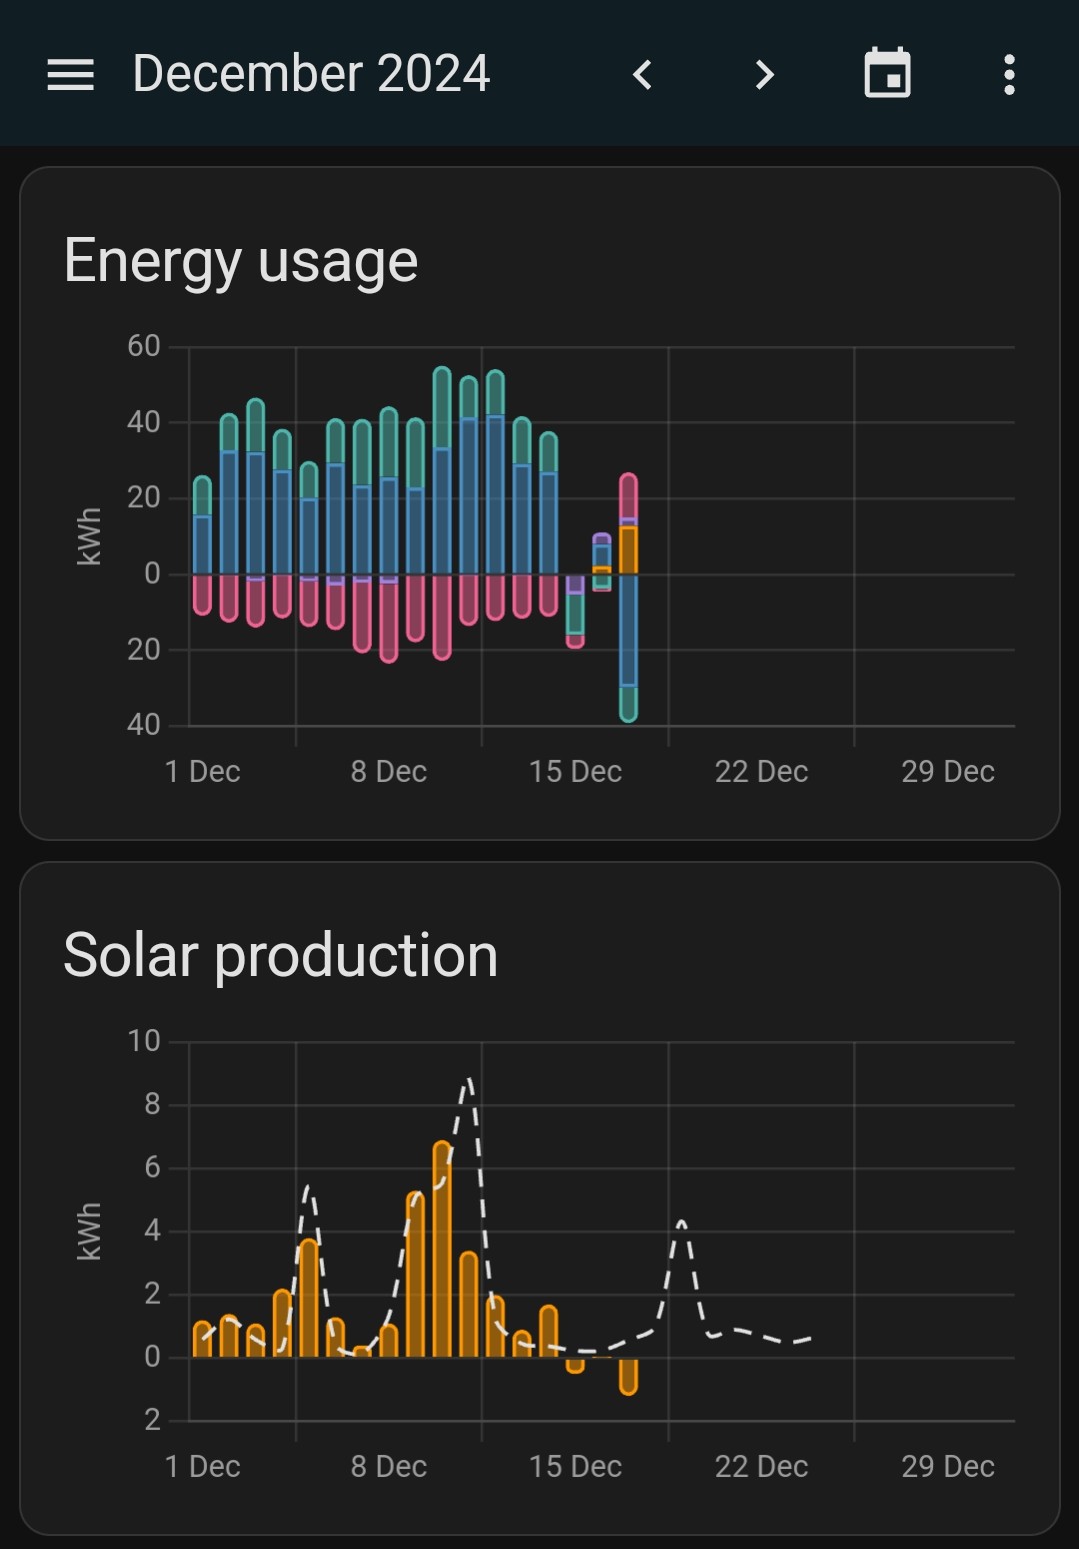
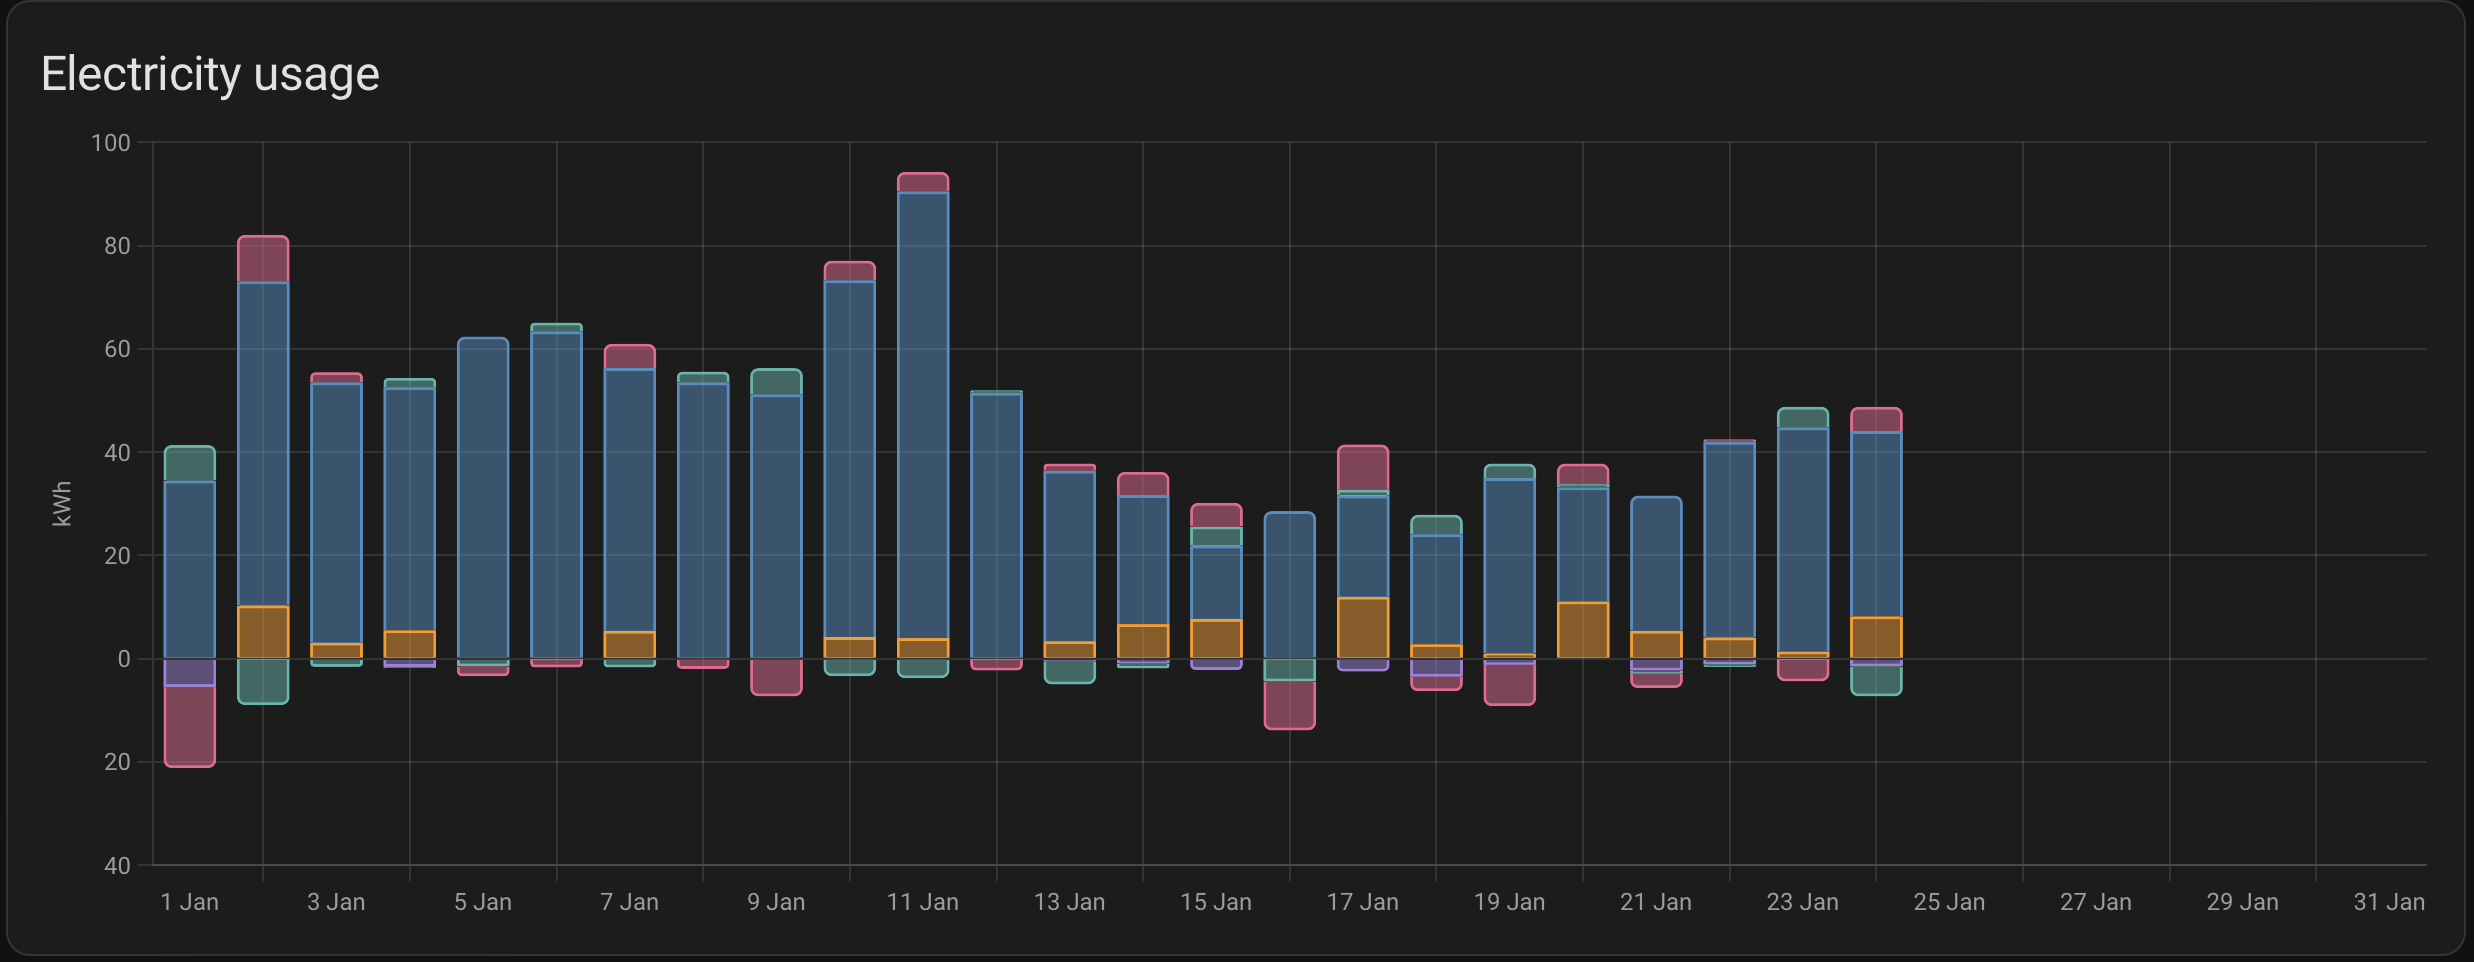
On each of the affected days there is this big (negative) spike followed by much smaller values through the day:
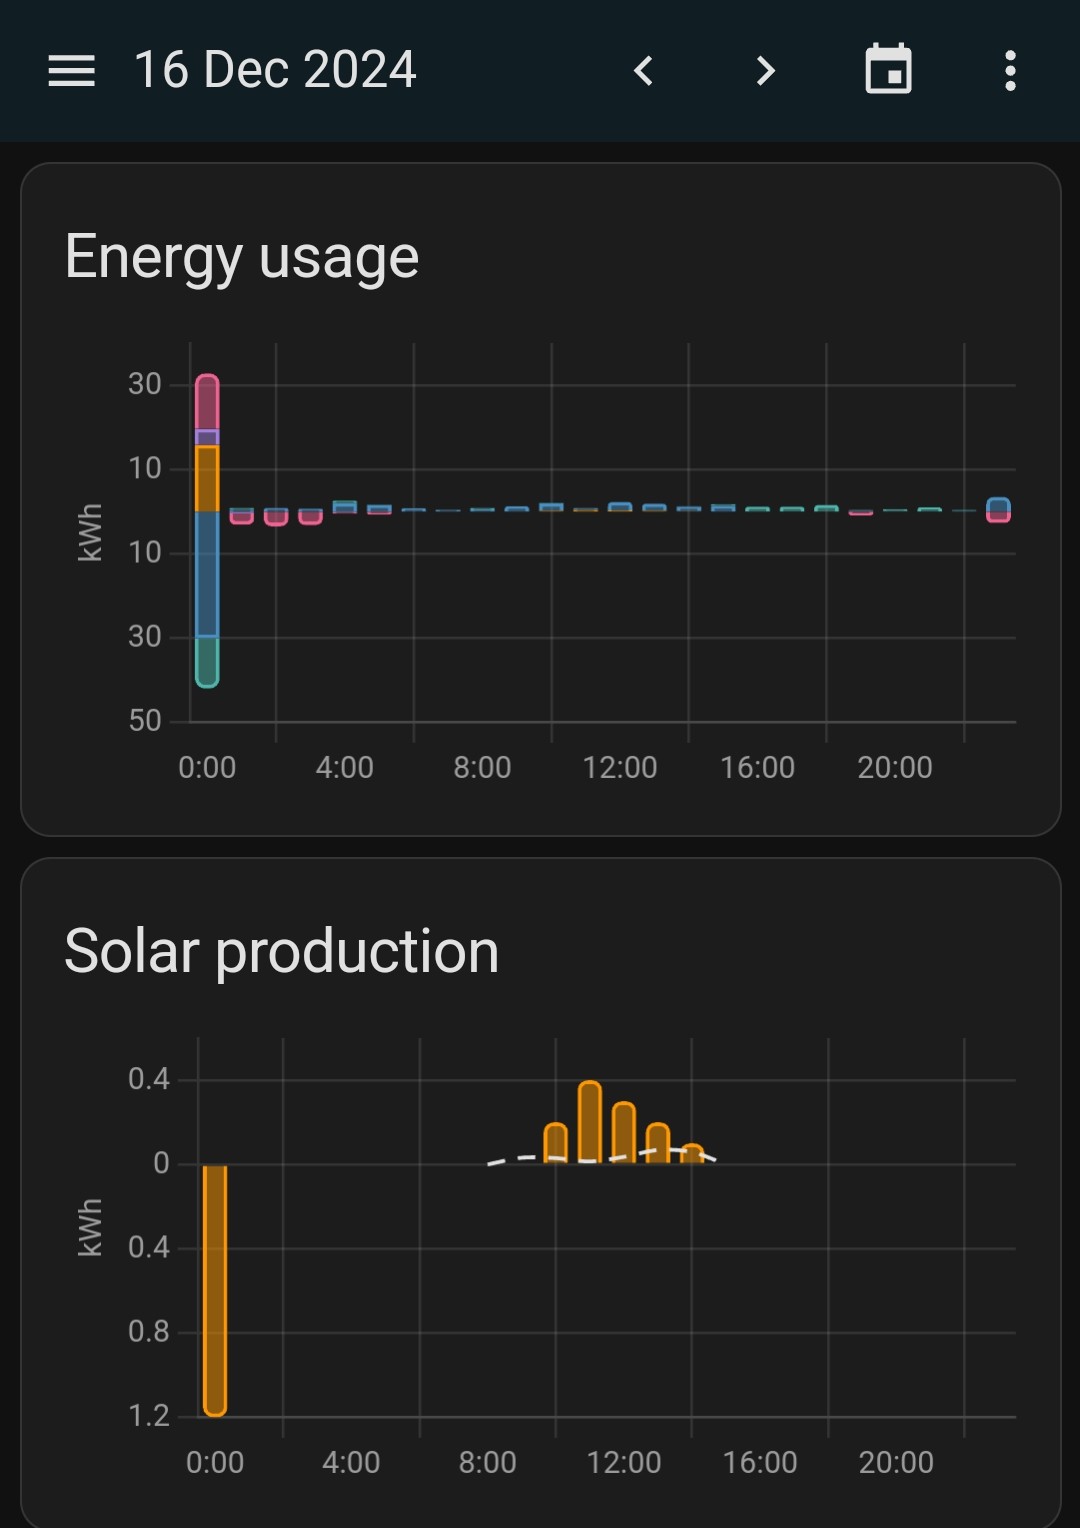
  • This coincides suspiciously with my upgrade is GivTCP at the weekend from 2.4.9 to 3.0.4 (which solved some problems I was having with Predbat);
  • I've been through the process of clearing out some duplicate values using MQTT Explorer, so I don't think it's that (the problematic values there were all battery-related);
  • I've checked that all the sensors in the Energy dashboard configuration are correct, and reassigned them, but no change;
  • Looking at each individual entity, the values in each cumulative sensor all look perfectly sensible;
  • It looks to me like it could be just a slight timing/synchronisation error, where the day's value is just catching the peak value reached the day before and incorporating it into the next day's stats, hence the large negative spike as the sensor resets to zero. It seems to me that whether the last and first messages of each day were sent at 23:59:59, 00:00:00 or 00:00:01 could make all the difference...

Any thoughts as to how to address this?

Thanks very much,
Jo
G
#2 geoffreycoan

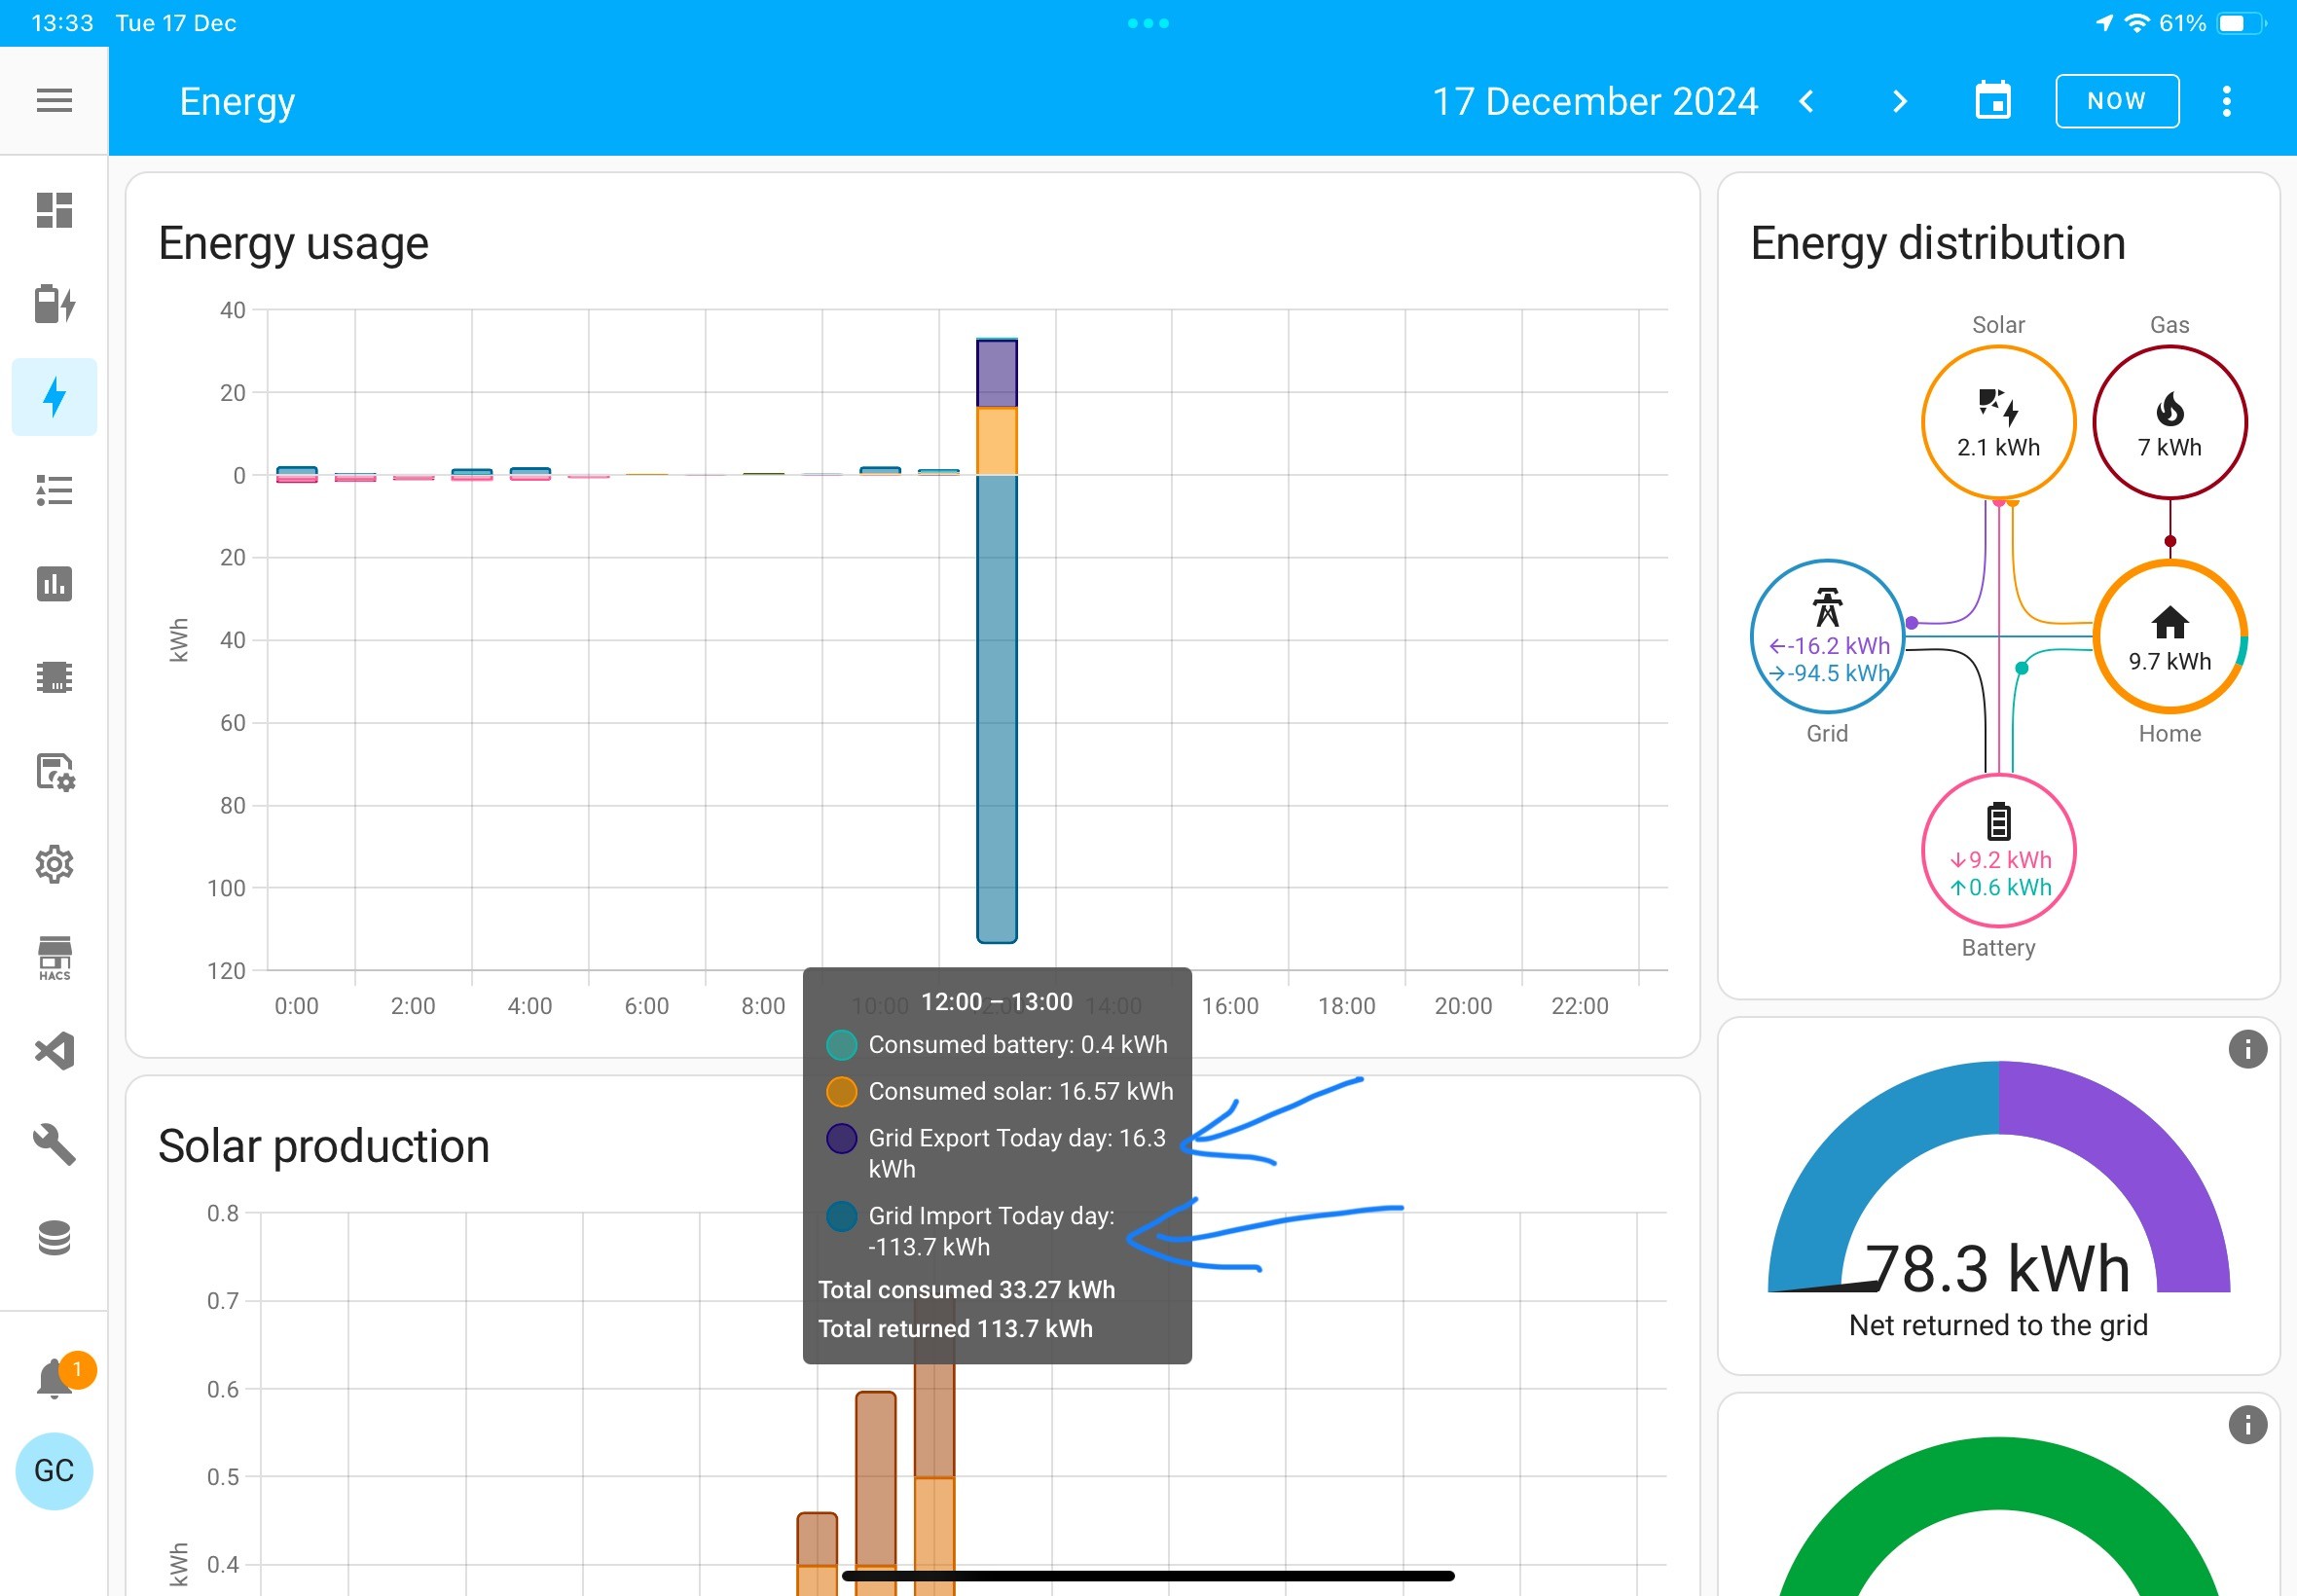
Josephiah Yes I have had very similar problems that particularly appear in the graphs when I reboot HA.

Swapping from GivTCP 2 to GivTCP 3 last week also caused these data big spikes for me. It was raised as a bug on GivTCP 3 and I’m hoping that now I’m on v3 I won’t have the problem.

Firstly are you using the GivTCP today or the total sensors in the energy graph? I used to use the today sensors and part of the suggestion was as you say timing around midnight. If you swap to the GivTCP total sensors in the energy dashboard then the dashboard still works fine, but doesn’t have the midnight jump - it also copes better if there is a gap in data.

However I still do get jumps when I reboot HA. What I think happens is the sensor gets confused and it puts the entire total value in to the sensor as a ‘now’ reading, and then soon afterwards it reverses it all out.
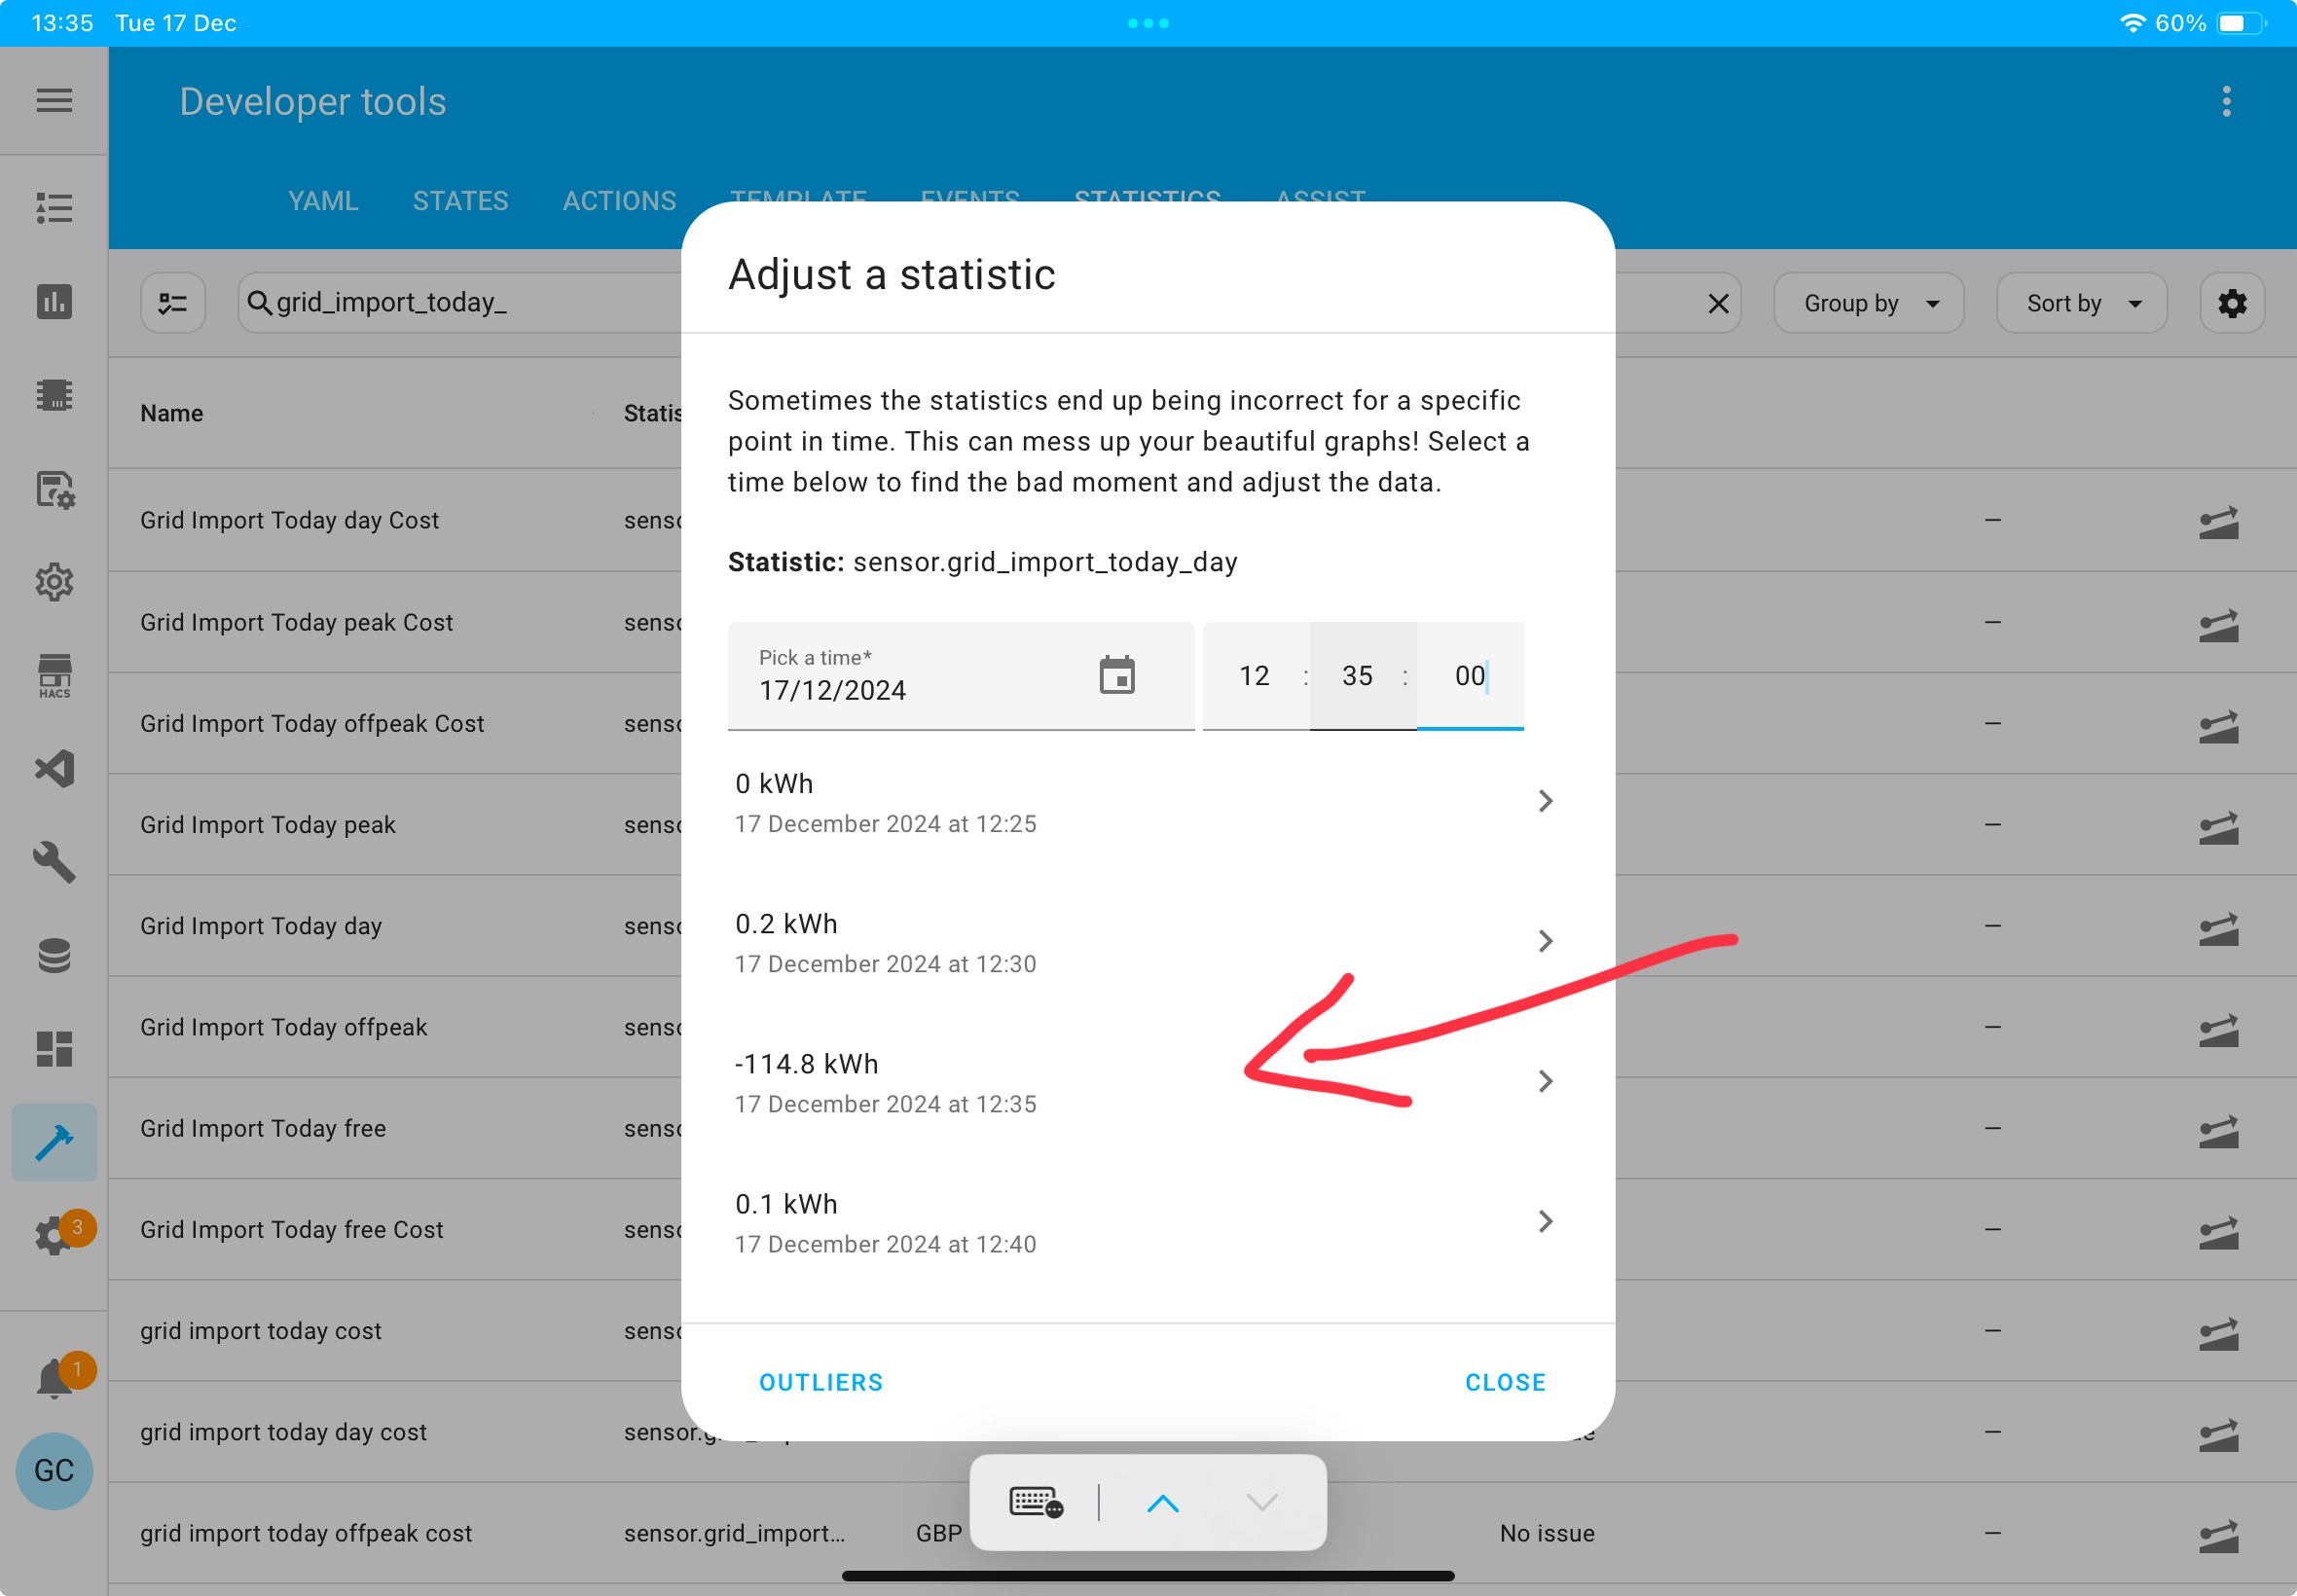
The way to fix this is a bit messy but I’ve had to do it several times:

  • go into developer tools/ statistics
  • search for the sensor name used in the dashboard e.g. battery_charge/discharge_total, grid_import/export_total, pv_energy_total, grid_import_cost
  • select the date that the data jumped on the graph
  • select a time before the jump, and keep incrementing the time eg: 08:00, 08:20, 08:40 until you see the data anomaly, they’re very clear positive and negative numbers in a data set that normally grows in small increments
  • you now need to fix the incorrect data point which covers a 5 minute or 1 hour period in the HA - if its recent data it will be 5 minute slots from the short term statistics, longer term stats are groomed to 1 hour period
  • if you want to get the data point absolutely correct, work out what the correct new figure is (e.g. solar generation) from the GivEnergy Portal, meter section and sum it from the inverter 5 minute snapshots. Since I am almost always always correcting this in the 5 minute short term statistics I usually just set it to zero as I don’t need 100% accuracy in the energy dashboard

And then repeat for the other data jumps, and sensors. Swap back to the energy dashboard after each change and you can see it progressively being repaired

W
#3 Weasel

I too have had these issues with GivTCP3 (I never had v2, I am a relative newbie to HA). They were resolved when I switched to using the "total" sensors rather than the "daily" ones

J
#4 Josephiah

geoffreycoan ah, amazing, thank you. You do great consistent line in clear instructions to resolve obscure problems, so thanks for that!

Switching to the 'total' sensors looks to have fixed that in one fell swoop. No stats edits required at all just now, but will bear that in mind/bookmark this for next time I reboot.

G
#5 geoffreycoan

Josephiah I just upgraded my HA from 2024.10.4 to 2024.12.3 so needed a HA reboot, and afterwards I see that I had precisely this stats problem.

Was hoping that the move to GivTCP 3 would have resolved it, but it seems not. The battery charge and discharge and solar generation are all looking good, but I got a big negative spike in my grid import and a big positive spike in the grid export:

Had to adjust sensor.grid_import_today_day, grid_export_today_day and matching _compensation sensors, e.g.:

I suspect this may be because I am using utility meters to wrap the underlying import and export sensors and the UM’s are loosing connection to the source sensor when HA reboots although strangely can’t see any error in the HA core log.

J
#6 Josephiah

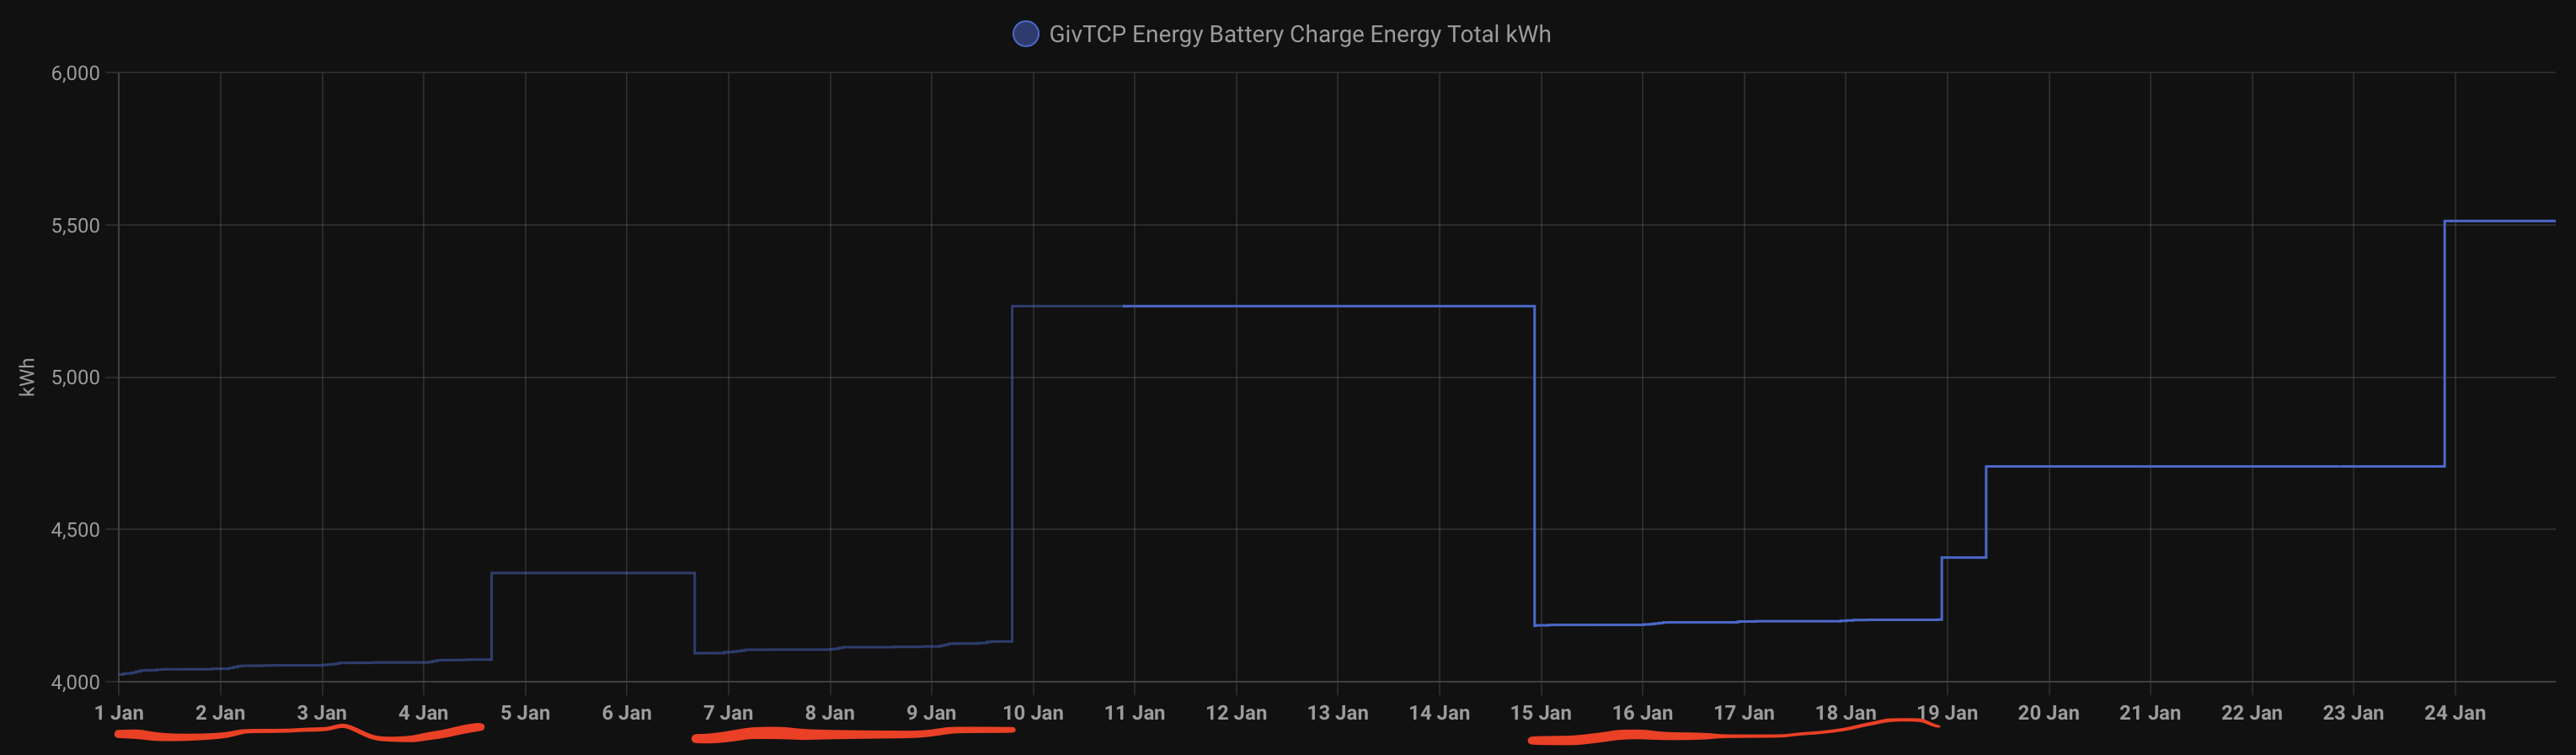
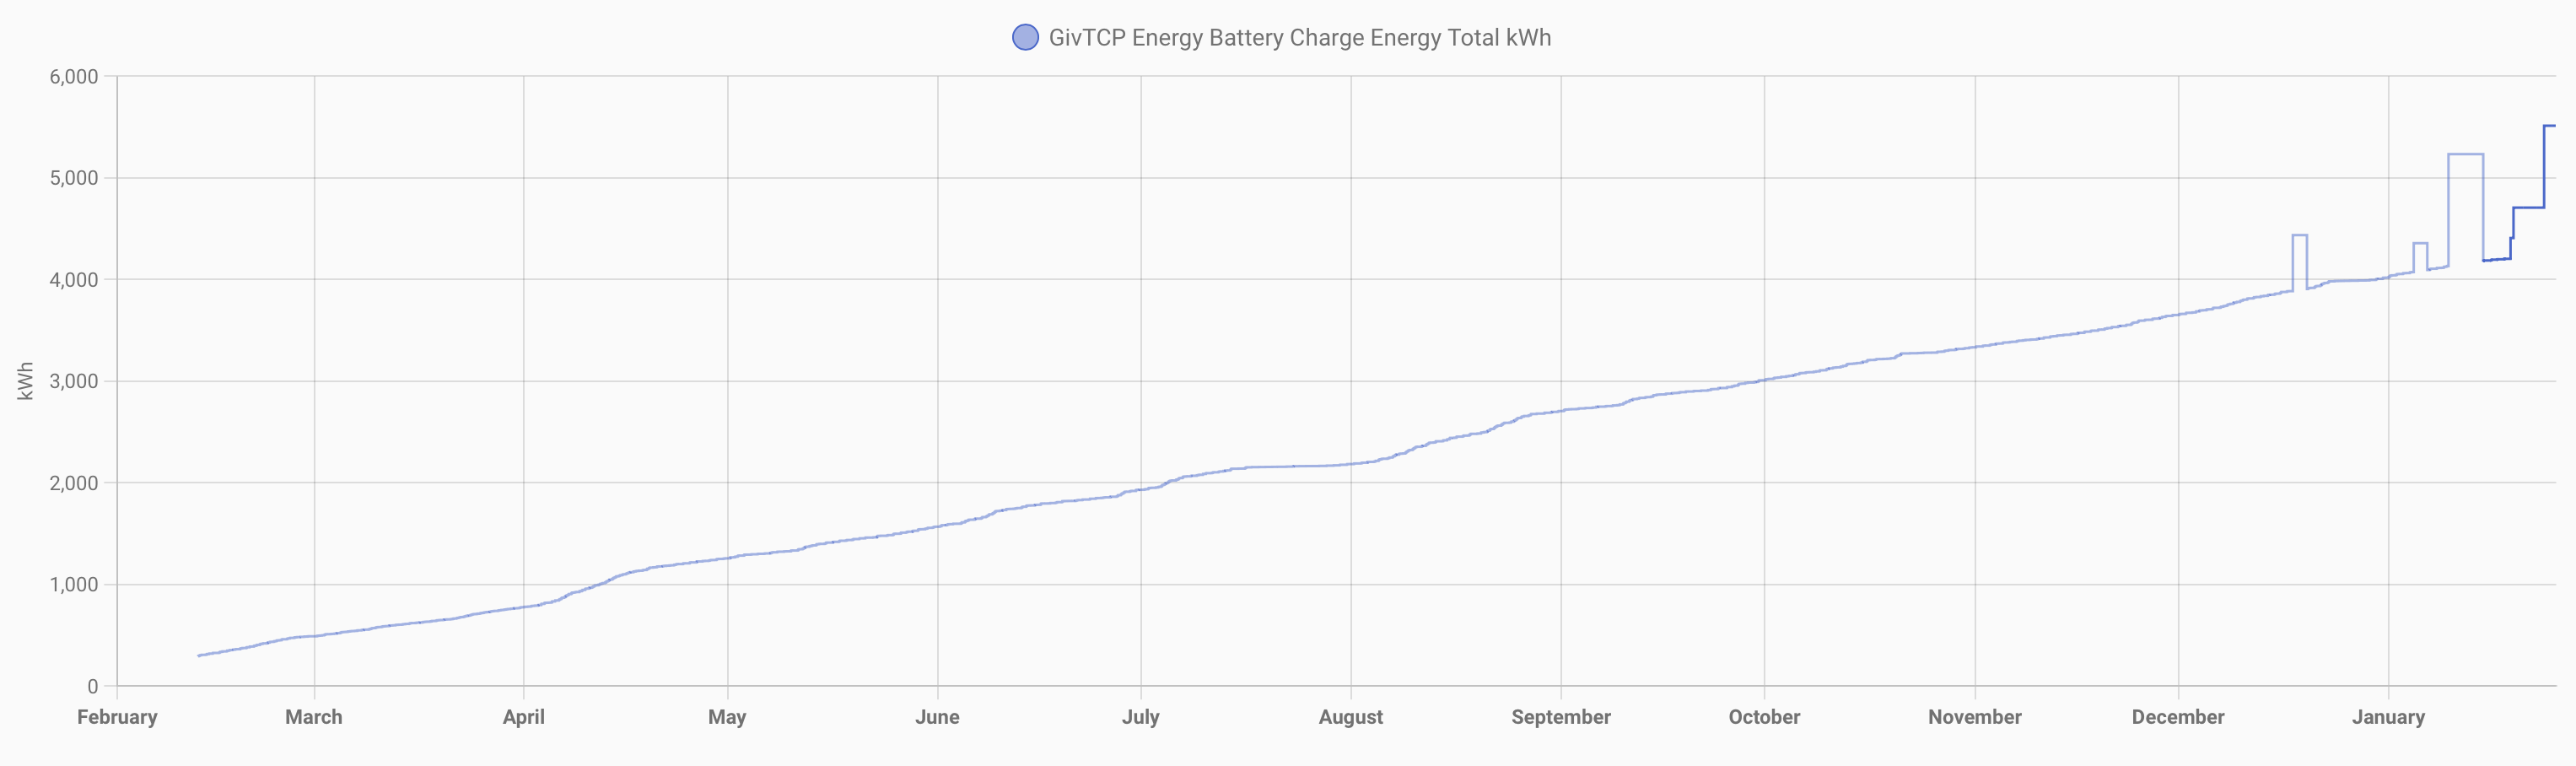
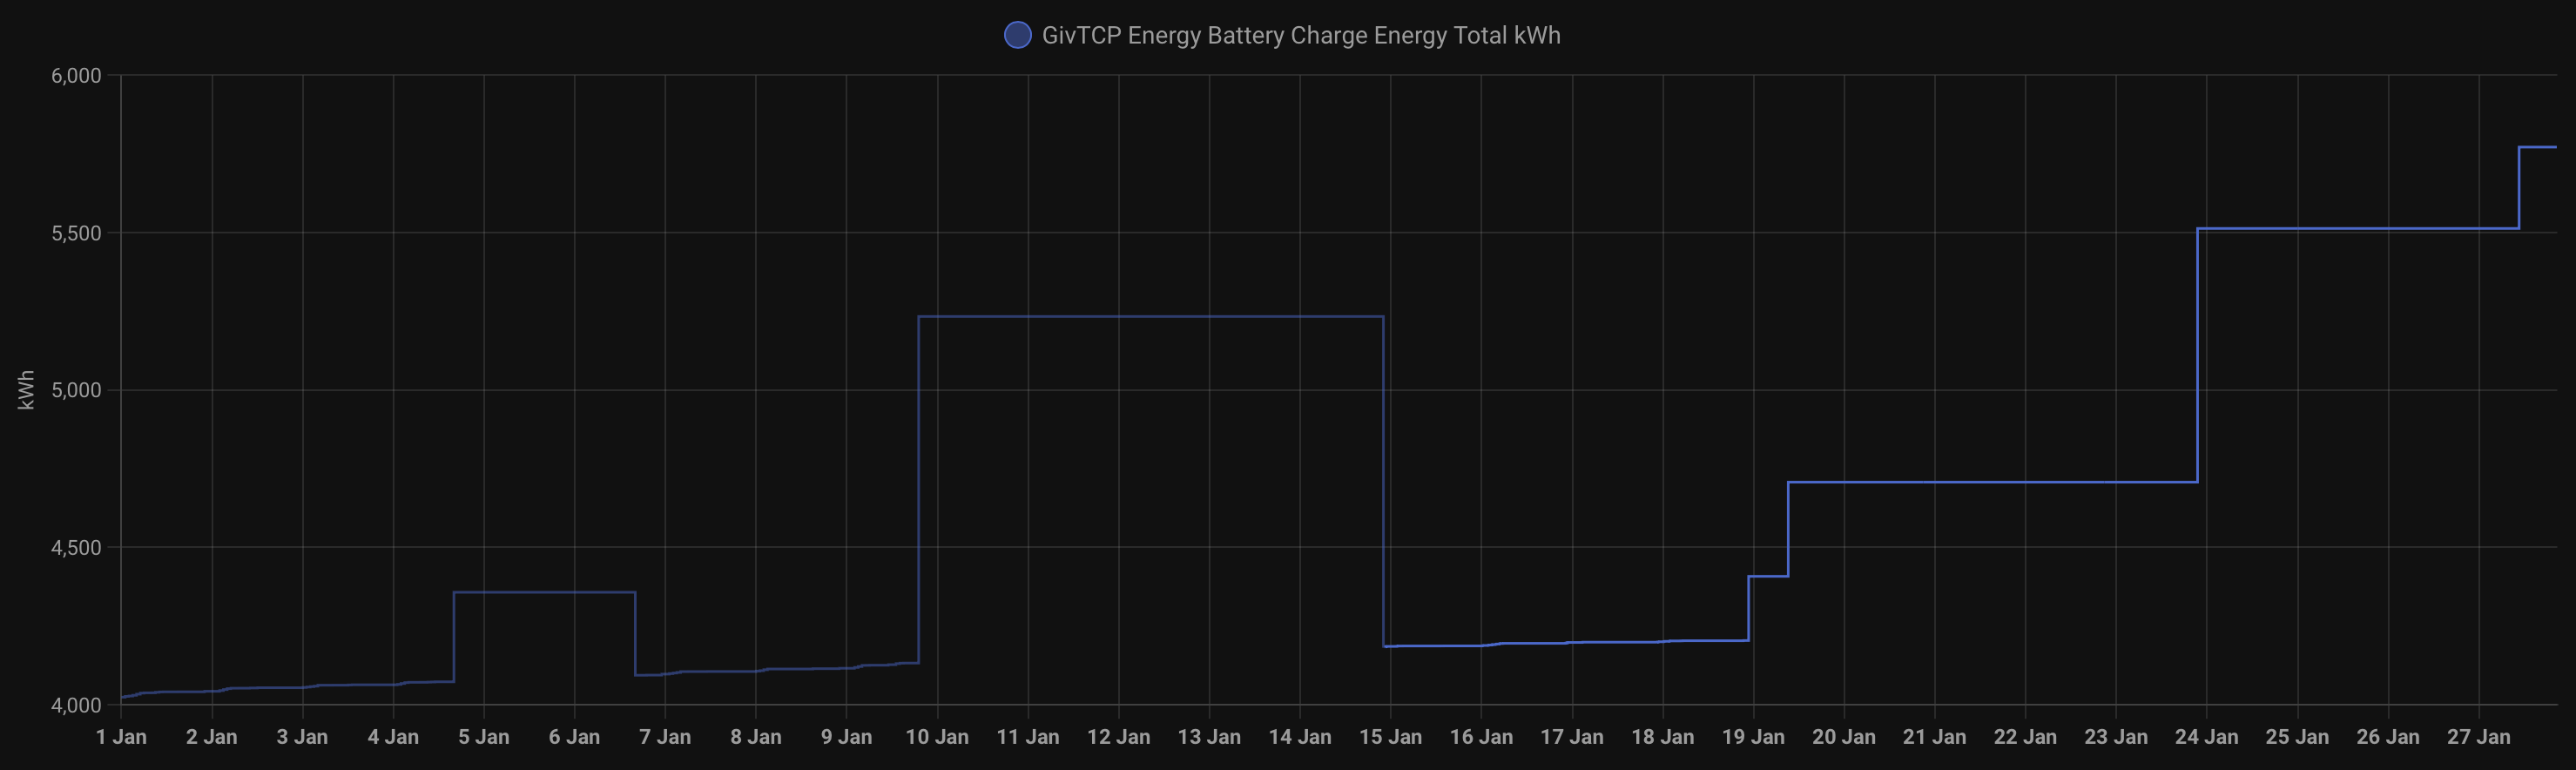
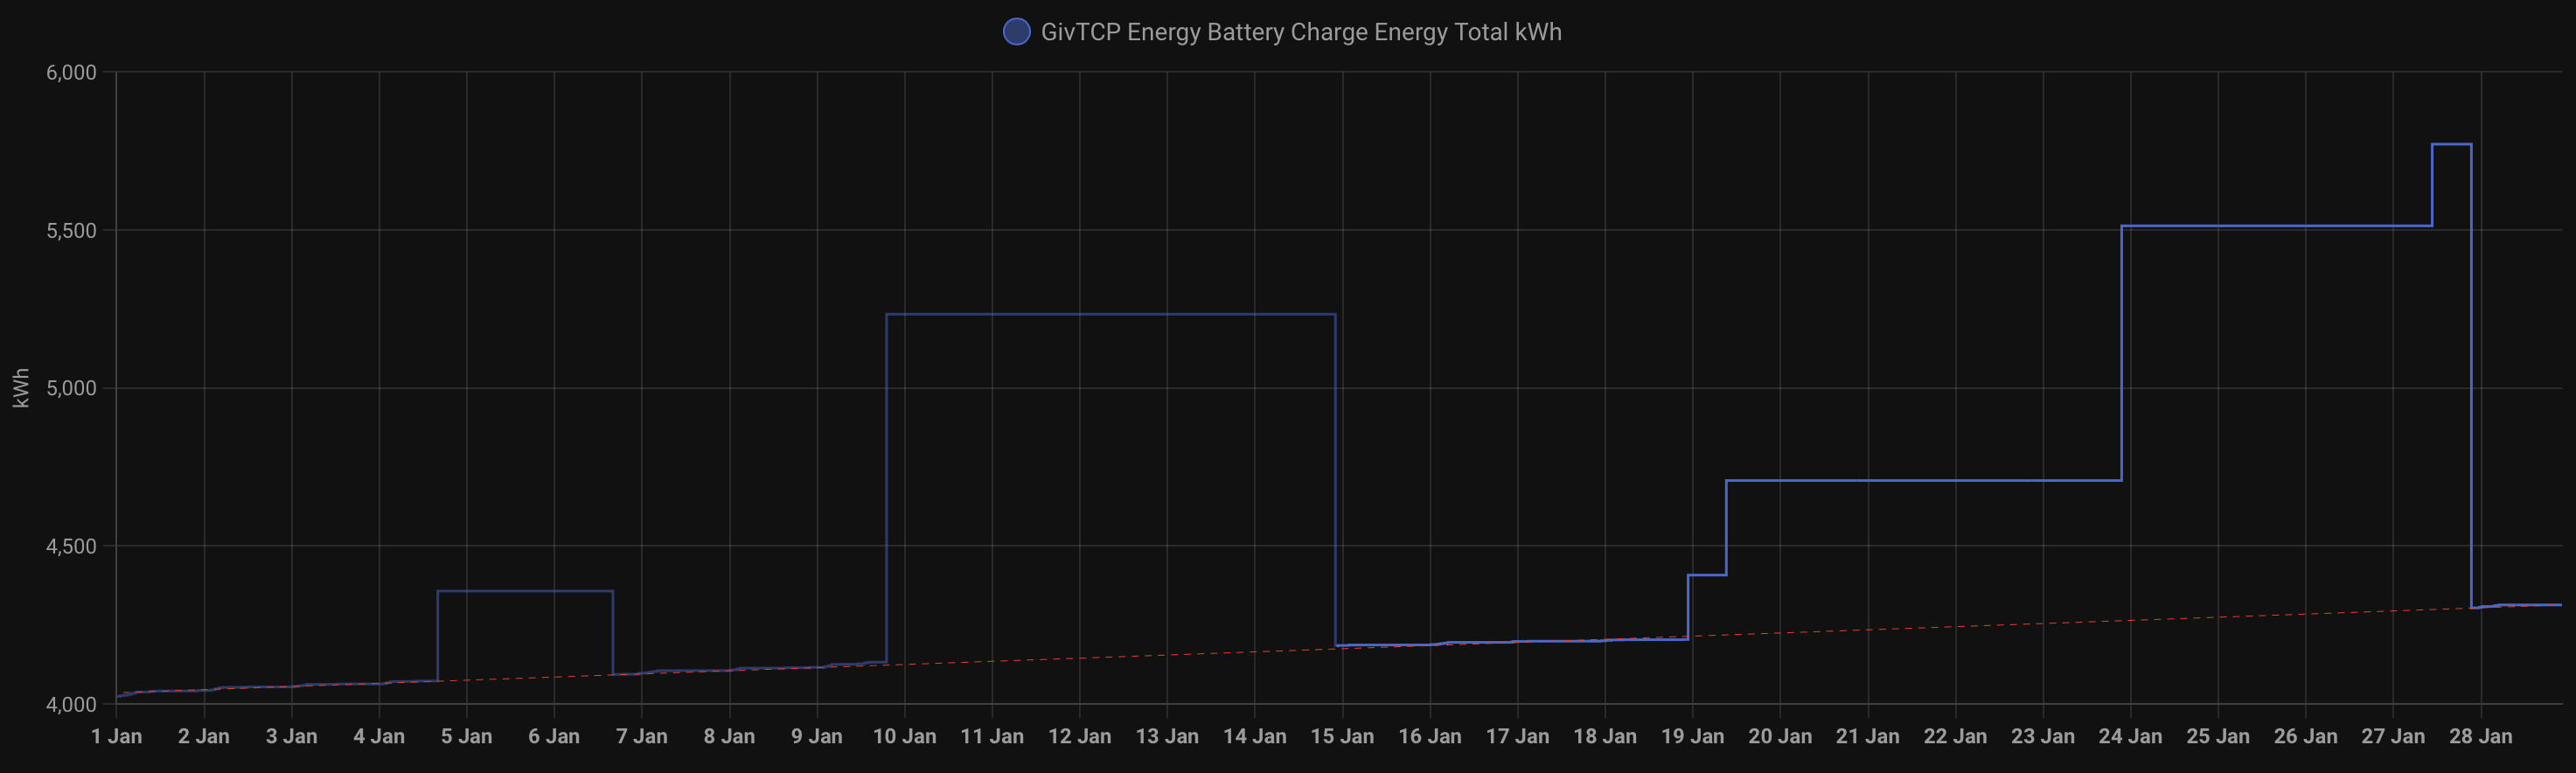
Hmm, this worked for a while, but I've since had a couple of spells of very odd readings again - gaps of a few days, followed by sudden big spikes. They seem to all be related to "GivTCP Energy Battery Charge Energy Total kWh" (the grid, home and PV sensors seem to be okay). The history graph for this (shown below since the turn of the year) is very strange. The regions underlined in red look plausibly correct (i.e. gradually increasing at a sensible rate); but then it has these massive jumps to a random constant value for days at a time.

Switching back to the 'today' version of the sensor didn't help (though its history graph looks fine) - that produces even weirder results with some charge instances appearing as positive numbers instead of negative on the top of the column charts...

Anyone else having this problem? Any further suggestions on how to solve? I've been plonking the daily total value into the developer tools (can't be bothered doing half-hourly!) but the interface makes this hideously tedious to even put in a single daily value.

G
#7 geoffreycoan

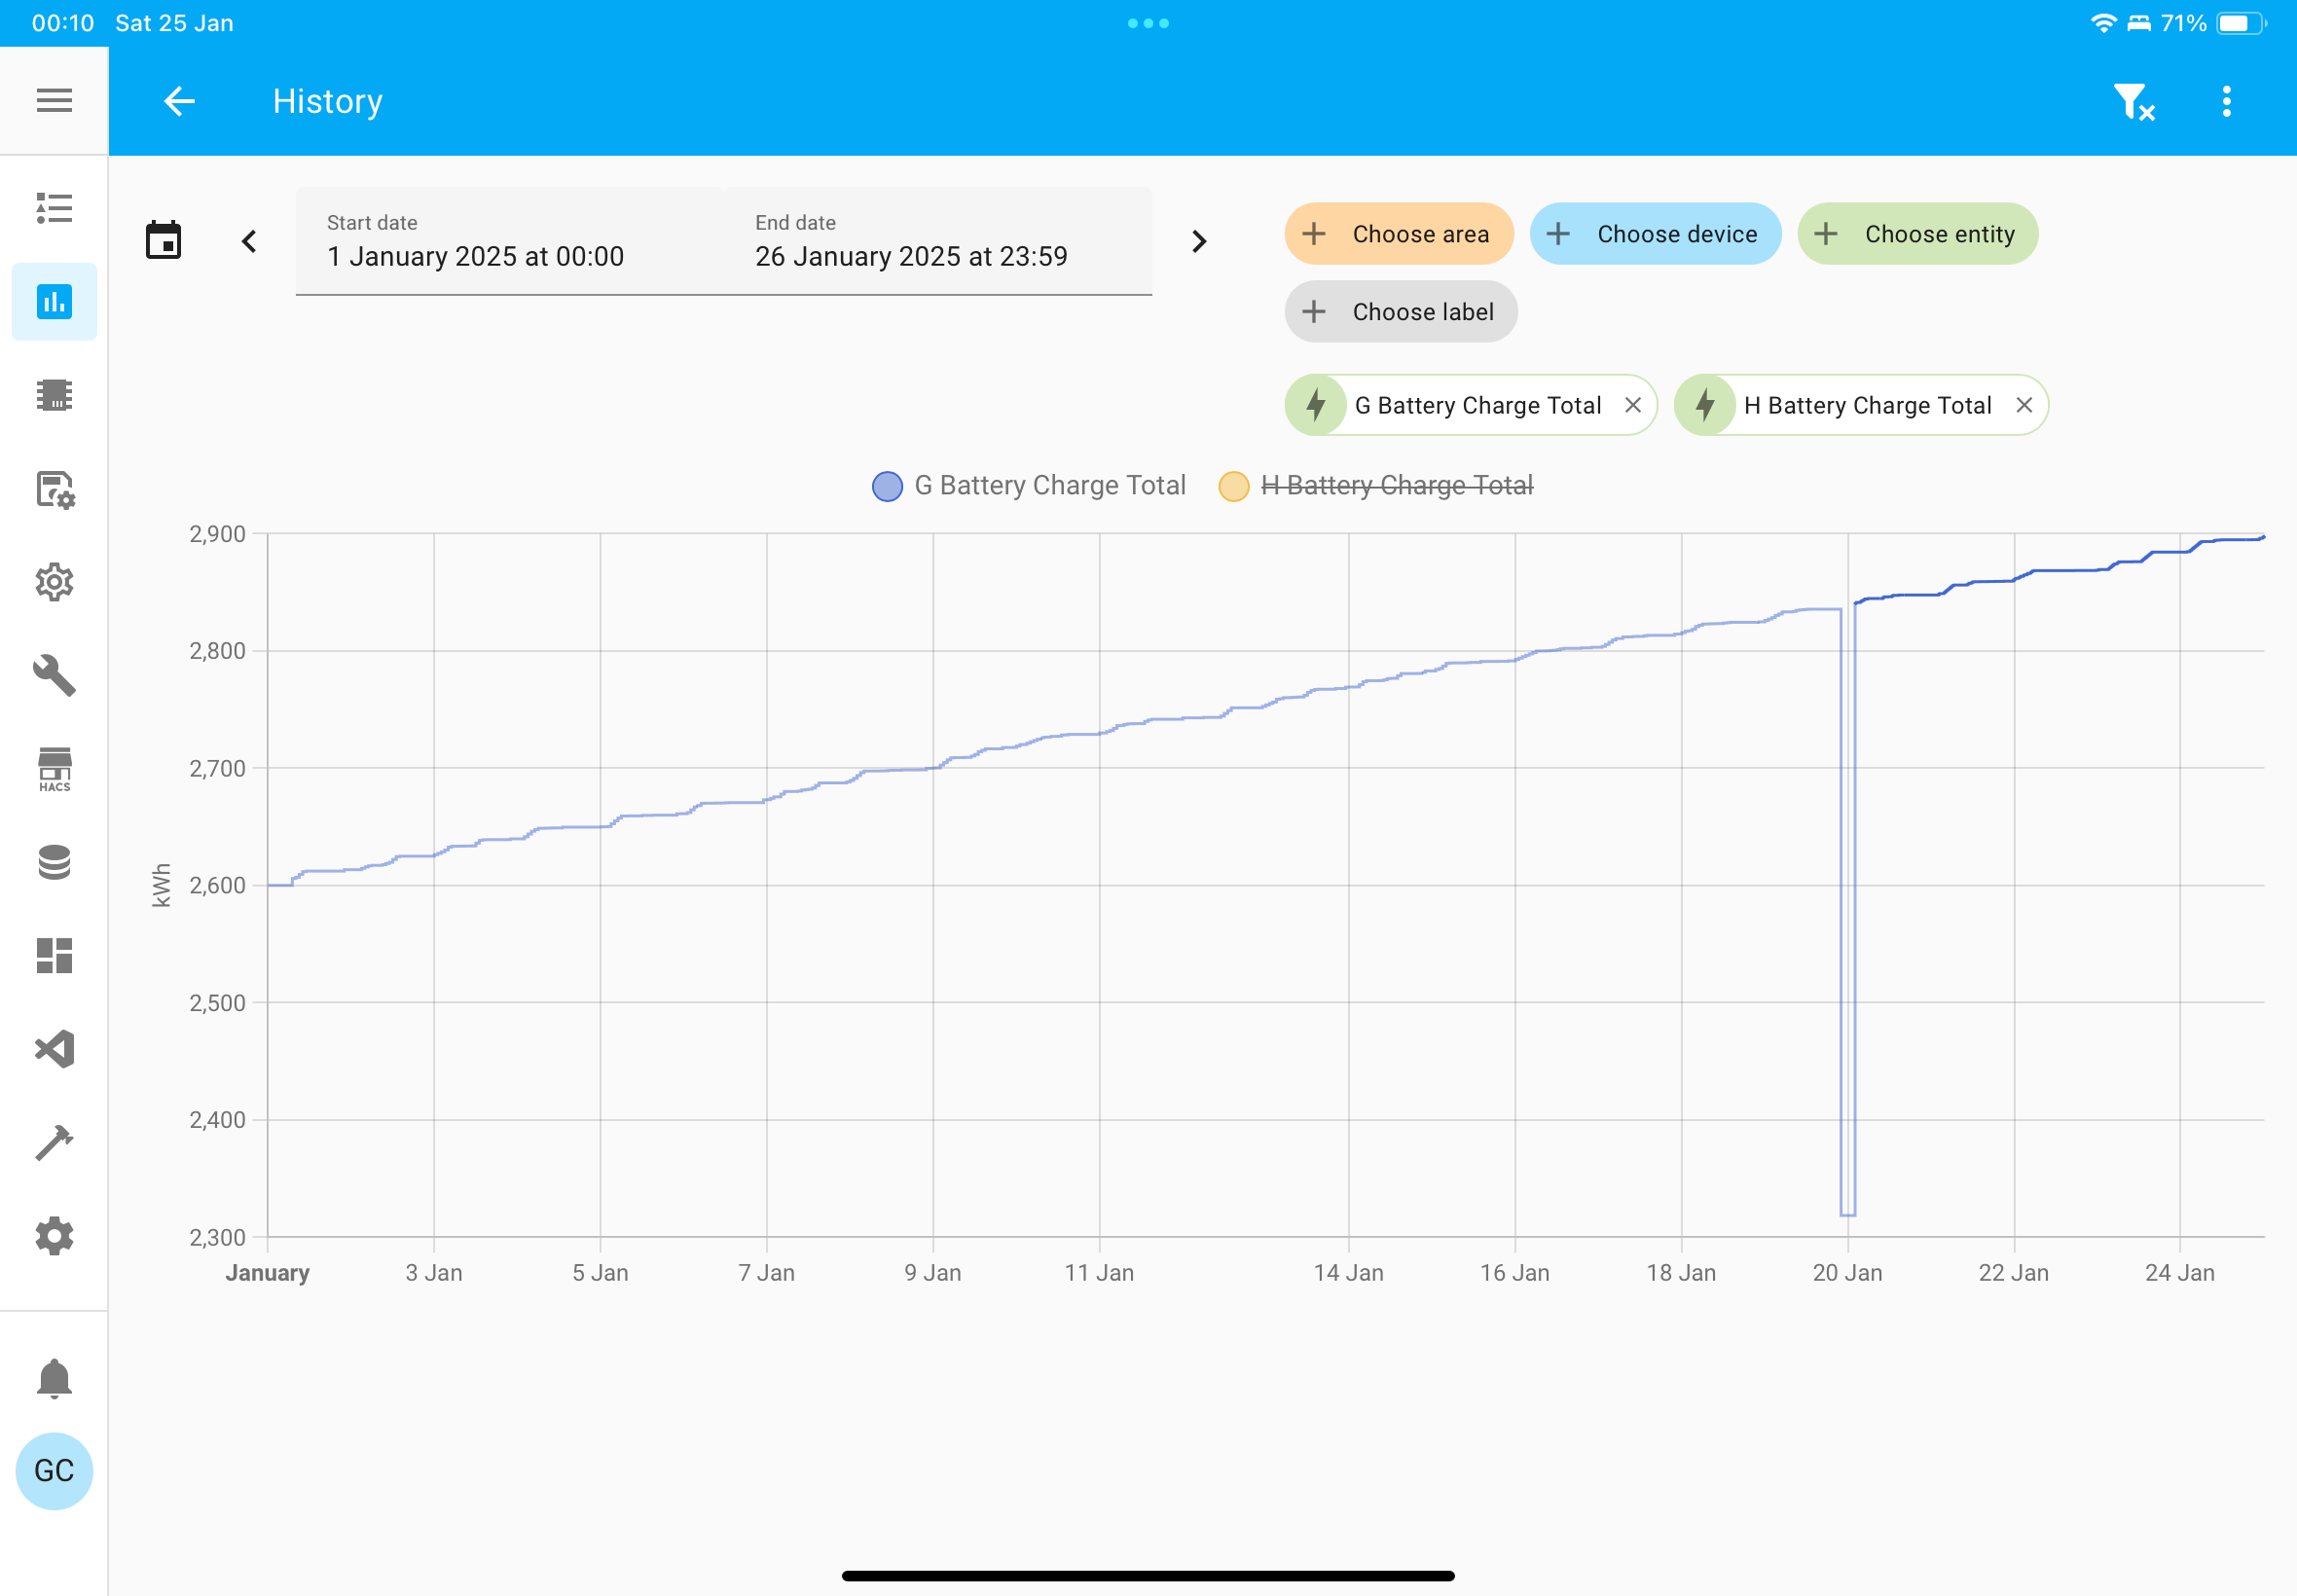
Josephiah If I look at my battery charge total then it shows a nice consistent line apart from 20th January where my long term statistics stopped working (see other post I made on this). I got the stats working again but haven’t been back yet to repair the data for that day:

I still have the problem with big positive or negative swings in the sensors I use for the Energy dashboard when I reboot HA. It seems to particularly affect the utility meters I use for grid import and export but I do get a random selection of the givtcp total sensors spiking as well. Its just part of the process now to check the energy dashboard after a reboot and fix the broken stats.
Having said that, when I upgraded to HA 2025.1.4 today, not a single spike occurred. Odd.

The total sensors come straight from the inverter AFAIK, very strange that they should jump up and then duck down again. When it jumps up, if you look at the raw inverter totals with the BBC inverter app what do you see, totals that match givtcp or different?

J
#8 Josephiah

Looking at the history for last year, it all looks good except for a blip from 17-19th Dec. Then it all goes to pot this year. Haven't noticed anything similar on other sensors. I occasionally get the spikes you mention on restarts, but probably only 10-20% of the time; usually don't notice a problem.

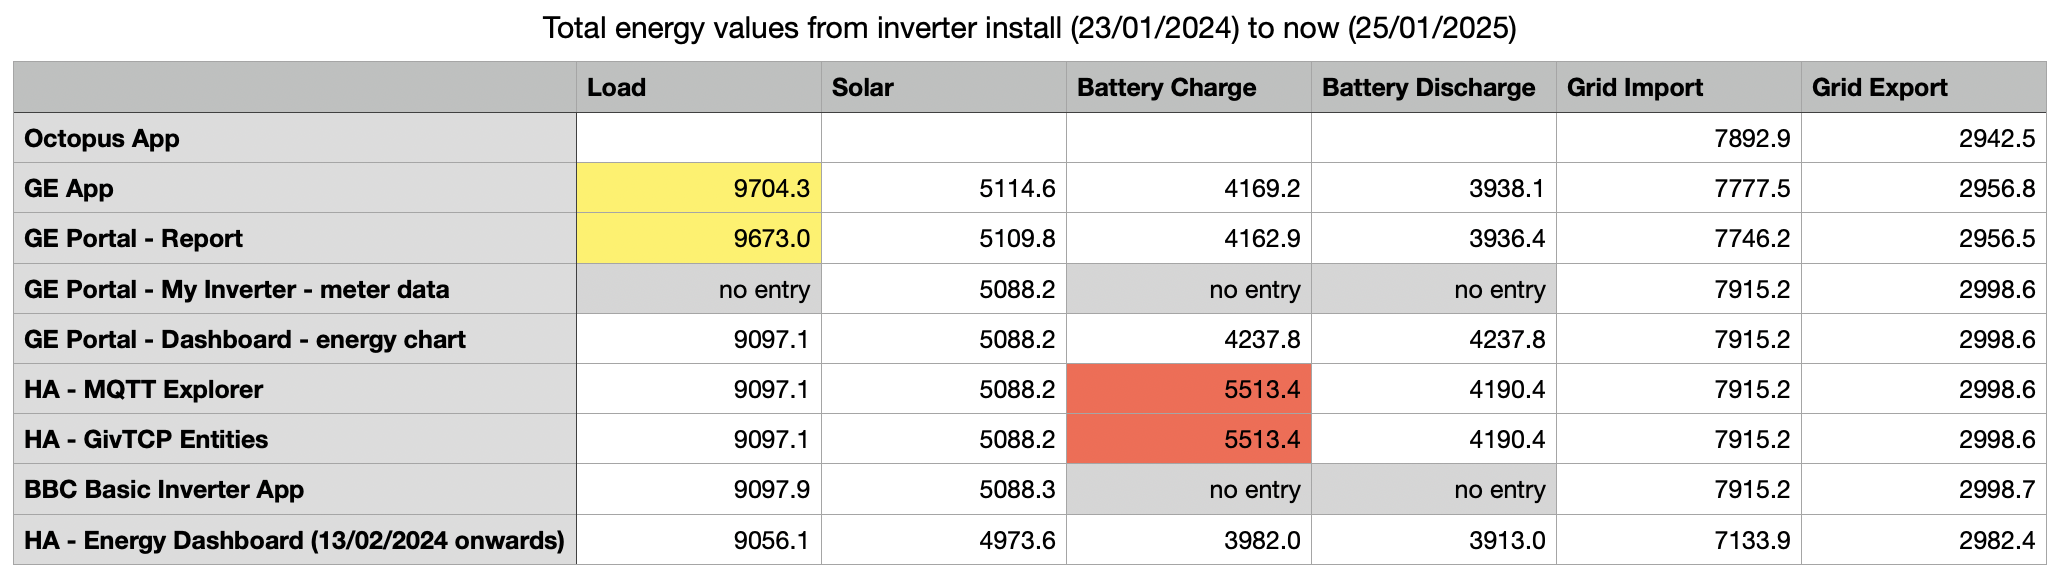
Here's my attempt at grabbing all the data I can from all the sources I have:

I don't understand:

  • (yellow) why the GE app and portal are giving such a different total load energy value - might need to do a month-by-month check on those;
  • (red) why the total battery charge energy is so different when imported to HA via GivTCP - all the other values are a perfect match between these two places.

The other discrepancies I can readily believe are down to rounding, looking at similar but slightly different quantities, etc.

G
#9 geoffreycoan

Josephiah the yellow discrepancy is I think due to the way the app and portal report work. They take 5 minute snapshot power figures and then interpolate that the load energy has been constant over the entire 5 minute period

the red though makes no sense. They are the same because the MQTT entities read by GivTCP are auto-discovered to appear as HA entities, but that doesn’t explain why they are so much higher.

If you were getting a discrepancy on just the HA entity then I might put it down to jumps in the HA statistics that are causing the issue, and going back and finding those and removing them would resolve your issue, but you are getting them from MQTT so presumably the inverter directly.

I don’t have totals for battery charge and discharge either in the portal or the BBC app, and I think I remember @hoggy saying that this was due to the Gen 1 inverters not having a specific register for this, and instead having a combined ‘battery throughput’ register which you do see in the portal - that combines charge and discharge.

So maybe GivTCP is not reading this directly from the inverter but is calculating it somehow? Doesn’t explain why the jumps and why the battery discharge total aligns pretty well. Would the jumps and instability this year coincide with you moving to GivTCP v3? This all might be a question to raise on GivTCP github for Mark.
Have to admit battery charge and discharge isn’t something I particularly look at, but as above mine seems to be behaving itself.

J
#10 Josephiah

geoffreycoan So maybe GivTCP is not reading this directly from the inverter but is calculating it somehow? Doesn’t explain why the jumps and why the battery discharge total aligns pretty well. Would the jumps and instability this year coincide with you moving to GivTCP v3? This all might be a question to raise on GivTCP github for Mark.

Yeah, probably worth doing.
It must also be possible to calculate it from other entities as a workaround, so will ponder that option in due course.

geoffreycoan Have to admit battery charge and discharge isn’t something I particularly look at, but as above mine seems to be behaving itself.

Yes, same here, only notice it because it's mucking up my Energy Dashboard!

J
#11 Josephiah

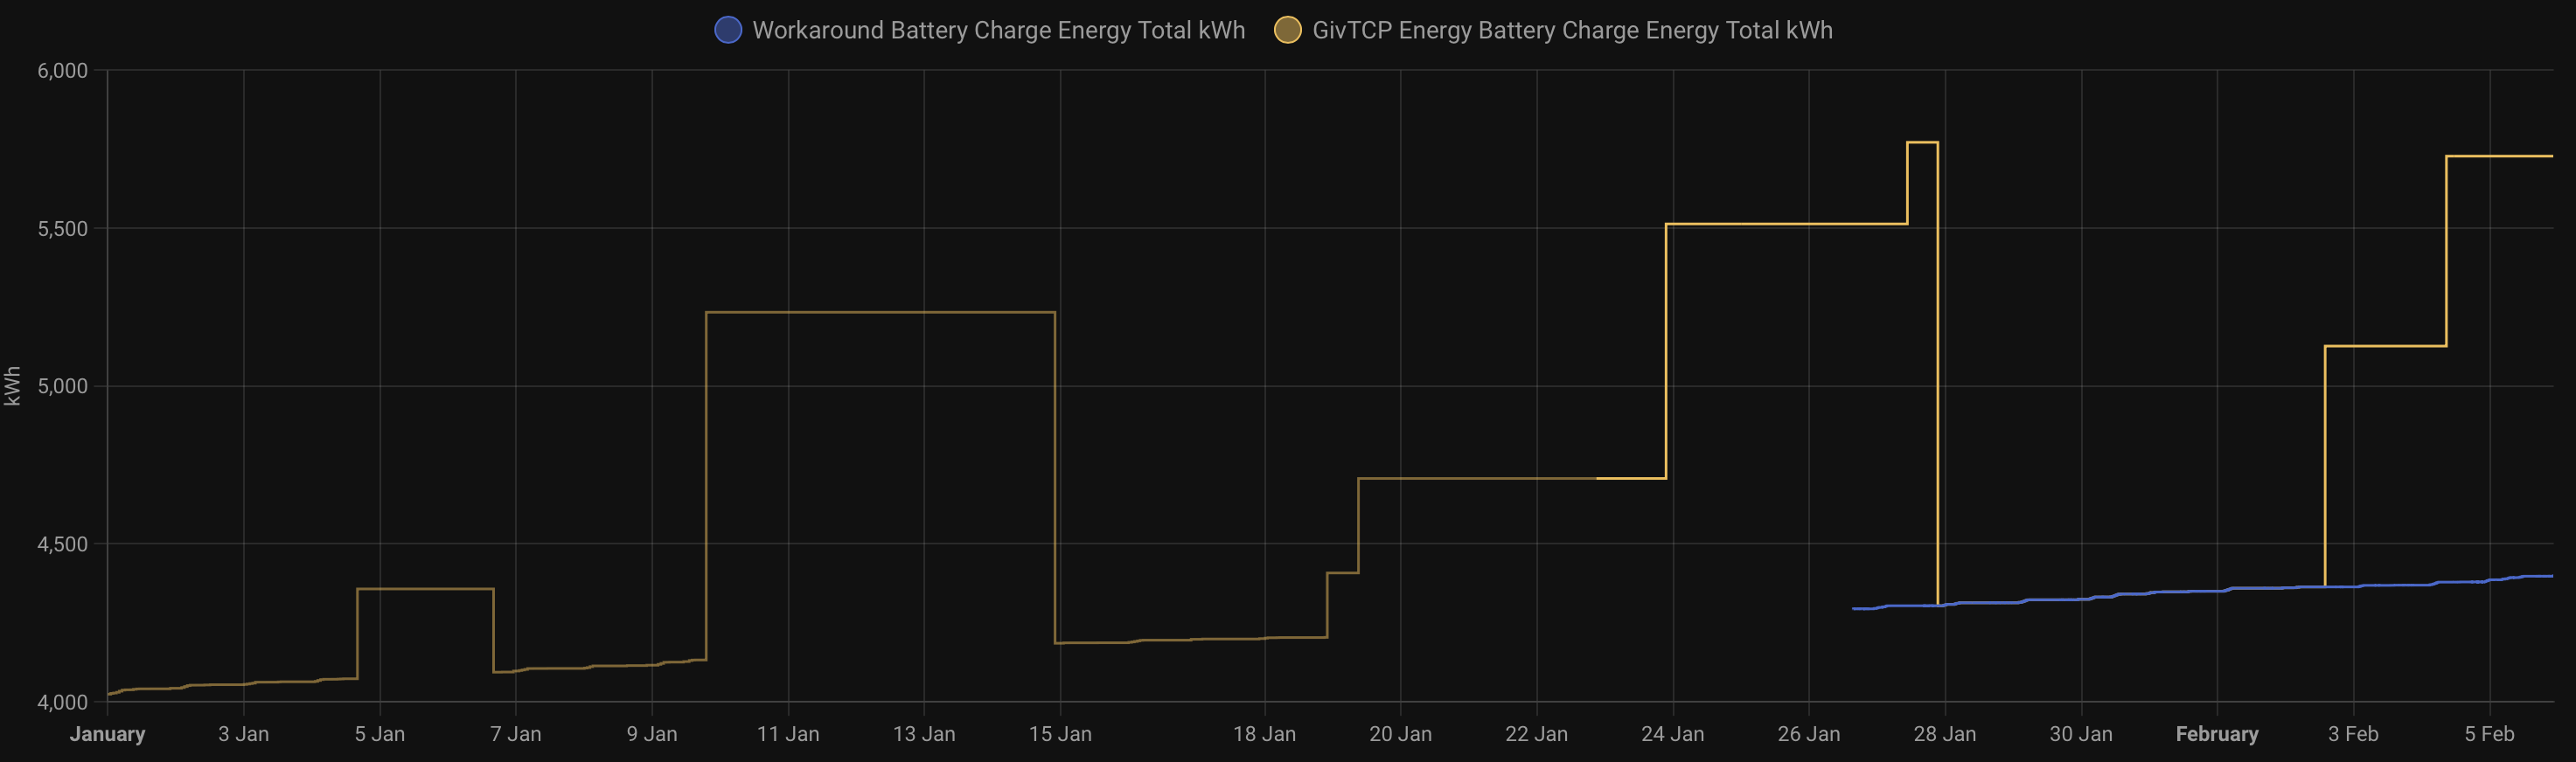
Turns out it's remarkably easy to get the data for this - turns out there's a "battery throughput" sensor, from which I can simply subtract the discharge sensor figure to get the charge figures.

Except, of course, this is HA... As far as I can make out, though this is easy to set up to calculate forwards from now, there is no possible way to backdate it so that my new helper includes the full history, despite both the sensors having a full history right there. (I'm sure I've whinged about this before, but I find HA the most frustrating platform I've ever tried to work in... moan over.)

Or am I missing something obvious...?

I've raised a ticket on GivTCP Github in the meantime.

G
#12 geoffreycoan

Josephiah Except, of course, this is HA... As far as I can make out, though this is easy to set up to calculate forwards from now, there is no possible way to backdate it so that my new helper includes the full history, despite both the sensors having a full history right there

There is a way to recreate the long term statistics for the Energy dashboard. I’m writing up how to do it at the moment. You can also use it to resolve the data jumps you are getting. Hold that thought…

I saw your defect https://github.com/britkat1980/giv_tcp/issues/338 be interesting to see what replies you get. Creating yet another template sensor doesn’t seem the right answer

J
#13 Josephiah

Look forward to seeing that, though I agree adding another sensor is only a workaround and doesn't remotely address the underlying issue, whatever that is.

Another random jump up today...

G
#14 geoffreycoan

Josephiah I'm getting there with the LTS process development and writeup.

So far I have completed the following scenarios:

  • extracting history data sensor and loading it into LTS
  • extracting history from the GivEnergy portal and loading it into LTS

The other processes I am thinking will be useful are:

  • extracting history from Octopus meter readings and loading into LTS (although TBH in most cases the GivEnergy portal import and export meter data is good enough)
  • extracting and moving data from one LTS sensor history to another

Any others you or others can think of needing to cover?

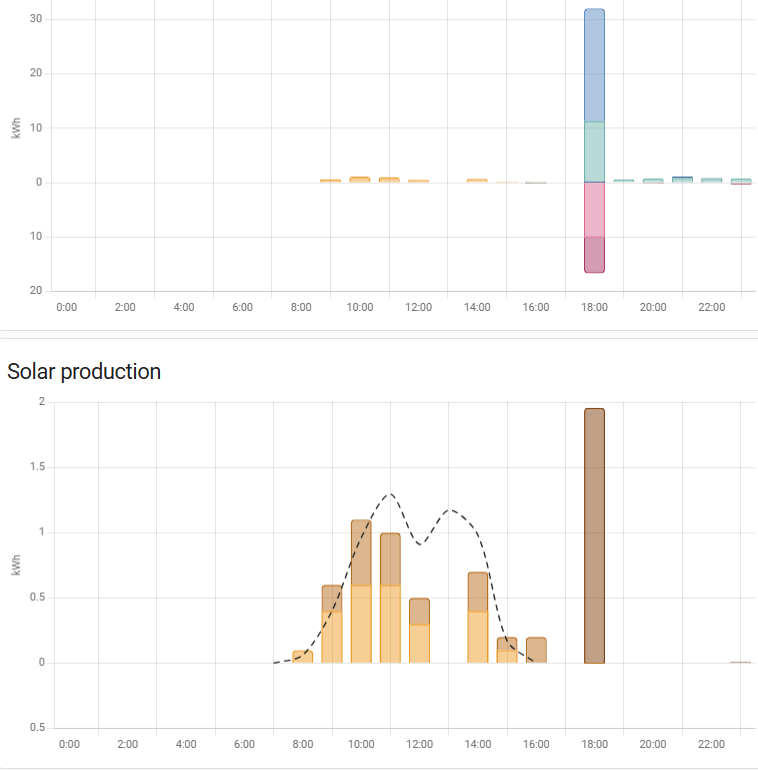
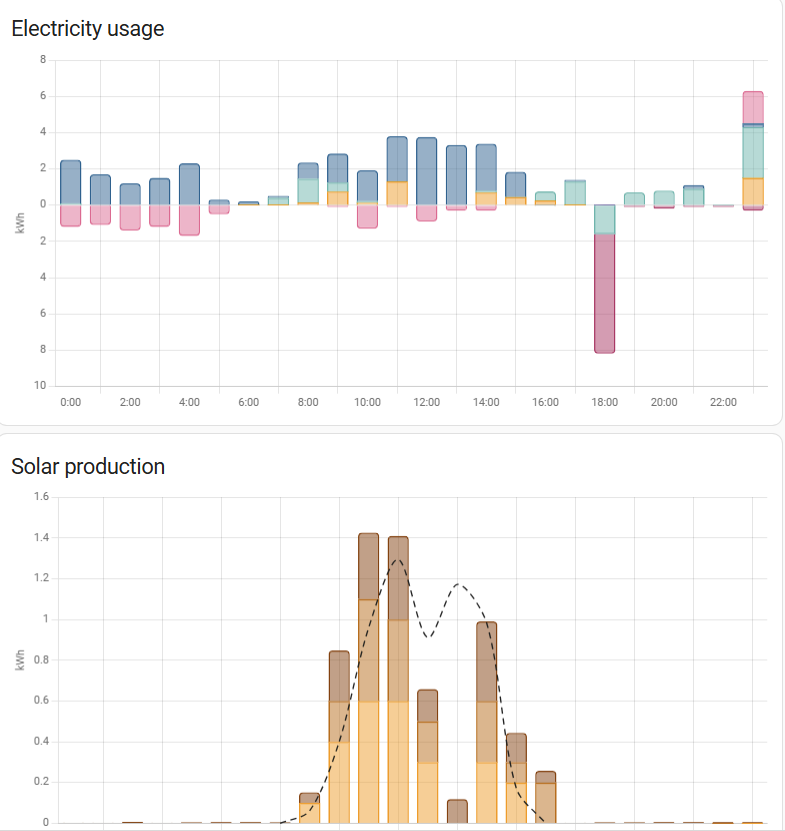
As a sneak preview of how well it works, here's my Energy dashboard for 20/1 when my stats collection broke (I manually filled in the hour by hour data for two of my arrays which is why the solar chart looks half-OK), but as you can see most of the daily data appears as a big spike:

And here is where it is so far, reloaded all 3 solar arrays, the import data and one inverter charge & discharge so just the other inverter charge & discharge to do (which is the big negative at 18:00)

And it was going so well, you may notice that on the right at 22:00 there's a "data blip" which I can't at the moment fix.
In short there's two counters that increment in LTS and after stats collection recovered they came back 2 kWh further apart than they were beforehand. Its like HA glitched. Bit like your glitches only a lot smaller.

Anyway, slogging away at this

J
#15 Josephiah

geoffreycoan (sorry if I'm being dumb...) what's LTS?

T
#16 TX200

Josephiah long term statistics. Stuff that's kept longer than the default 7-10 days.

G
#17 geoffreycoan

Josephiah As TX200 says, its Long Term Statistics

In Home Assistant there are 3 sets of data:

  • entities, full history of every state change for about 10 days before its purged
  • short term statistics, summarised state change information to every 5 minutes, kept for 2 weeks
  • long term statistics, hourly data snapshots, held forever

The Energy dashboard runs on long term statistics so getting that right is what powers the dashboard.

J
#18 Josephiah

TX200
geoffreycoan
Ah, of course, thanks.

And, just like that, we're back again... Nope, no idea.

J
#19 Josephiah

Josephiah Turns out it's remarkably easy to get the data for this - turns out there's a "battery throughput" sensor, from which I can simply subtract the discharge sensor figure to get the charge figures.

My new workaround sensor (throughput minus discharge) appears to work perfectly. Which makes the errors in the charge sensor all the weirder. I wonder if it's something as simple as a calculation overflow or something in the GivTCP calc...?

G
#20 geoffreycoan

Josephiah it could be. Don’t seem to be getting much response to github tickets raised on givtcp at the moment, not just yours, ones I have raised and ones that Trefor raised all appear unanswered

R
#21 Rubikcube

The code in GivTCP (file read.py) has changed.

Old code:

if GEInv.e_battery_charge_total==0 and GEInv.e_battery_discharge_total==0:        #If no values in "nomal" registers then grab from back up registers - for some f/w versions
                energy_total_output['Battery_Charge_Energy_Total_kWh']=GEBat[0].e_battery_charge_total_2
                energy_total_output['Battery_Discharge_Energy_Total_kWh']=GEBat[0].e_battery_discharge_total_2
            else:
                energy_total_output['Battery_Charge_Energy_Total_kWh']=GEInv.e_battery_charge_total
                energy_total_output['Battery_Discharge_Energy_Total_kWh']=GEInv.e_battery_discharge_total

New code:

#if GEInv.e_battery_charge_total == 0 and GEInv.e_battery_discharge_total == 0 and not GiV_Settings.numBatteries==0:  # If no values in "nomal" registers then grab from back up registers - for some f/w versions
            if len(GEBat)>0:
                if GEBat[0].e_battery_charge_total == 0 and GEBat[0].e_battery_discharge_total == 0:  # If no values in "nomal" registers then grab from back up registers - for some f/w versions
                    energy_total_output['Battery_Charge_Energy_Total_kWh'] = GEInv.e_battery_charge_total_2
                    energy_total_output['Battery_Discharge_Energy_Total_kWh'] = GEInv.e_battery_discharge_total_2
                else:
                    energy_total_output['Battery_Charge_Energy_Total_kWh'] = GEBat[0].e_battery_charge_total
                    energy_total_output['Battery_Discharge_Energy_Total_kWh'] = GEBat[0].e_battery_discharge_total

The new test looks backwards and makes no sense to me.

J
#22 Josephiah

Rubikcube I'm not sure I really get what this is for, or what it's doing, but the logic appears to be:

If a battery exists:
If Charge has zero reading AND Discharge has zero reading, get value from one place;
Else get them from a second place.

That AND logic seems a little odd to me though, as you might also want to do this action if there are zero readings in Charge OR Discharge?

But as I say, I don't really know what this is doing. @Rubikcube on your travels, did you spot anything about how whether the Charge/Discharge totals are calculated? Or are they just grabbed from the inverter registers as is?

EDIT: From a quick skim myself, it looks to me like it's just one of many properties read directly...

R
#23 Rubikcube

I don't use GivTCP and have no interest in debugging it. However I saw your graph and thought "How on earth is that possible?" Surely it's just reporting the contents of a register from the inverter, right? I like solving puzzles (clue is in the name) 🙂

As far as I can find there is no calculation.

Long, long ago, the inverters didn't record battery charge and discharge so the values were always zero. Given that you have a history of values, let's presume you have an inverter that does record the battery charge and discharge.

Looking at the old code, the values will never be zero and so the else clause will always give you the values from the inverter.

The new code references a list called GEBat. How this is set up and what it contains I do not know. When the list is empty, the code will be bypassed and the totals will remain constant. This is seen on your graph. When the list contains at least one entry, numbers from the first entry in the list will be used (no idea where these come from so could be just random), unless they both happen to be zero in which case you will get the real values from the inverter.

This explains the results you see. No calculation necessary, just random numbers and if statements.

There are no comments to explain the new code. I can't find any change control record. Why has it been changed? How can this have passed any testing?

My conclusion is that GivTCP will have to be continually updated to work with new equipment. Inadequate change control and testing means that GivTCP does not meet my criteria for reliability. This reinforces my decision to avoid GivTCP at the present time.

J
#24 Josephiah

Rubikcube However I saw your graph and thought "How on earth is that possible?"

Likewise!

Rubikcube My conclusion is that GivTCP will have to be continually updated to work with new equipment. Inadequate change control and testing...

Yeah... welcome to the world of smart homes I guess. Unless one buys entirely into one unified product ecosystem (if one even existed, and even then, the customers would still be the test pool...), we're inevitably going to be stuck with a hideous dependency tree of hobbyists and tinkerers.

V
#25 Vestas

Josephiah If you buy into any ecosystem you run the risk of the manufacturer binning the whole thing or enshittifying it beyond recognition - Google and Hive products spring immediately to mind.

Better off with a bit of hassle rather than being 100% dependent on one company.

#26 hoggy

Just a reminder that GivTCP is entirely community produced. Its essentially 1 guy, unfunded in his spare time, not Givenergy produced code/framework or the modbus library it runs on. So it will obviously be hindered as the author won't necessarily know what's coming next or how it works/going to work.

J
#27 Josephiah

Vestas Agreed.

hoggy Absolutely. Was a criticism of the landscape we find ourselves in; certainly wasn't my intention to denigrate the much-appreciated voluntary work of the clever folks we benefit from so much! (Though I appreciate my "hobbyists and tinkerers" levity could be construed as such - was not an insult in my view - I am one!)