Agile Price Prediction

40 comments started 2024-12-24 last 2025-01-16
Home AutomationHome Assistant
G
#1 geoffreycoan

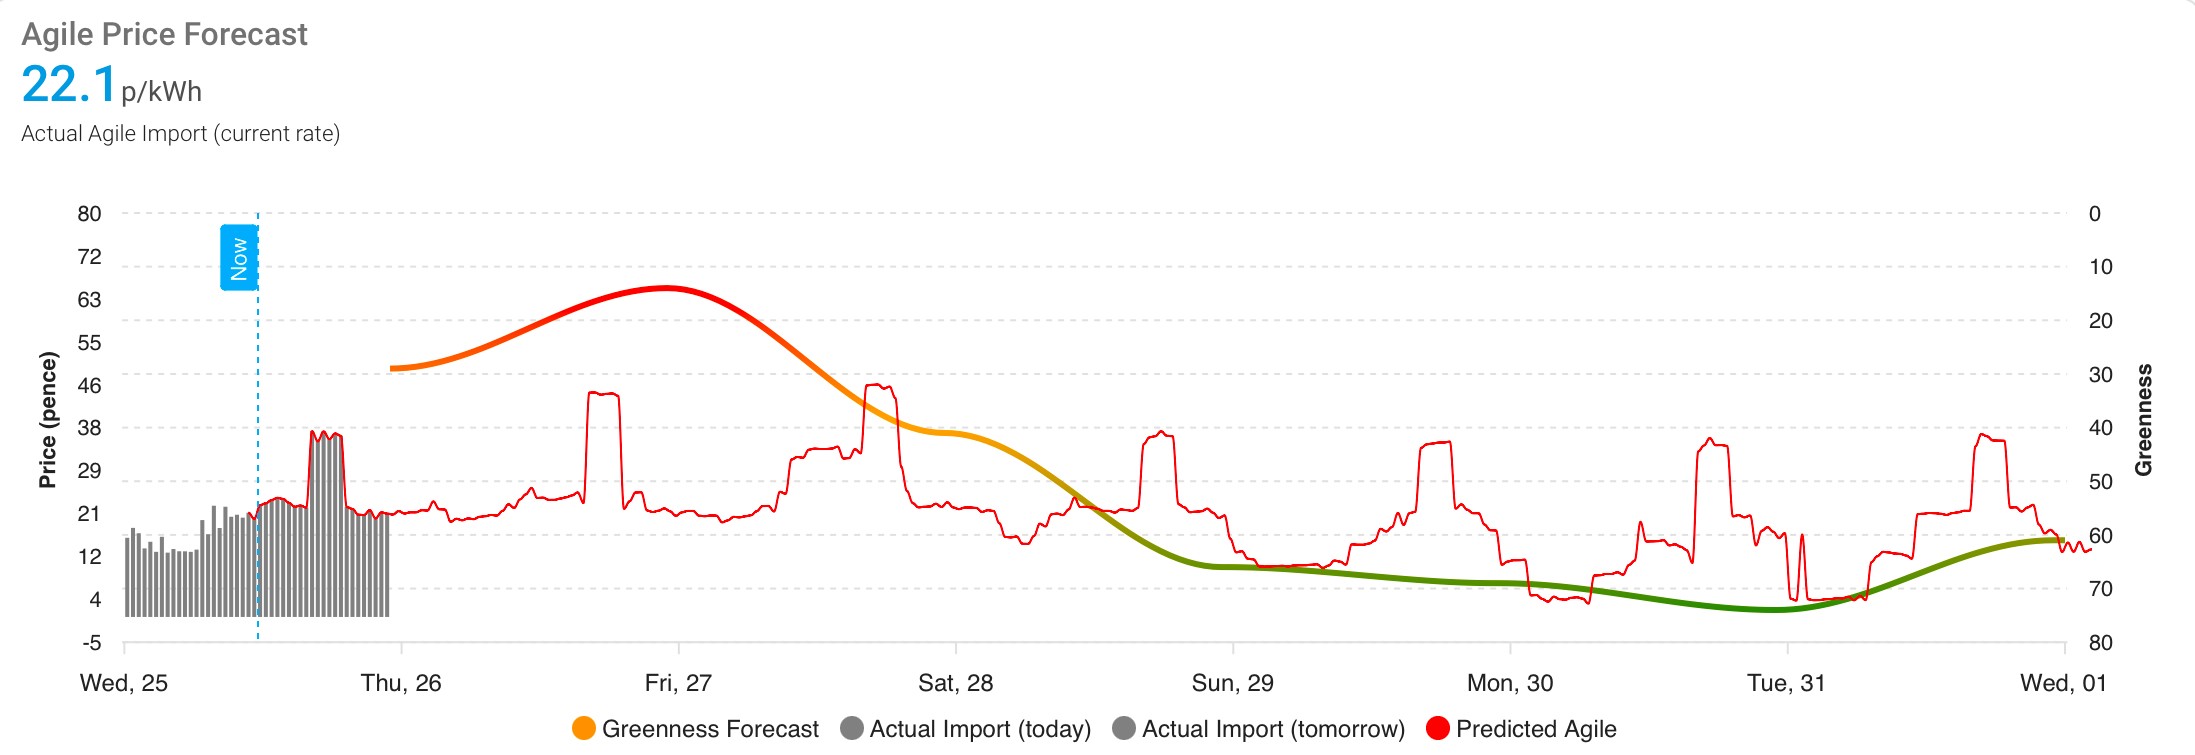
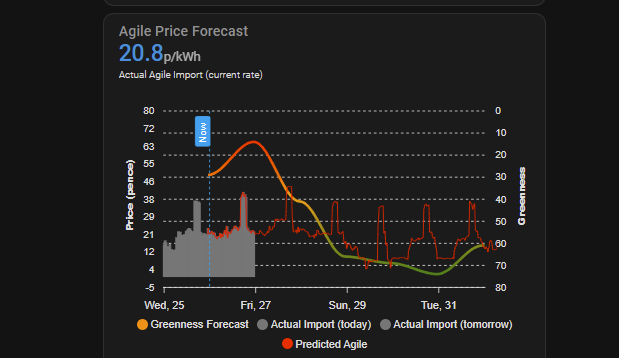
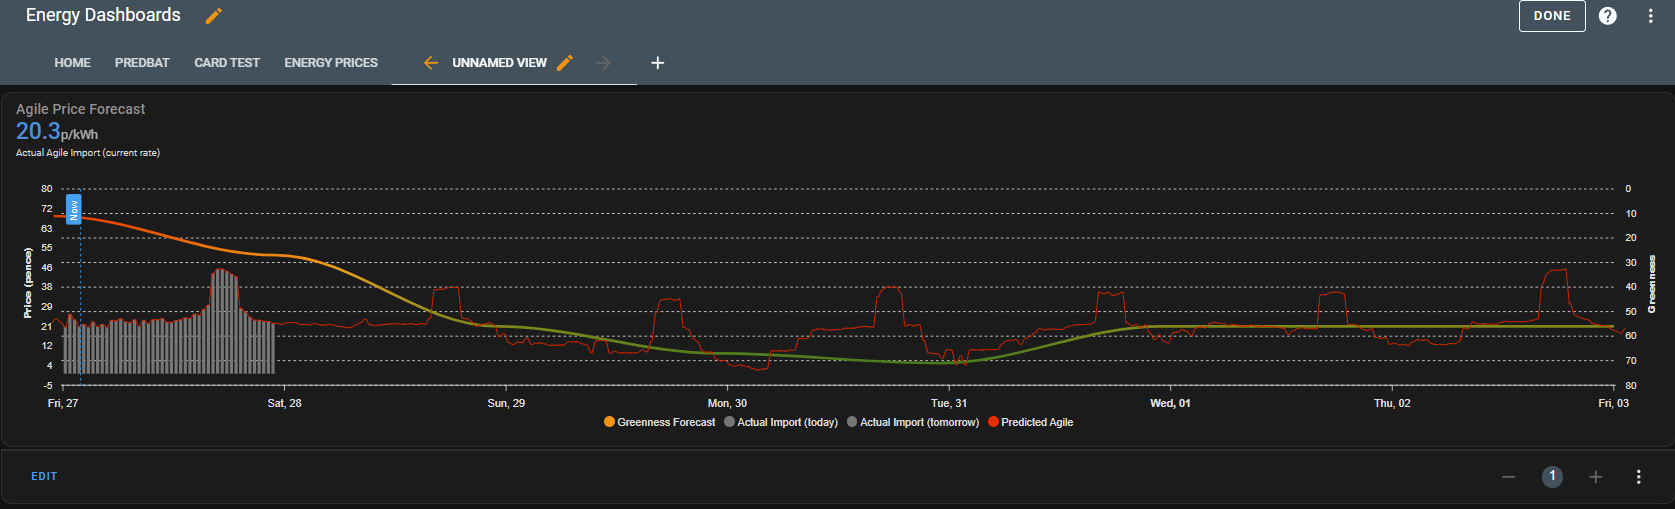
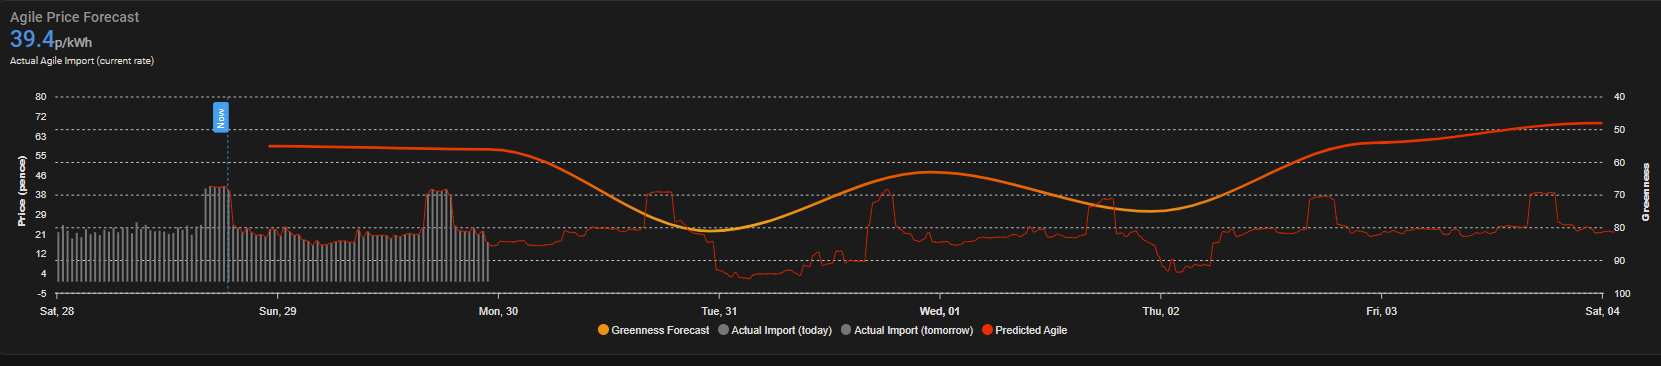
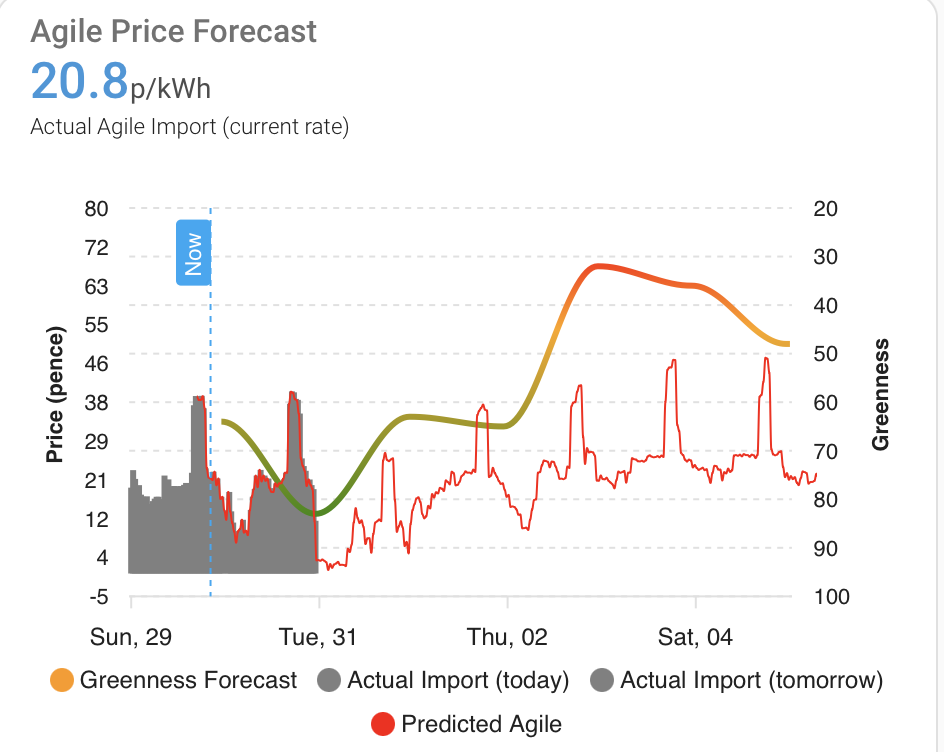
An early Christmas present for those on Octopus Agile, a dashboard graph of future predicted Octopus Agile prices that I find quite useful.

This has been shared before but it was buried in another discussion topic so as I had been improving the graph today I thought I’d share what I have created.
The graph shows 3 things:

  • Today and Tomorrow’s confirmed Agile prices from the Octopus Energy integration
  • Octopus Agile price prediction for the next week
  • Octopus “Greenness forecast”

The price prediction is obvious, the Greenness forecast needs a bit of explanation, its a daily forecast of how green the grid will be overnight that day, the higher the score the greener the grid and most most likely the cheaper the Agile prices. Note that it is only a single score per night, not more granular than that
https://octopus.energy/smart/greener-days/

Setup details:

  1. Add the following to your HA configuration.yaml:
 sensor:
 # Predicted Agile prices
  - platform: rest
    name: Octopus Agile Predict
    unique_id: octopus_agile_predict
    resource: https://prices.fly.dev/api/A
    scan_interval: 3600
    value_template: "{{ value_json[0]['name']}}"
    json_attributes_path: "$[0]"
    json_attributes:
      - "created_at"
      - "prices"

The Agile price prediction is provided by https://prices.fly.dev/ - simply change the trailing ‘A’ in the “resource” URL above to match the region code you are in https://energy-stats.uk/dno-region-codes-explained/

The price prediction is sensor.octopus_agile_predict and is automatically retrieved hourly.

  1. Enable the Greenness sensor in the Octopus Integration
    https://bottlecapdave.github.io/HomeAssistant-OctopusEnergy/entities/greenness_forecast/

The sensor is named sensor.octopus_energy{{ACCOUNT_ID}}greenness_forecast_current_index and is automatically populated by the integration.

  1. Add the following Apex chart configuration to a dashboard, setting AAAA to your Octopus account id, XXXX and YYYY to your meter serial and MPAN:
- type: custom:apexcharts-card
  experimental:
    color_threshold: true
  apex_config:
    chart:
      height: 300px
    xaxis:
      labels:
        format: ddd, dd
  header:
    title: Agile Price Forecast
    show: true
    show_states: true
    colorize_states: true
  graph_span: 7d
  now:
    show: true
    label: Now
  yaxis:
    - id: price
      decimals: 0
      min: -5
      max: 80
      apex_config:
        tickAmount: 10
    - id: greenness
      opposite: true
      decimals: 0
      align_to: 20
      apex_config:
        step_size: 20
        reversed: true
  stacked: false
  span:
    start: day
  series:
    - entity: sensor.octopus_energy_AAAA_greenness_forecast_current_index
      name: Greenness Forecast
      show:
        in_header: false
        legend_value: false
      stroke_width: 3
      color_threshold:
        - value: 0
          color: green
        - value: 50
          color: orange
        - value: 80
          color: red
      yaxis_id: greenness
      data_generator: |
        return entity.attributes.forecast.slice(0, 7).map((entry) => {
        return [new Date(entry.start), entry.greenness_score];
          });
    - entity: >-
        sensor.octopus_energy_electricity_XXXX_YYYY_current_rate
      name: Actual Agile Import (current rate)
      transform: return x * 100;
      show:
        in_chart: false
      unit: p/kWh
    - entity: >-
        event.octopus_energy_electricity_XXXX_YYYY_current_day_rates
      yaxis_id: price
      name: Actual Import (today)
      color: grey
      opacity: 1
      stroke_width: 2
      extend_to: now
      type: column
      unit: p/kWh
      data_generator: |
        return entity.attributes.rates.map((entry) => {
           return [new Date(entry.start), entry.value_inc_vat*100];
         });     
      offset: '-15min'
      show:
        in_header: false
        legend_value: false
        offset_in_name: false
    - entity: >-
        event.octopus_energy_electricity_XXXX_YYYY_next_day_rates
      yaxis_id: price
      name: Actual Import (tomorrow)
      color: grey
      opacity: 0.3
      stroke_width: 2
      type: column
      unit: p/kWh
      data_generator: |
        return entity.attributes.rates.map((entry) => {
           return [new Date(entry.start), entry.value_inc_vat*100];
         });     
      offset: '-15min'
      show:
        in_header: false
        legend_value: false
        offset_in_name: false
    - entity: sensor.octopus_agile_predict
      yaxis_id: price
      name: Predicted Agile
      color: red
      opacity: 1
      stroke_width: 1
      extend_to: now
      unit: p/kWh
      data_generator: |
        return entity.attributes.prices.map((entry) => {
           return [new Date(entry.date_time), entry.agile_pred];
         });     
      offset: '-15min'
      show:
        in_header: false
        legend_value: false
        offset_in_name: false

I have another Christmas present to share, but that’ll have to wait for another day
R
#2 Rbor

Brillant!

PS: I think you have a stray '-' before the top 'type' line.

The hardest bit was getting the sensor and event lines correct.
Despite me copying the codes in from my Octopus account, the chart refused to recognise them.
I finished off finding the entities in the Octopus Energy integration and copying them in one by one.

Thanks so much for this. You spoil us all with your expertise and advice.

Have a great Xmas and New Year 🌲🍺🐇

Rob

G
#3 geoffreycoan

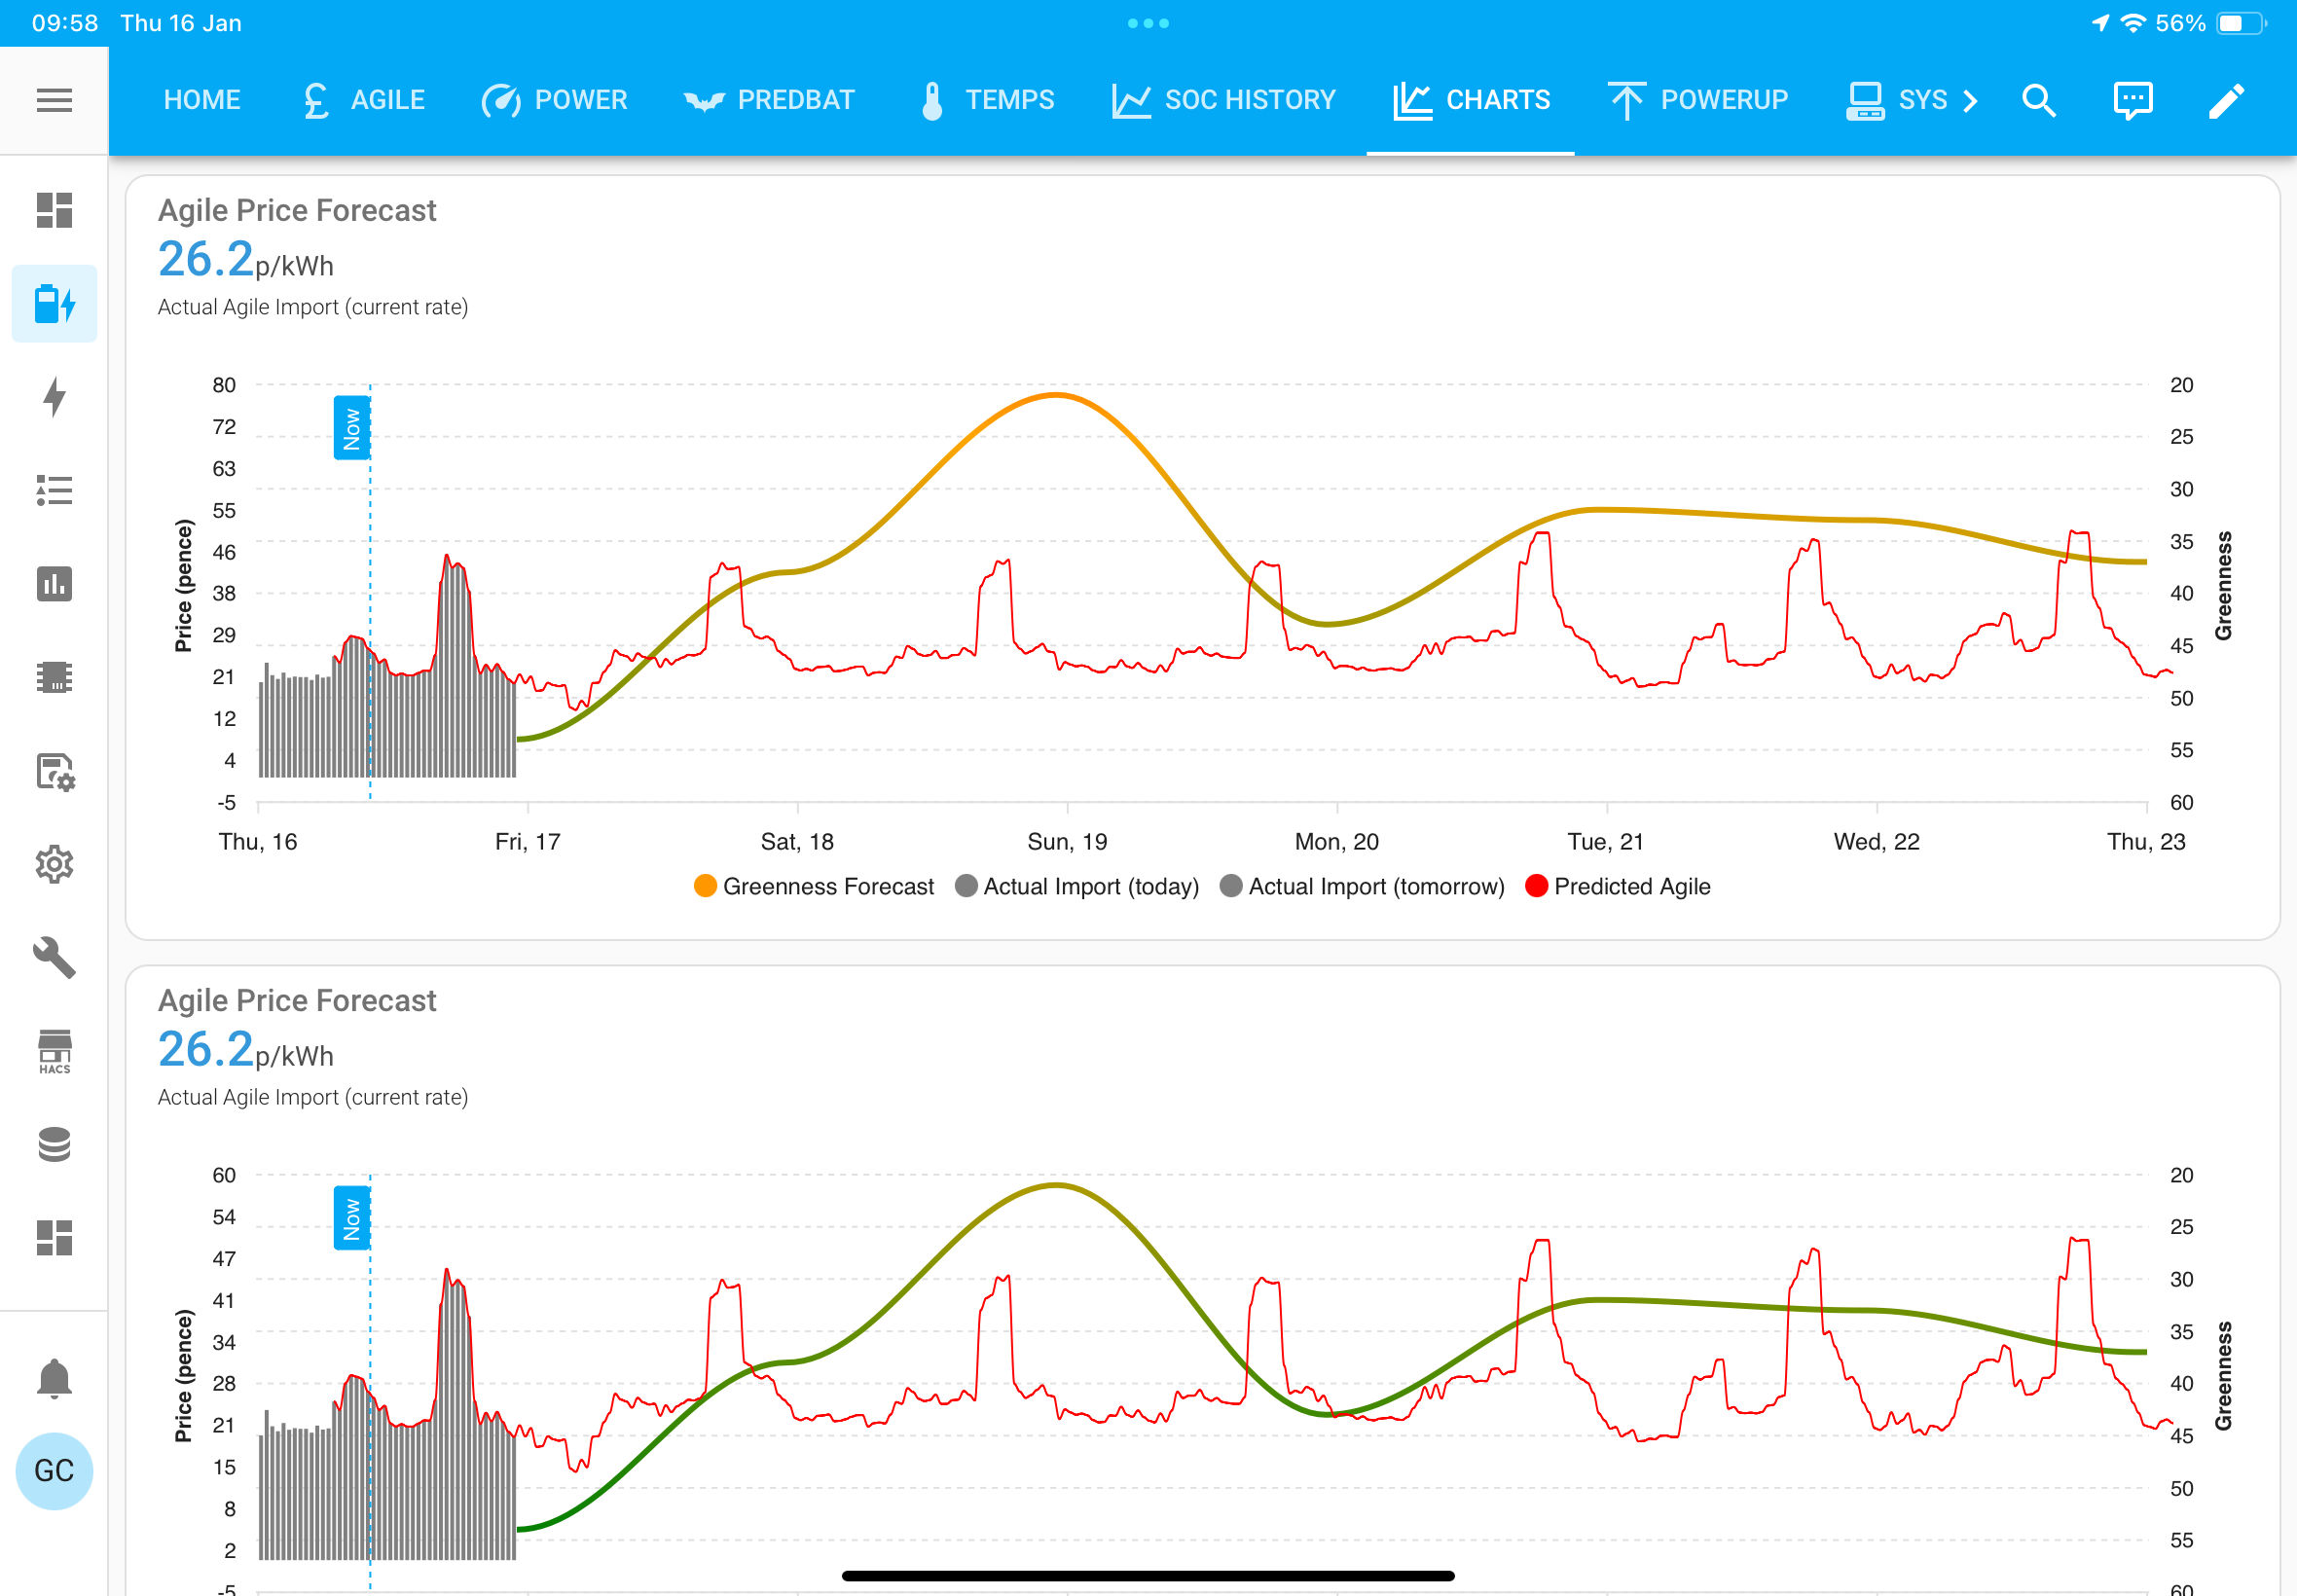
Whilst keeping away from the Christmas dinner preparation (wife and mother-in-law, no room for me), I was fiddling with the chart to add titles. Always useful to read the full Apex chart documentation https://apexcharts.com/docs/options/yaxis/

Revised chart now with titles and the extra ‘-‘ and indentation corrected:

type: custom:apexcharts-card
experimental:
  color_threshold: true
apex_config:
  chart:
    height: 300px
  xaxis:
    labels:
      format: ddd, dd
header:
  title: Agile Price Forecast
  show: true
  show_states: true
  colorize_states: true
graph_span: 7d
now:
  show: true
  label: Now
yaxis:
  - id: price
    decimals: 0
    min: -5
    max: 80
    apex_config:
      tickAmount: 10
      title:
        text: Price (pence)
        rotate: -90
  - id: greenness
    opposite: true
    decimals: 0
    align_to: 20
    apex_config:
      step_size: 20
      reversed: true
      title:
        text: Greenness
        rotate: 90
stacked: false
span:
  start: day
series:
  - entity: sensor.octopus_energy_AAAA_greenness_forecast_current_index
    name: Greenness Forecast
    show:
      in_header: false
      legend_value: false
    stroke_width: 3
    color_threshold:
      - value: 0
        color: green
      - value: 50
        color: orange
      - value: 80
        color: red
    yaxis_id: greenness
    data_generator: |
      return entity.attributes.forecast.slice(0, 7).map((entry) => {
      return [new Date(entry.start), entry.greenness_score];
        });
  - entity: >-
      sensor.octopus_energy_electricity_XXXX_YYYY_current_rate
    name: Actual Agile Import (current rate)
    transform: return x * 100;
    show:
      in_chart: false
    unit: p/kWh
  - entity: >-
      event.octopus_energy_electricity_XXXX_YYYY_current_day_rates
    yaxis_id: price
    name: Actual Import (today)
    color: grey
    opacity: 1
    stroke_width: 2
    extend_to: now
    type: column
    unit: p/kWh
    data_generator: |
      return entity.attributes.rates.map((entry) => {
         return [new Date(entry.start), entry.value_inc_vat*100];
       });     
    offset: '-15min'
    show:
      in_header: false
      legend_value: false
      offset_in_name: false
  - entity: >-
      event.octopus_energy_electricity_XXXX_YYYY_next_day_rates
    yaxis_id: price
    name: Actual Import (tomorrow)
    color: grey
    opacity: 0.3
    stroke_width: 2
    type: column
    unit: p/kWh
    data_generator: |
      return entity.attributes.rates.map((entry) => {
         return [new Date(entry.start), entry.value_inc_vat*100];
       });     
    offset: '-15min'
    show:
      in_header: false
      legend_value: false
      offset_in_name: false
  - entity: sensor.octopus_agile_predict
    yaxis_id: price
    name: Predicted Agile
    color: red
    opacity: 1
    stroke_width: 1
    extend_to: now
    unit: p/kWh
    data_generator: |
      return entity.attributes.prices.map((entry) => {
         return [new Date(entry.date_time), entry.agile_pred];
       });     
    offset: '-15min'
    show:
      in_header: false
      legend_value: false
      offset_in_name: false

The only change from the original version is the ‘title’ and subsequent 2 rows within each apex_config section

R
#4 Rbor

Thanks.
Your tweaked chart works for me and the added axes labels are a good addition.

Rob

L
#5 Leeshore

geoffreycoan I did this myself independently and was going to post tomorrow feeling smart. But alas too late☹️

J
#6 Jellybaby

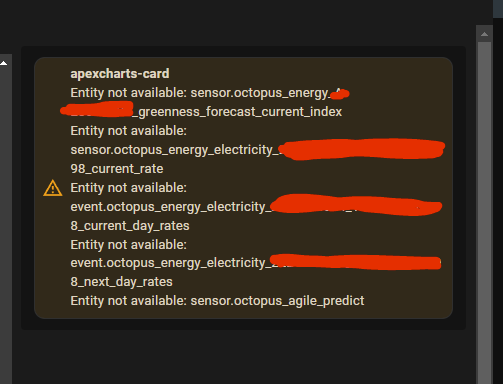
I have to be doing something really wrong because im getting nothing but errors, I did turn on the right one yeah?

I think I done the mpan and serial number right, the serial number is like "** L *******" and the MPAN from google search is the bit next to supply number box on bill.

T
#7 TX200

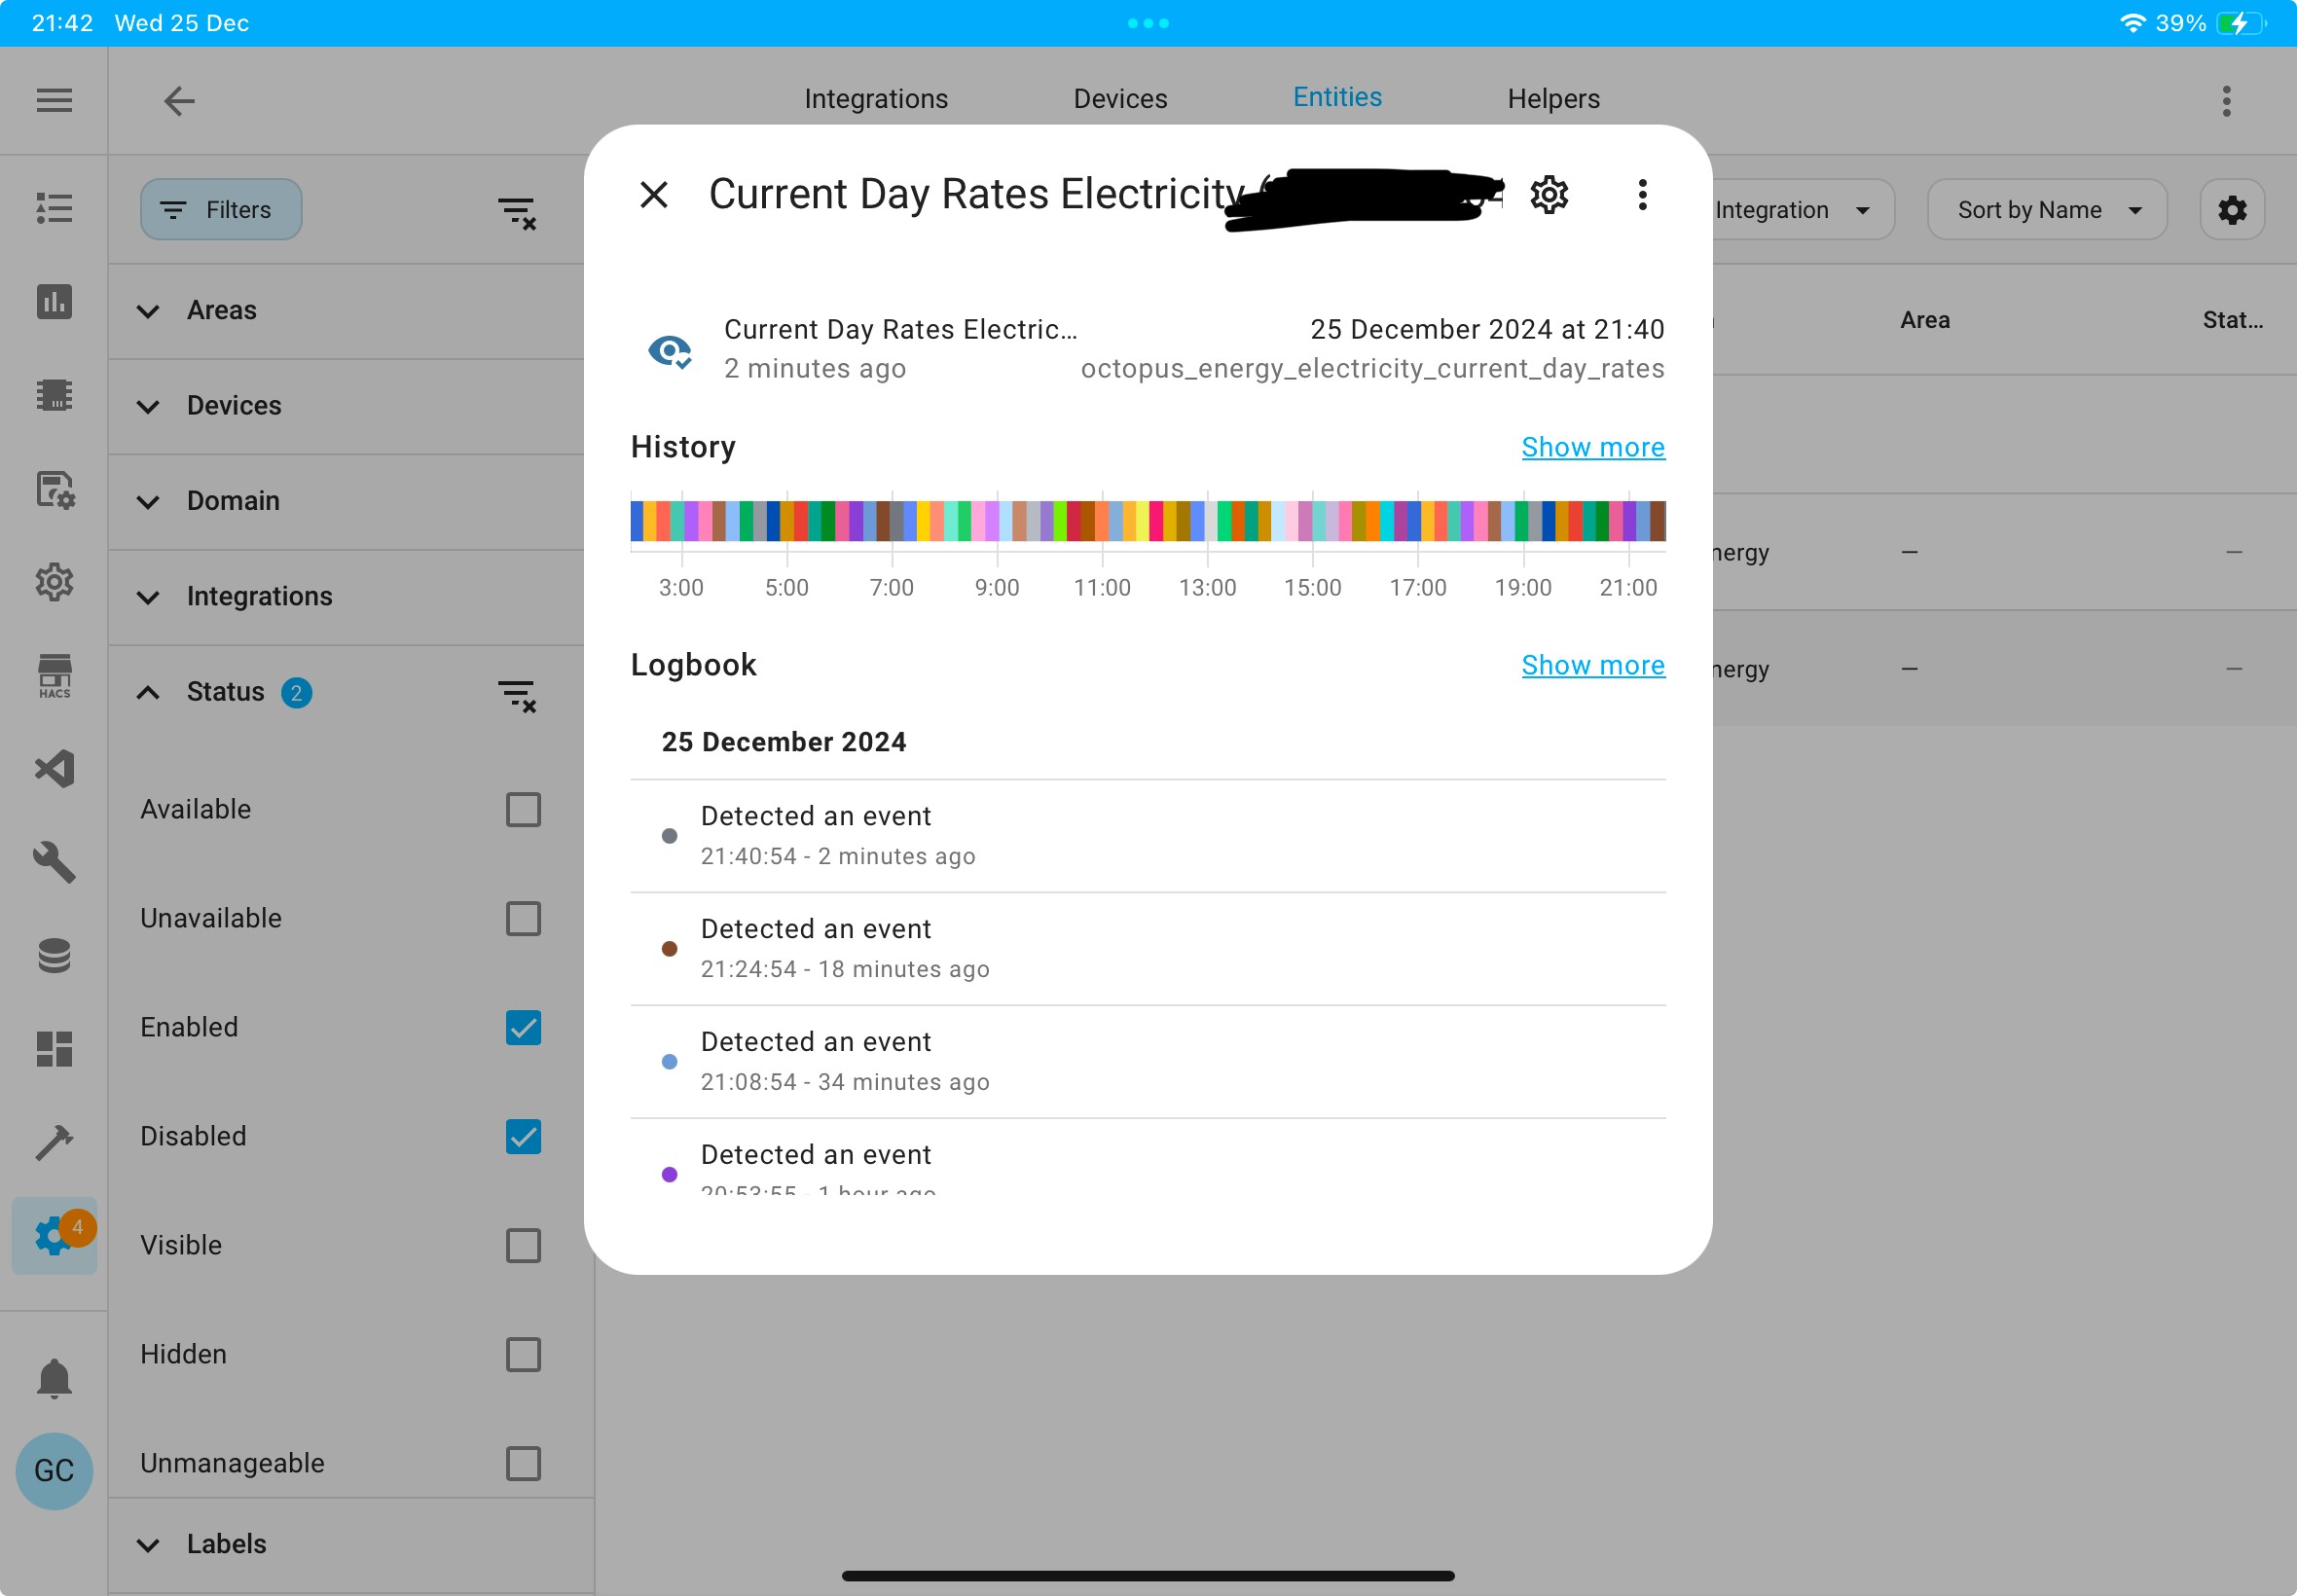
Did you enable these events in the octopus integration?

J
#8 Jellybaby

TX200 How do you mean, I enabled the one mentioned as show in the screenshot

Edit
I enabled all the ones shown in the above image.

G
#9 geoffreycoan

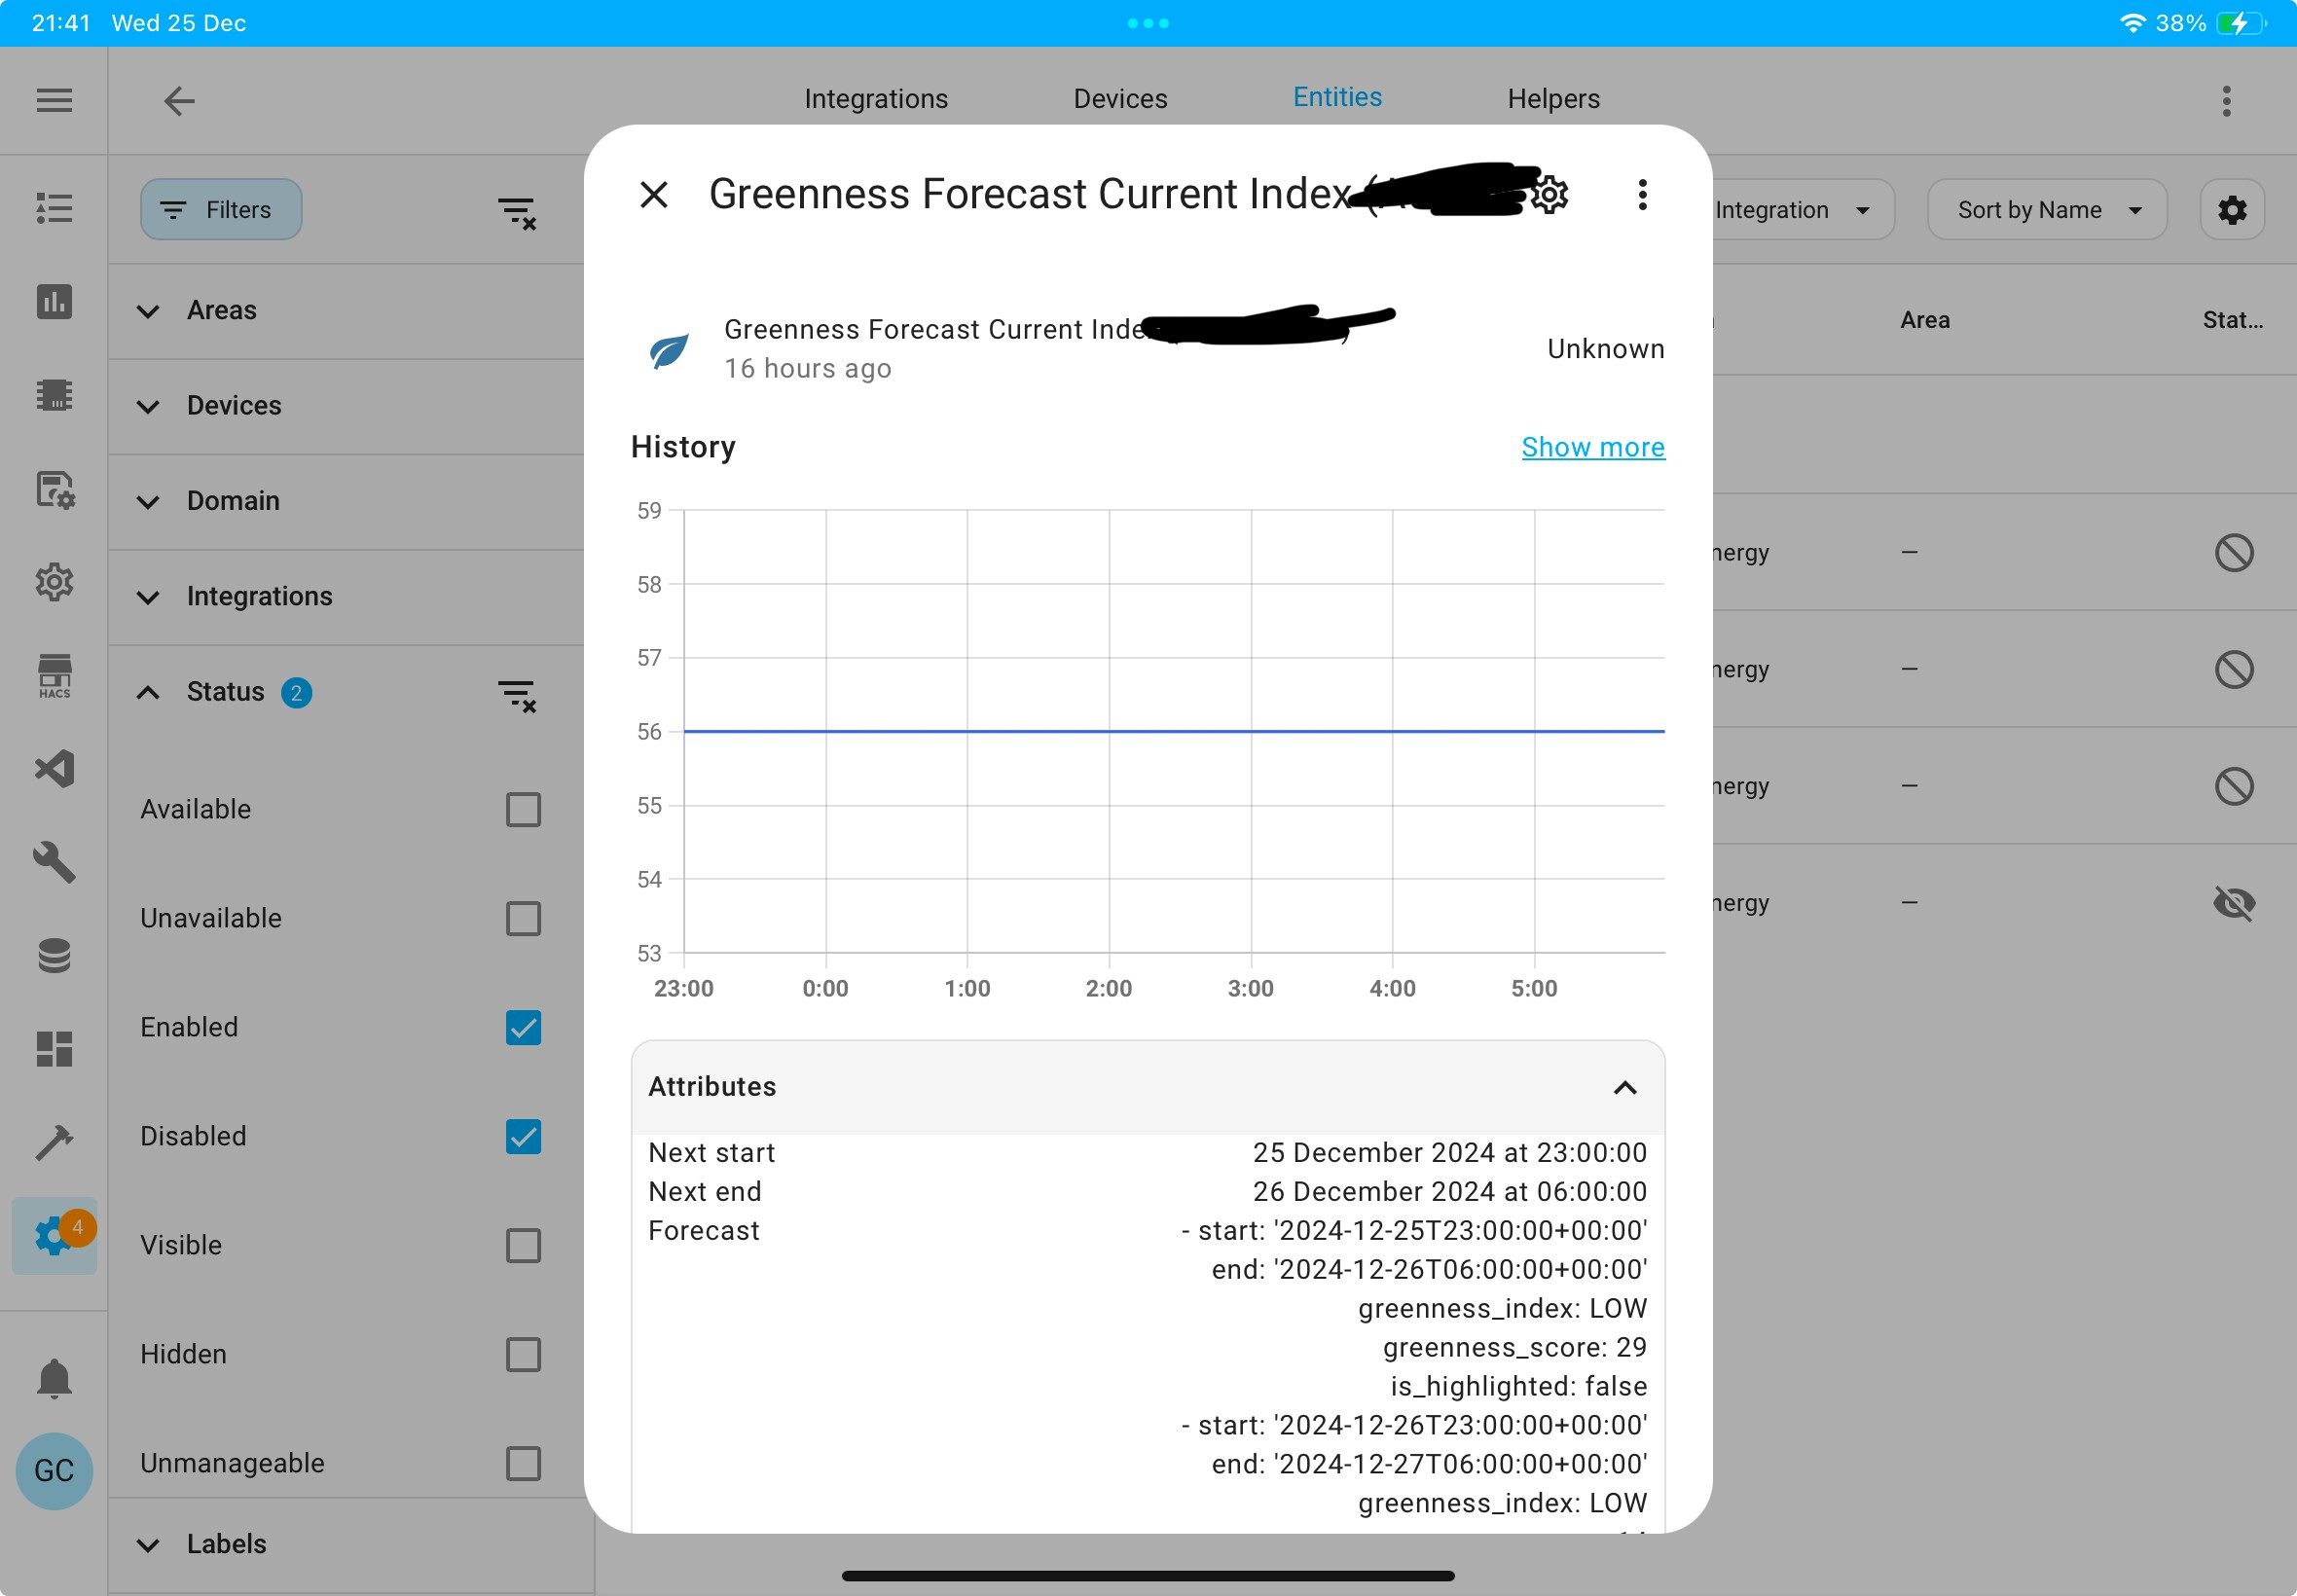
Jellybaby yes its ‘greenness forecast current index’

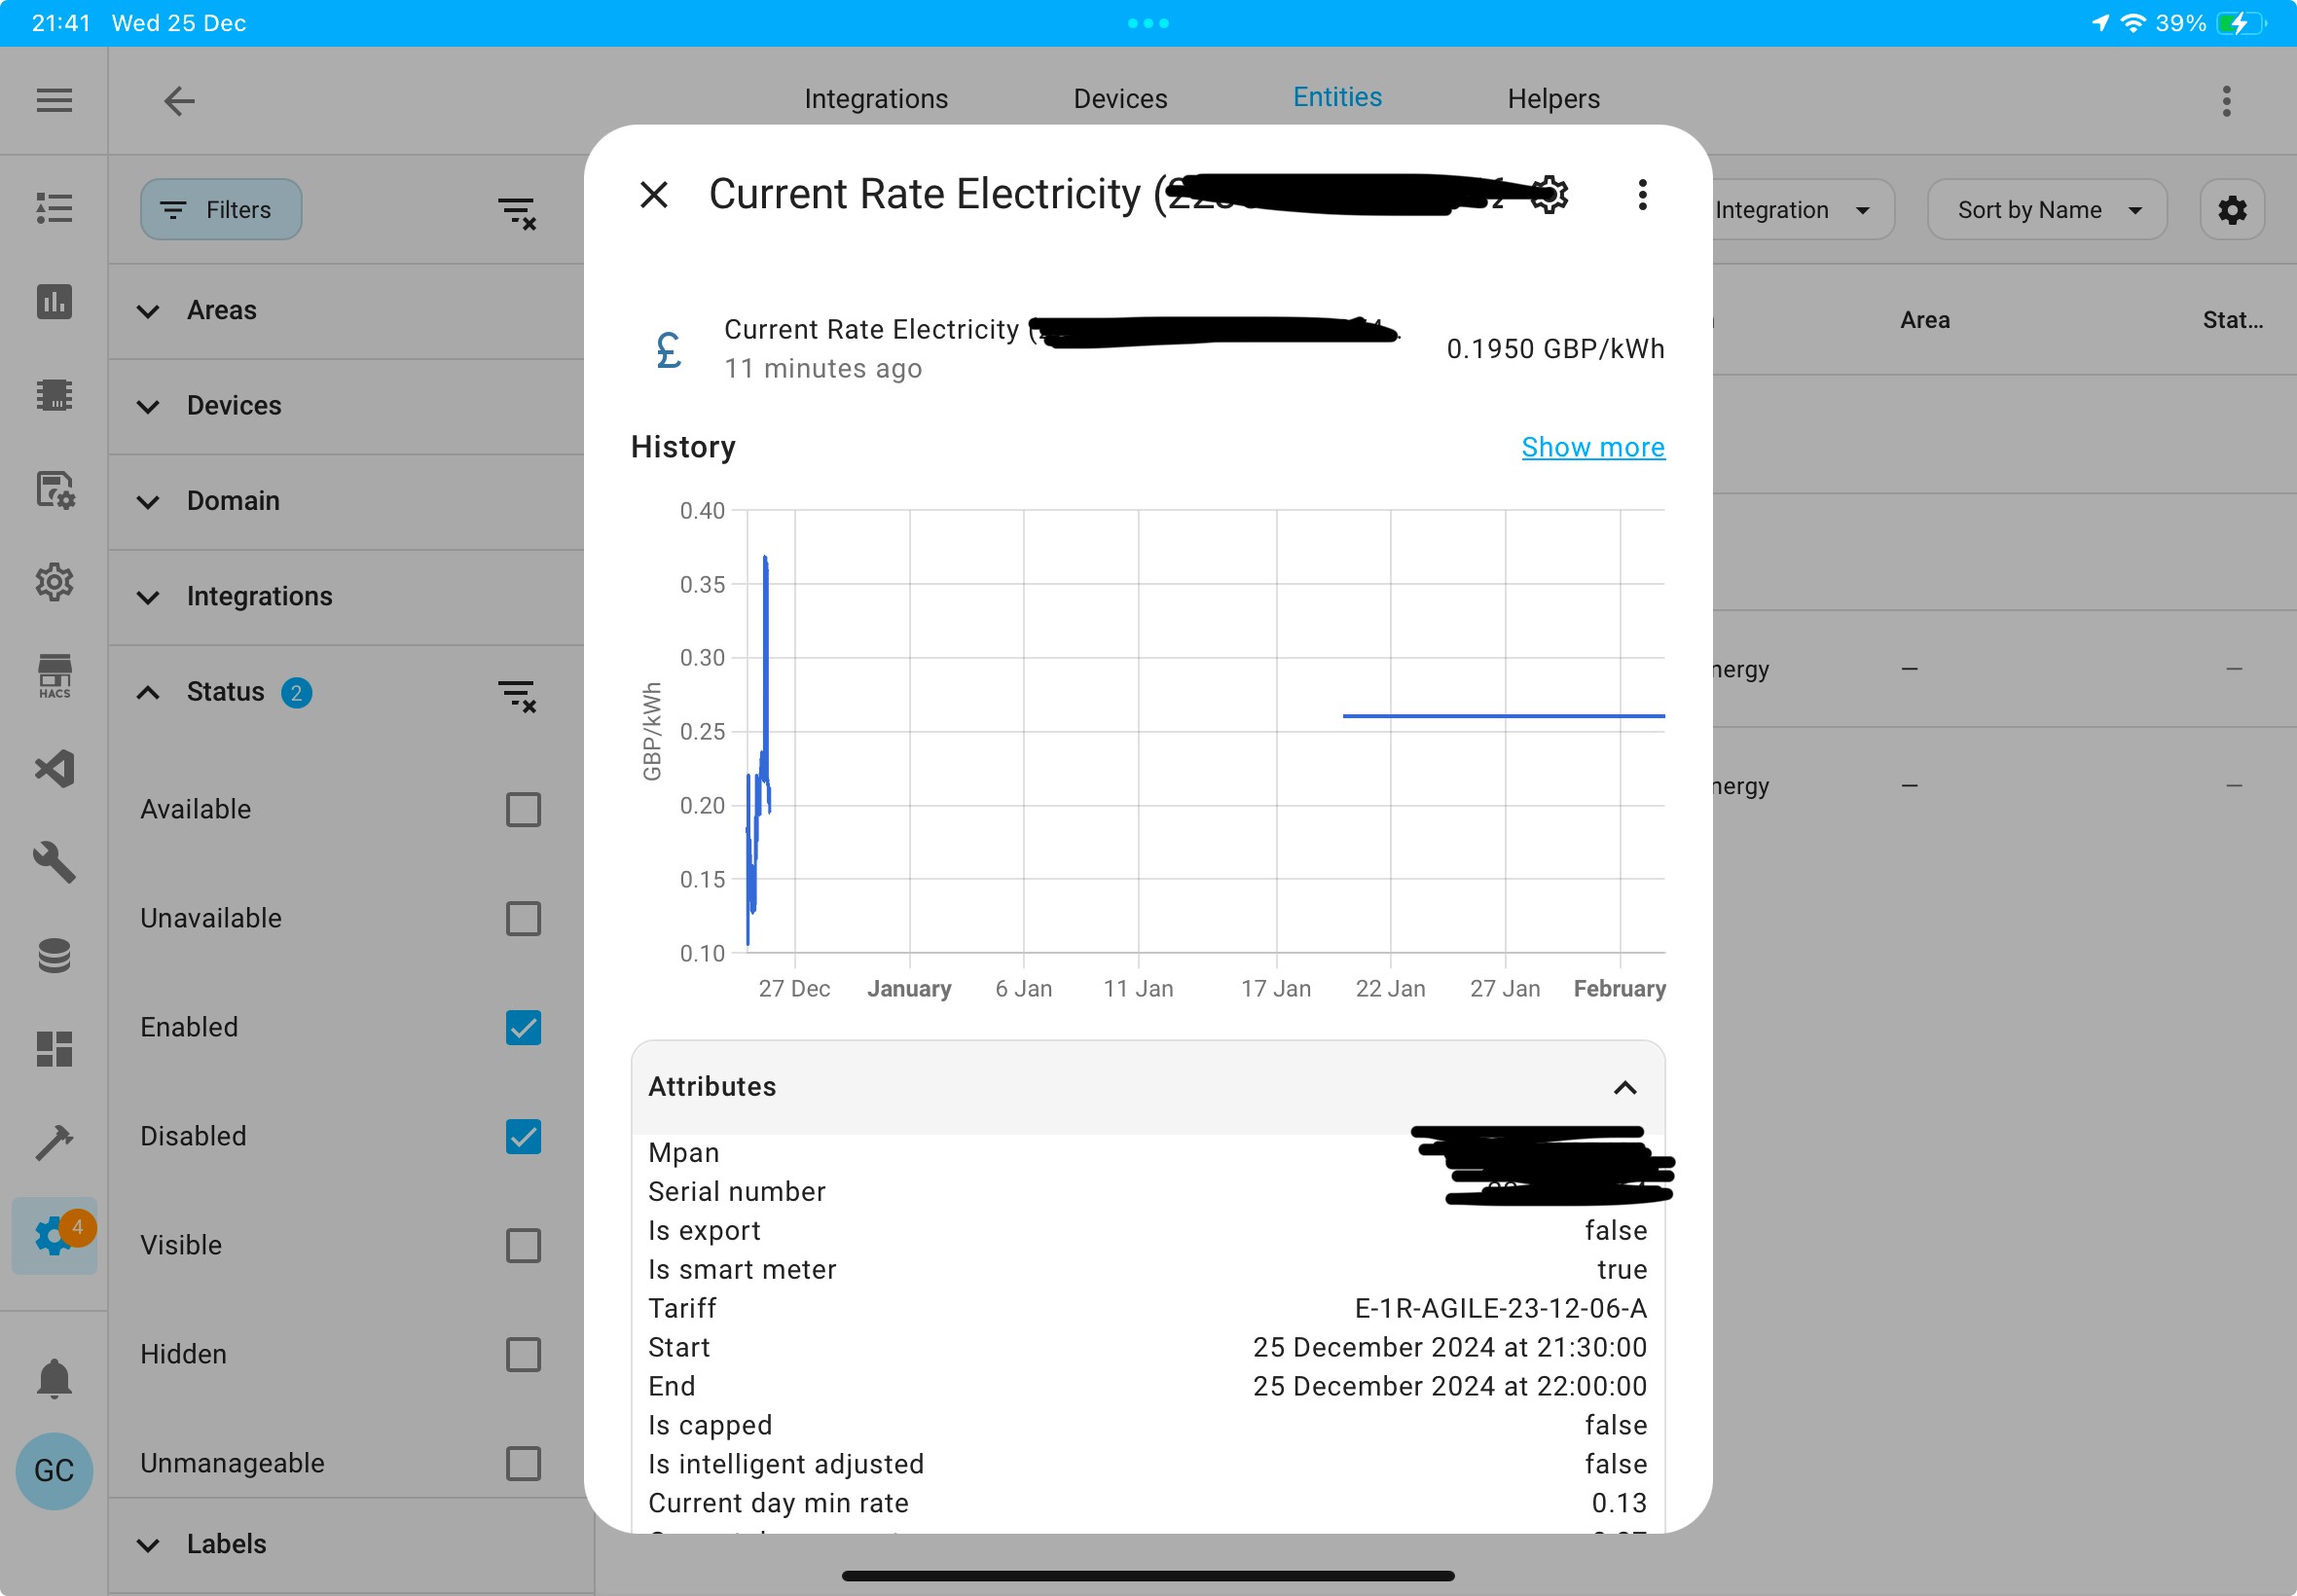
Did you just enable these events & sensor in the Octopus integration? It might be that you have to give it half an hour or so to download the data as the sensors are polled on a frequency to reduce load on the Octopus servers. Looking at my sensors it looks like the greenness might be daily and the others are every 15 minutes

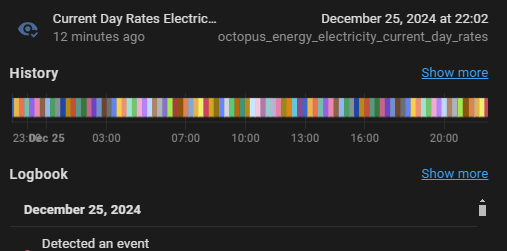
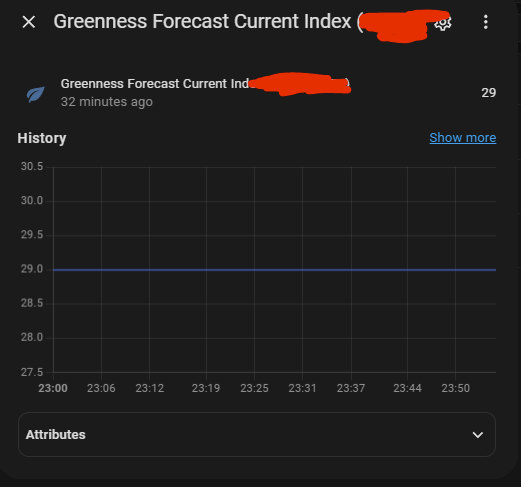
You should see data on all of these in the entities view, e.g.:


J
#10 Jellybaby

geoffreycoan ah I see, ill wait and see what happens, I thought something would pop up straight away but as of yet it is unchanged


G
#11 geoffreycoan

Jellybaby Curious that you have the greenness attributes but not the sensor value.

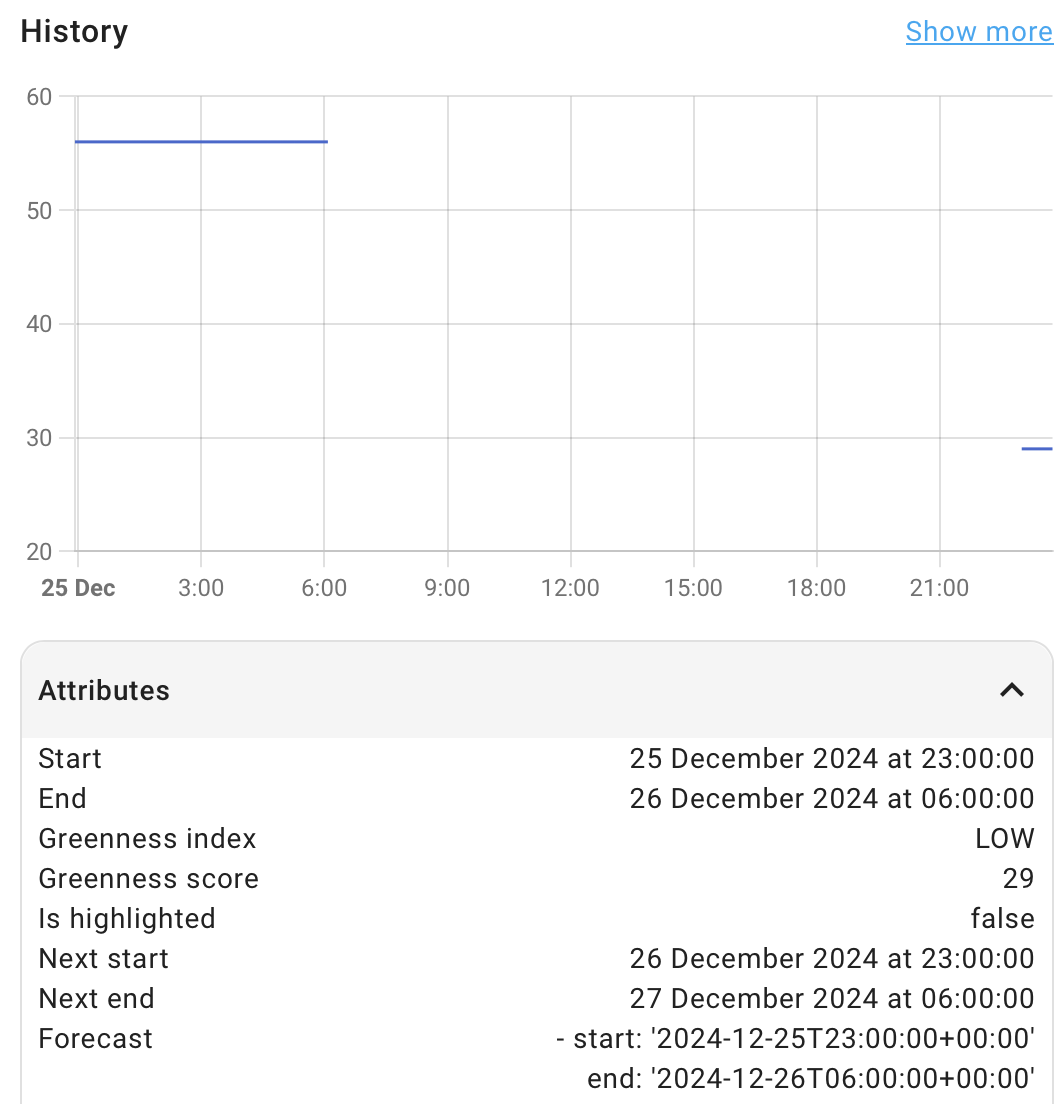
Looking at mine it looks like it updates at 23:00 every night so not long to wait 🎄🎅

J
#12 Jellybaby

geoffreycoan yeah ill see what happens in 16m

J
#13 Jellybaby

Still no luck 🙁
EDIT
Ok, apparently it doesn't like capital letters -_-

How did you get yours so wide?

J
#15 Jellybaby

geoffreycoan it works now, had to change the L in the meter serial to an "l", had to be lower case, same with the account number but its not as wide as yours

R
#16 Rbor

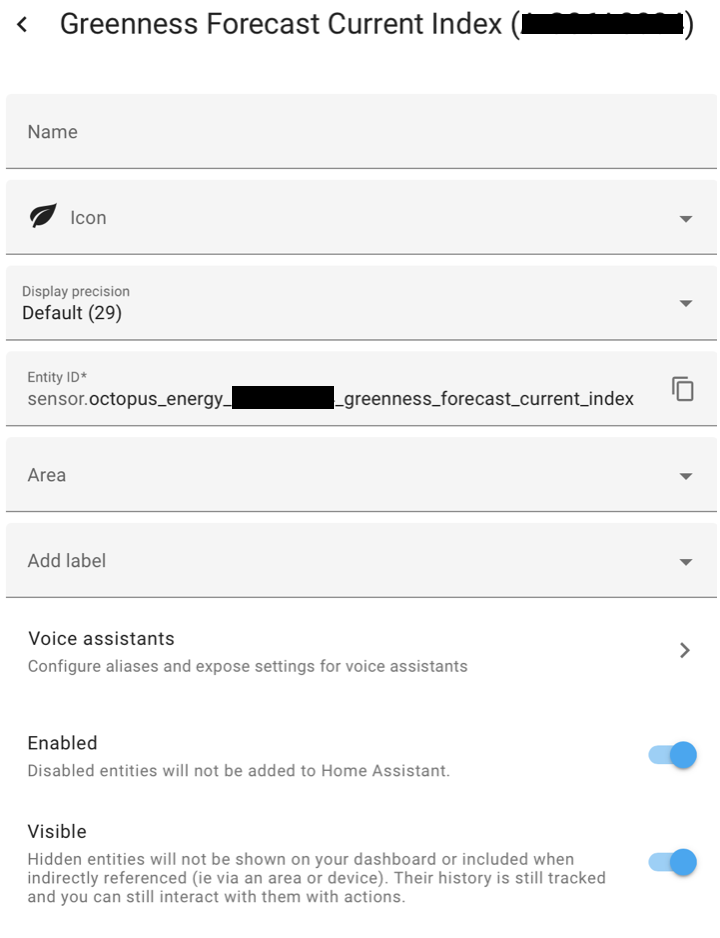
Check that you have the entity enabled. This is what I see when I select the cog wheel.

I did find that the apex chart didn't like any of the lines containing my octopus details that I had typed in.
I ended up going into device&services/Octopus energy/entities and copying the entity containing my details. I then pasted this into the relevant lines in the apex chart and they were all accepted.

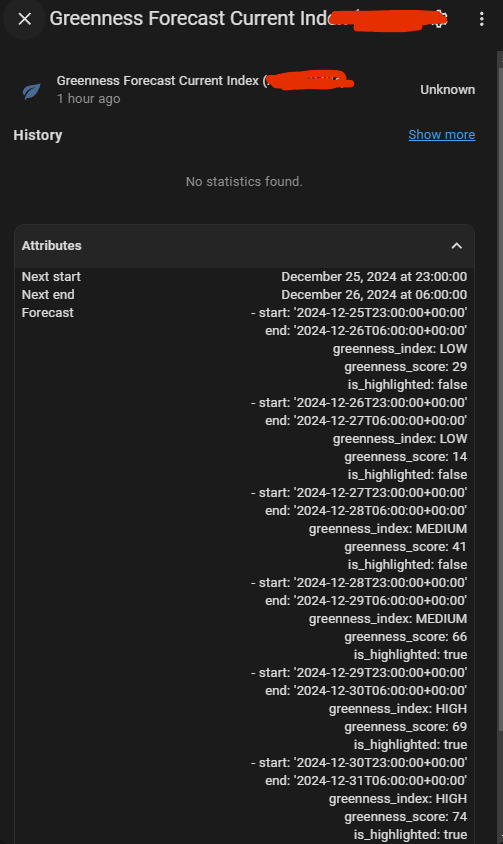
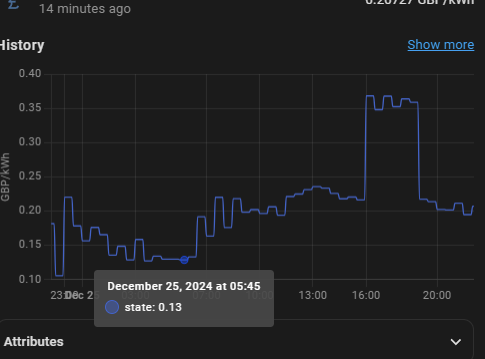
Looking at the greenness forecast current index chart, it updates from 23:00pm – 60:00 am. See below for what happens over 24 hours:

In your screenshot in Jellybaby, the current index entity flags up as 'unknown' with no chart.
Compare with mine. your other Octopus details entities are showing just fine.

My current index entity details match those of @geoffreycoan so it looks like this is what is breaking your apex chart code.

EDIT: Meanwhile, it looks as if you have sorted this so well done.

Rob

J
#17 Jellybaby

Rbor >I did find that the apex chart didn't like any of the lines containing my octopus details that I had typed in.

Same here I had to change it from say "X-198HY5H3" to "x_198hy5h3" < (Not an actual account number) after that it was fine, no idea how to get long boxes put in, tried few different view modes in new dashboards.

G
#18 geoffreycoan

Jellybaby Ah good.

The width is probably due to the layout of the HA dashboard. I am using the ‘grid-layout’ on my dashboard which is a HACS add-on, here’s the start of the view YAML:

  - title: Charts
    path: charts
    icon: mdi:chart-multiple
    type: custom:grid-layout
    badges: []
    cards:
      - type: custom:apexcharts-card
        experimental:
          color_threshold: true
        apex_config:
          chart:
            height: 300px
…

So nothing special, and basically it’s just a vertical column of charts, the full width of the screen.

If you are using the new sections view type you should be able to configure the width of the apex chart component on the dashboard page.

J
#19 Jellybaby

you were too quick for me to edit other post lol picked this clip up

I tried Sections and MAsonry to no avail and couldnt find anything "grid-layout" in HACS search

R
#20 Rbor

geoffreycoan In my 'standard' dashboards, I use a 'grid layout in which I add further grid cards to hold other cards'. It sounds complicated but it gives me a lot of flexibility in placement. I got the idea from one of the many YouTube videos on dashboards.

I am trying the new sections layout but I haven't mastered it yet. I prefer my 'grid in grid' arrangement.

Rob

G
#21 geoffreycoan

Jellybaby I tried Sections and MAsonry to no avail and couldnt find anything "grid-layout" in HACS search

Masonry is awful, grid layout is part of layout card https://github.com/thomasloven/lovelace-layout-card in HACS. There’s a few different layout types but I prefer to use grid. At some point I’ll move over to using sections as that’s the HA way forward and offers a lot of positional control. Grid is OK but it’s a bit of a pain with vertical and horizontal cards within it.

Jellybaby Same here I had to change it from say "X-198HY5H3" to "x_198hy5h3"

That’s a HA thing, sensor names are always in lower case.

Rbor I ended up going into device&services/Octopus energy/entities and copying the entity containing my details

It sounds like neither of you are using the HA sensor auto-complete.

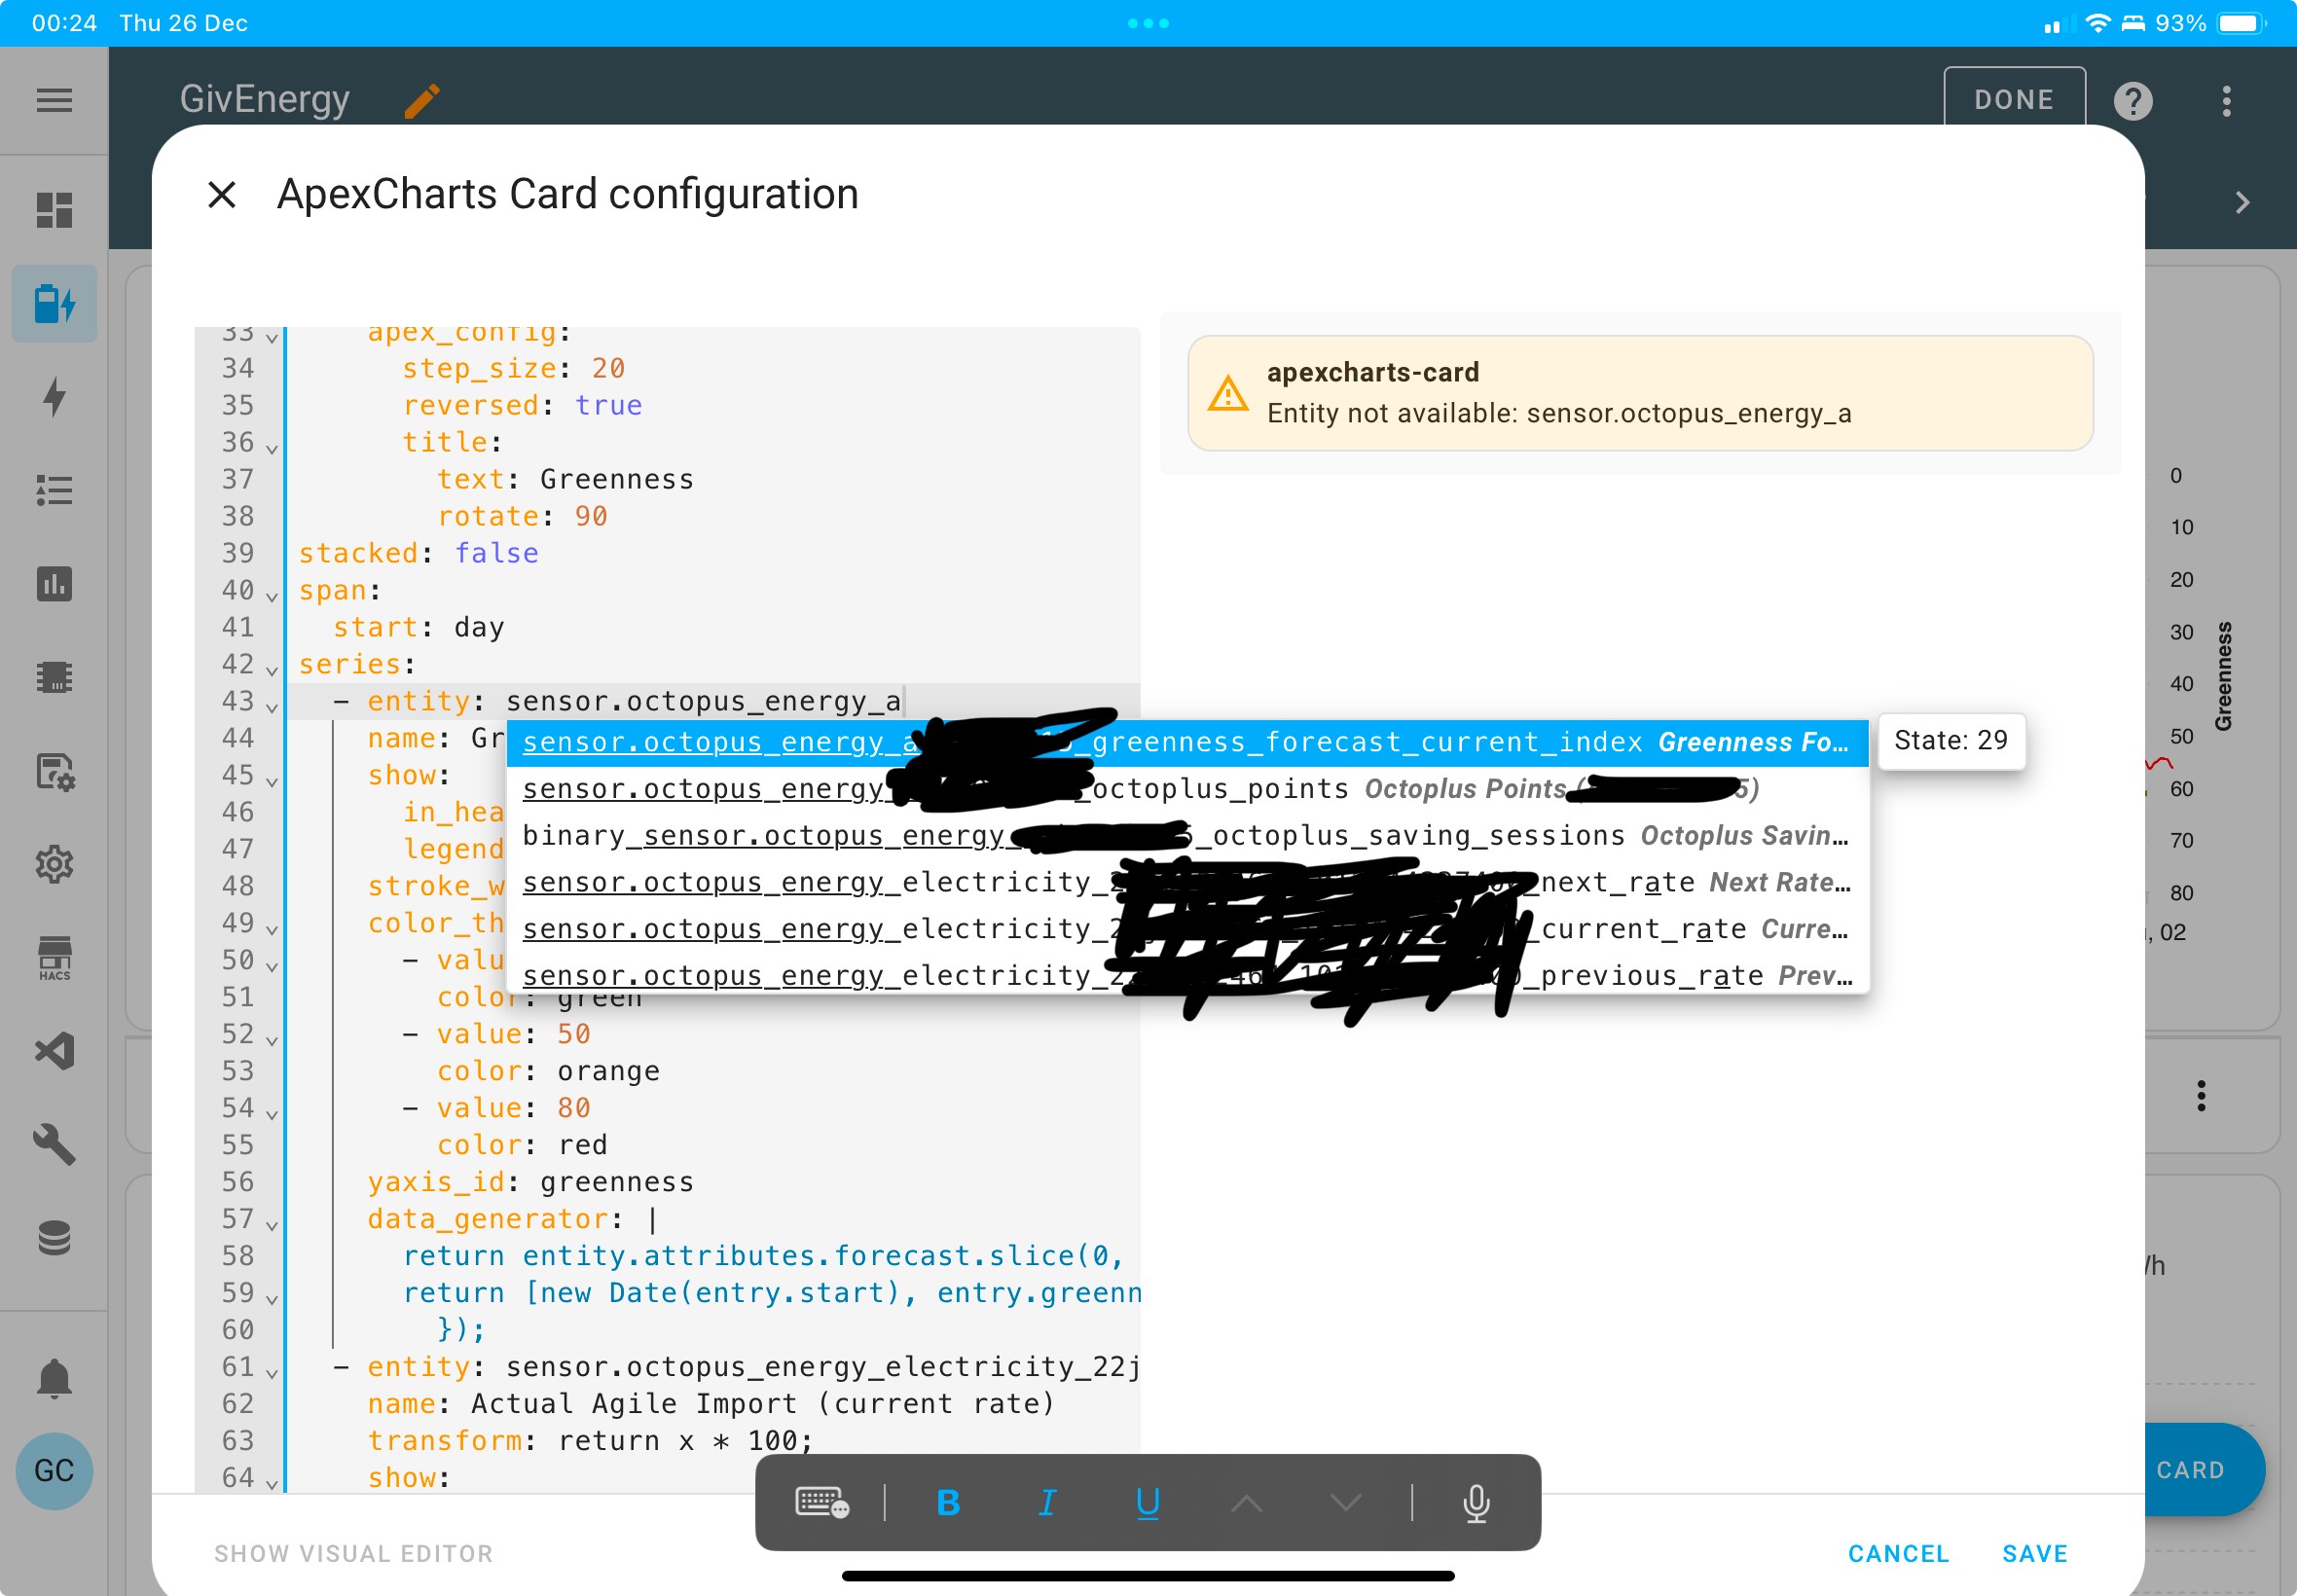
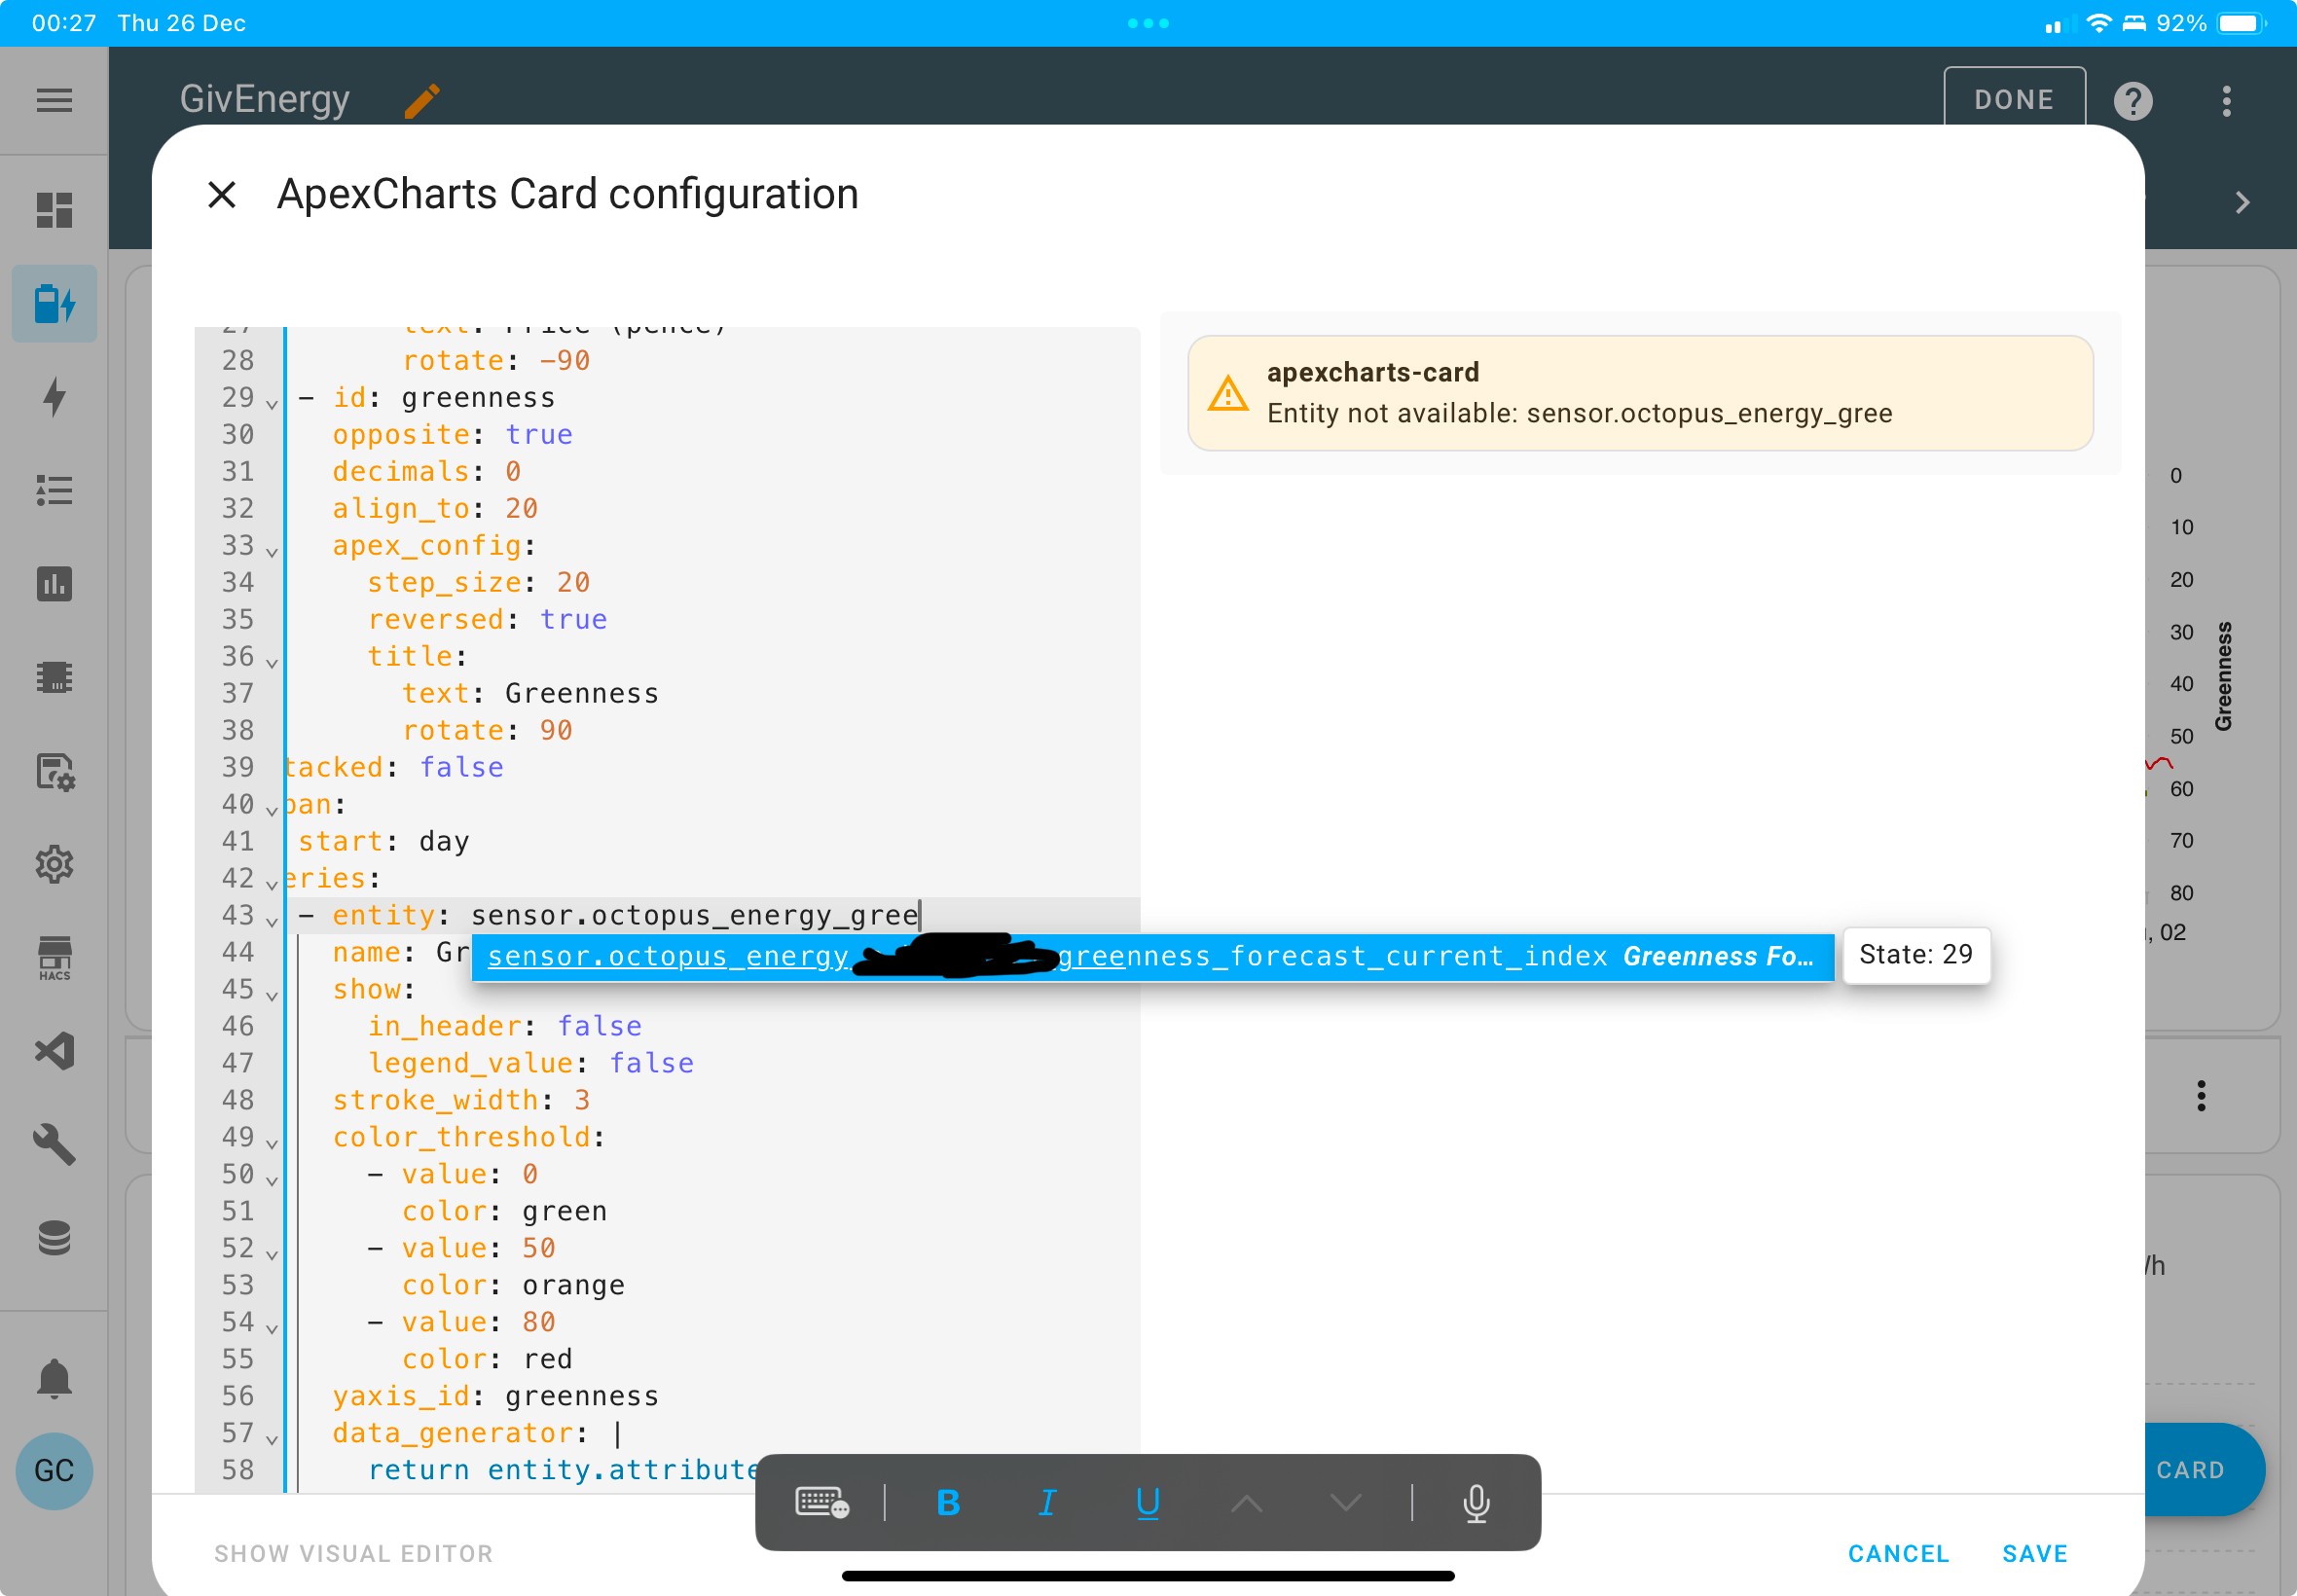
Paste the YAML in as I had it, then delete the end of the sensor name back to the AAAA/XXXX that I typed in, then when you type the next matching character of the sensor name, HA will give you a set of suggested matches. It can be anywhere from the sensor name it will do a partial match on, so for example I deleted “AAAA_greenness_forecast_current_index” and typed ‘a’ which is the first character of my account id, and got this list of matching sensor names:

Or even more usefully, if I start typing ‘green’ it will match any sensors that start ‘octopus_energy_’ and have ‘green’ in the rest of the sensor name:

Makes it dead easy to find the correct sensor names

R
#22 Rbor

geoffreycoan That’s a HA thing, sensor names are always in lower case.

Thanks.
I usually use the HA sensor auto-complete.
Here, because I needed 3 codes: Account ID, MPAN and Serial number, I went to my account details on Octopus site and copied each code. Octopus shows the letters upper case.
That also explains why the apex lines were accepted when I copied the whole line from Devices & Services/entities.
.... another HA lesson for me.

.... sections as that’s the HA way forward

I will persevere with sections. For me, HA seems to set a maximum section width and I haven't yet found a way to set this.
I agree that working with grid view could be complicated and convoluted but it did allow me to arrange different numbers of card entries across a grid row and to get a neat consistent arrangement.

Rob

J
#23 Jellybaby

geoffreycoan I seem to have got it working.

H
#24 Henry3rd

I like this graph, I couldn't get it to work until I remembered to reload HA configuration.yaml.

However, I am now hungry for more statistics 🙂
Does anyone have a graph that shows this years' electrical spend versus last years on Octopus? Perhaps on a month by month basis.
I'd like to see that my investment in Solar is reaping benefits.
(I know you are all wondering what to do with this down time between Xmas and New Year 🙂 )

G
#25 geoffreycoan

Henry3rd Does anyone have a graph that shows this years' electrical spend versus last years on Octopus? Perhaps on a month by month basis.

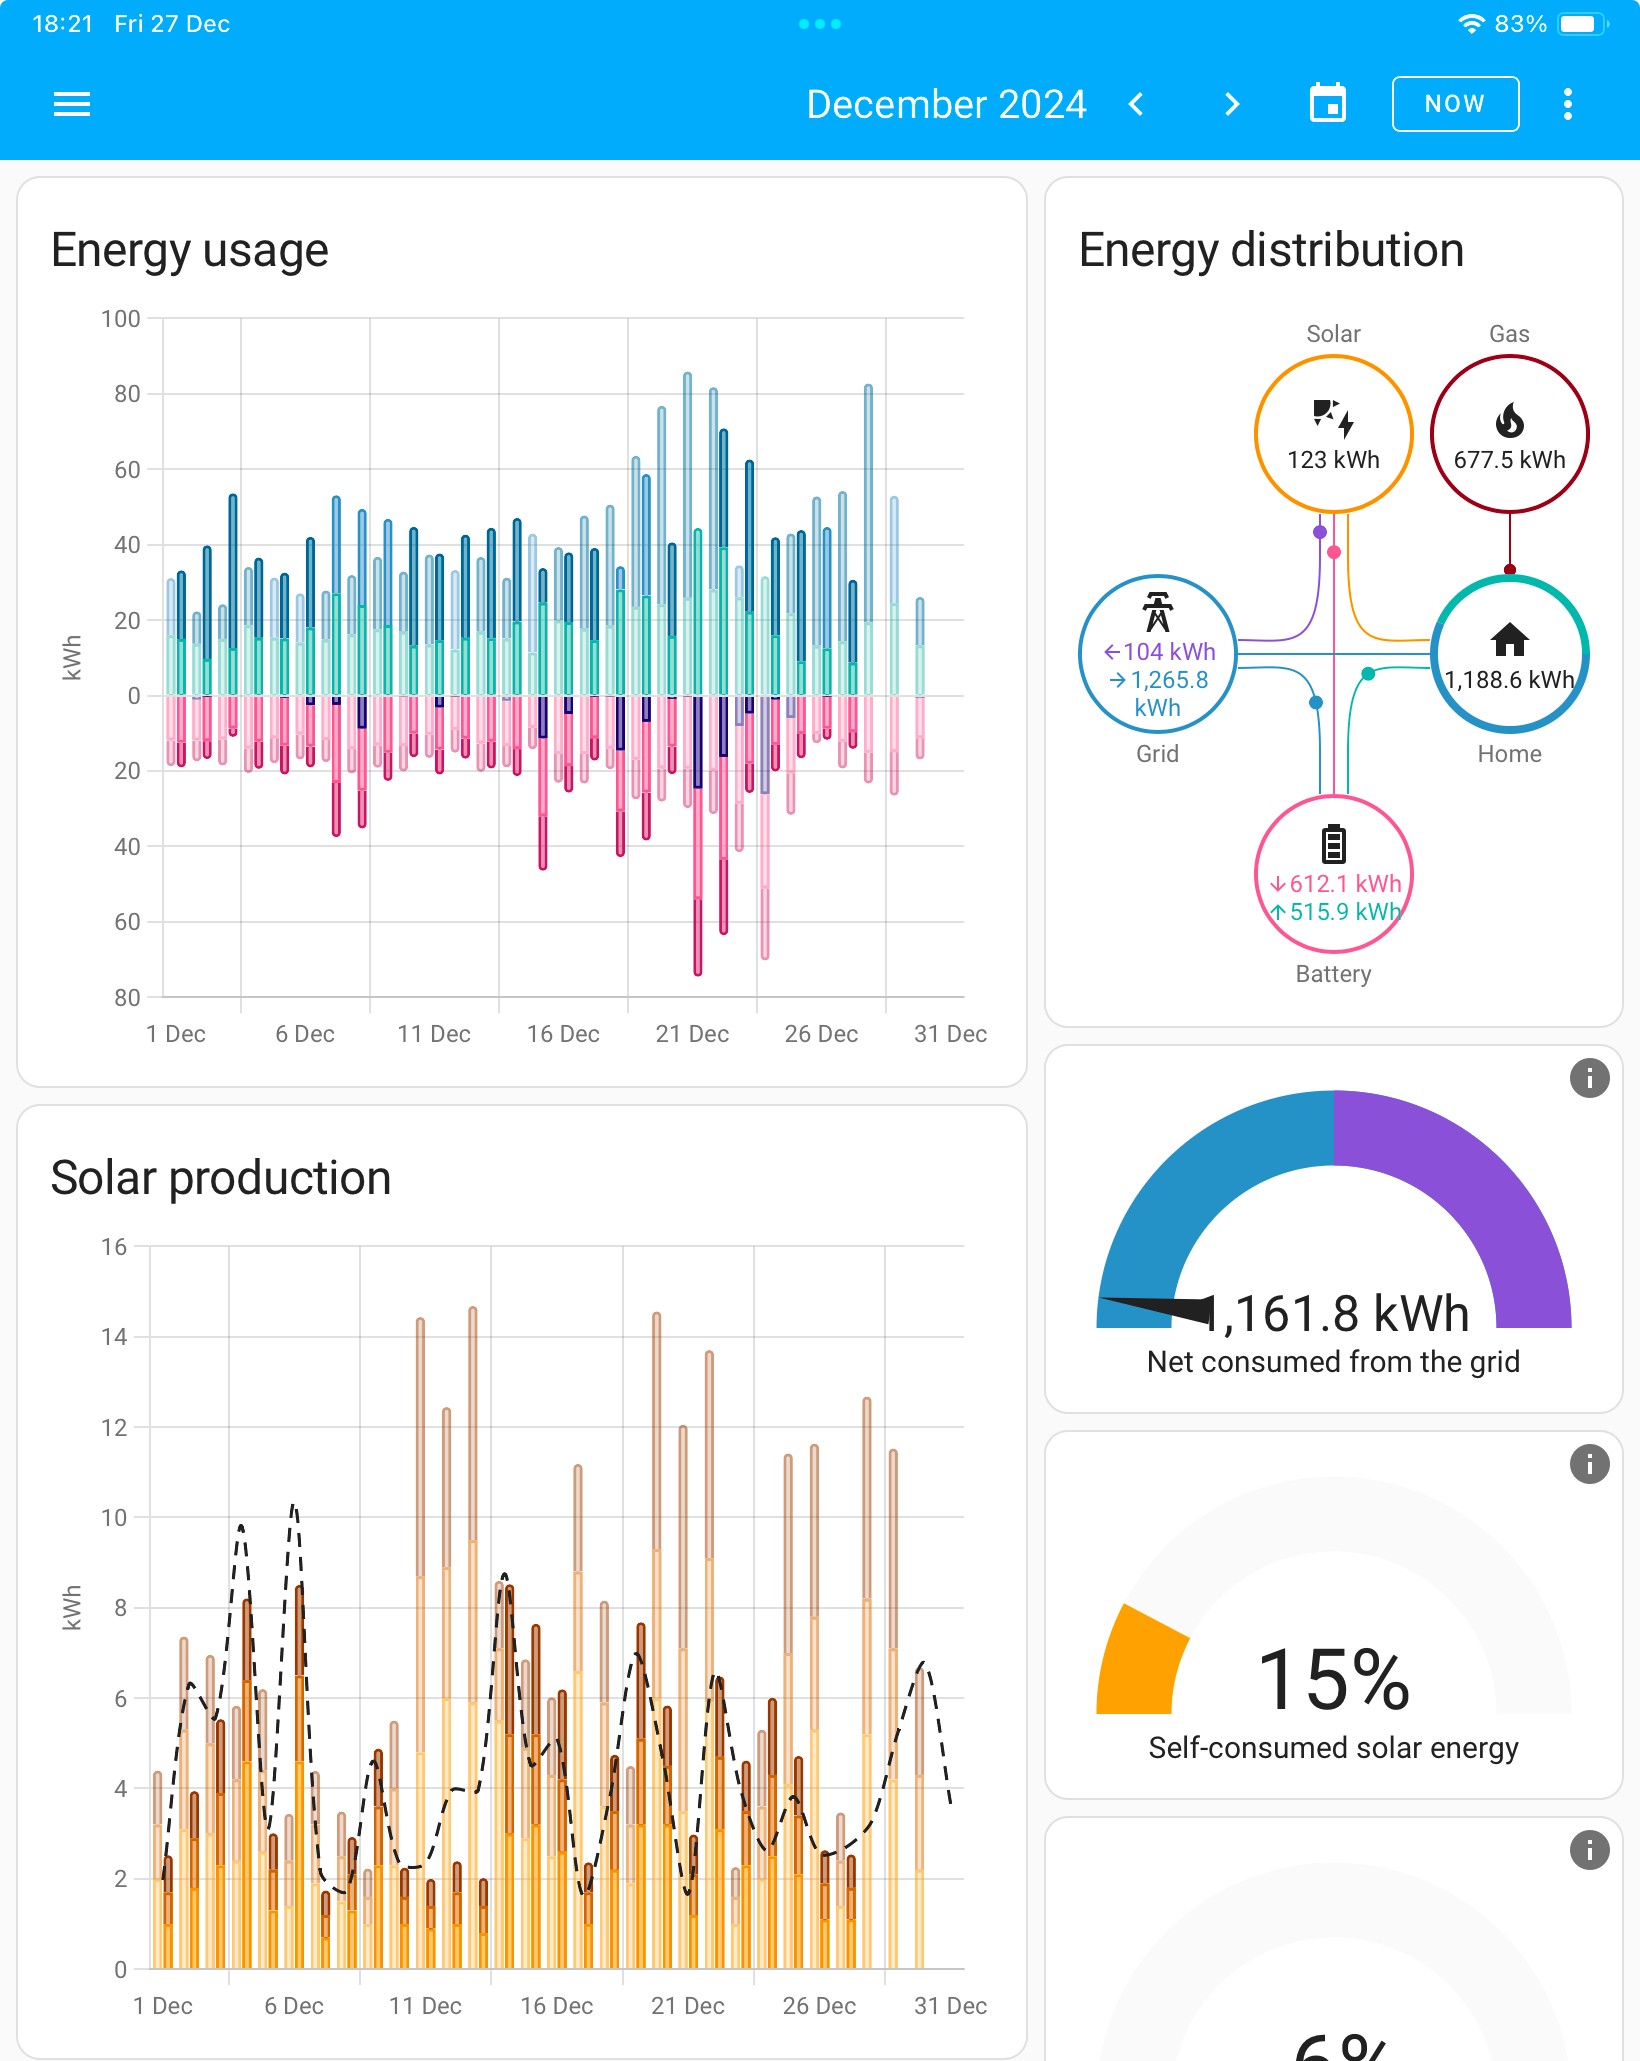
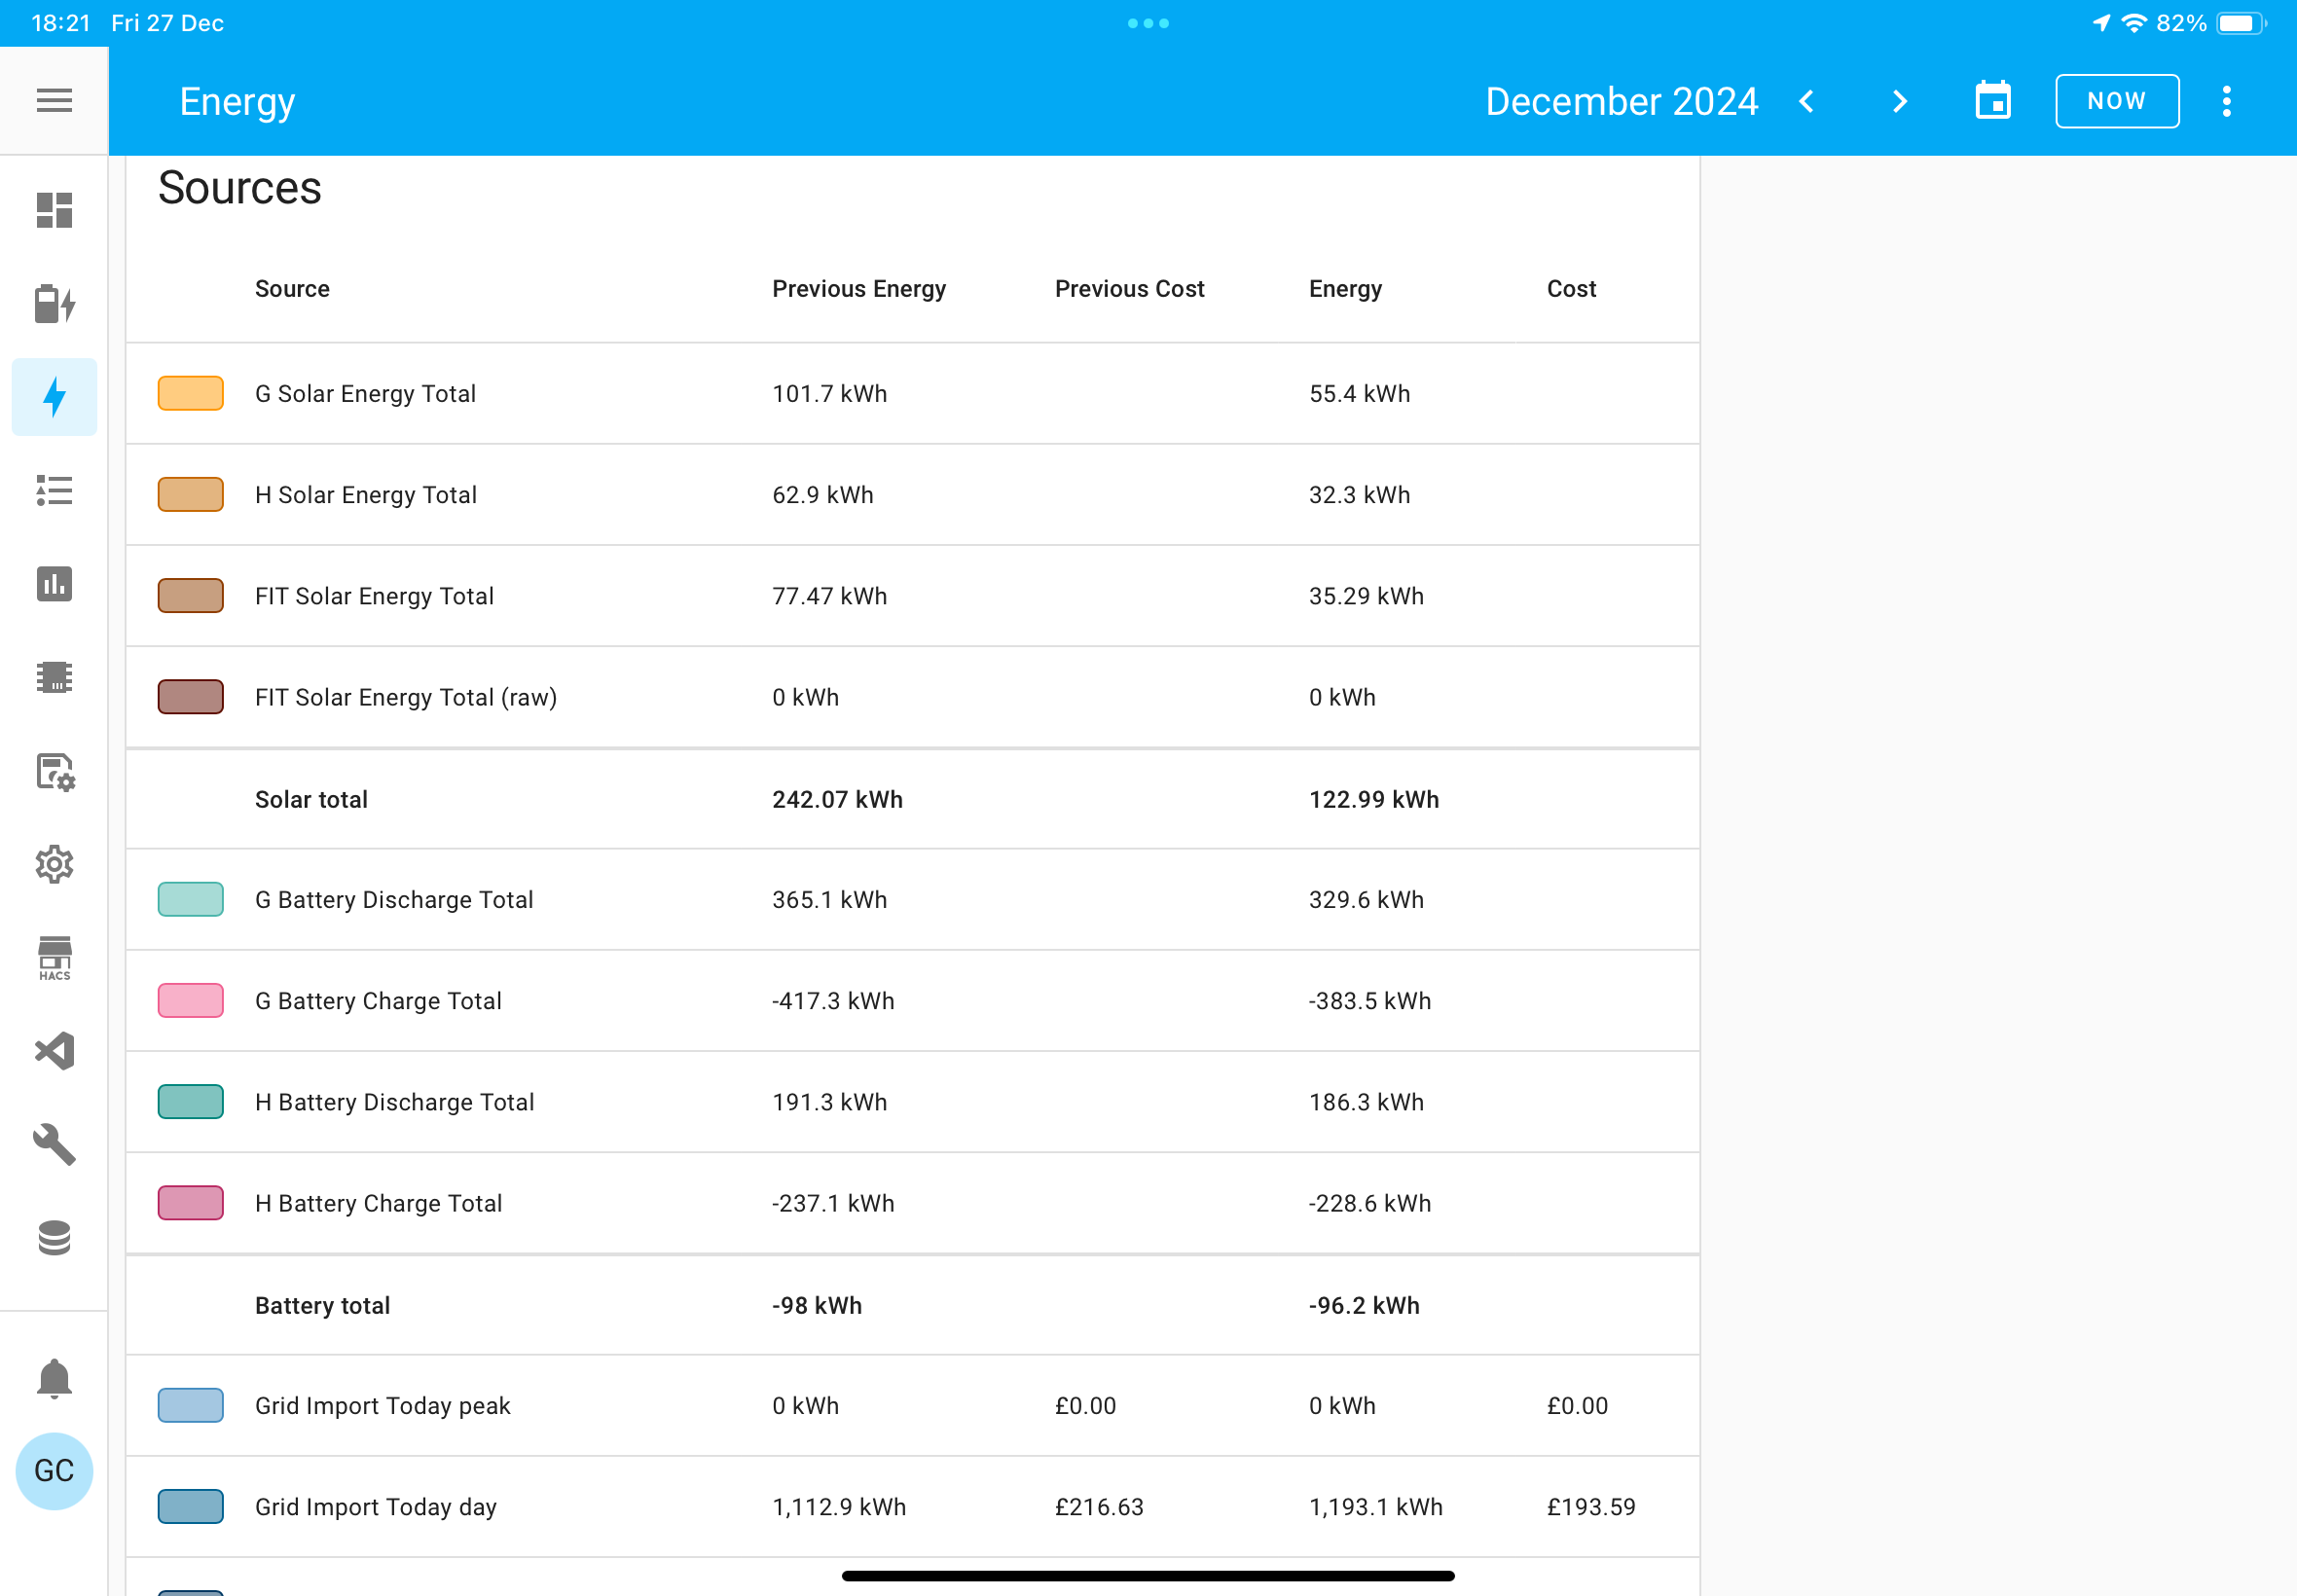
If you set the energy dashboard up then you can see import cost and export income for any period of time you like and compare it to last year.

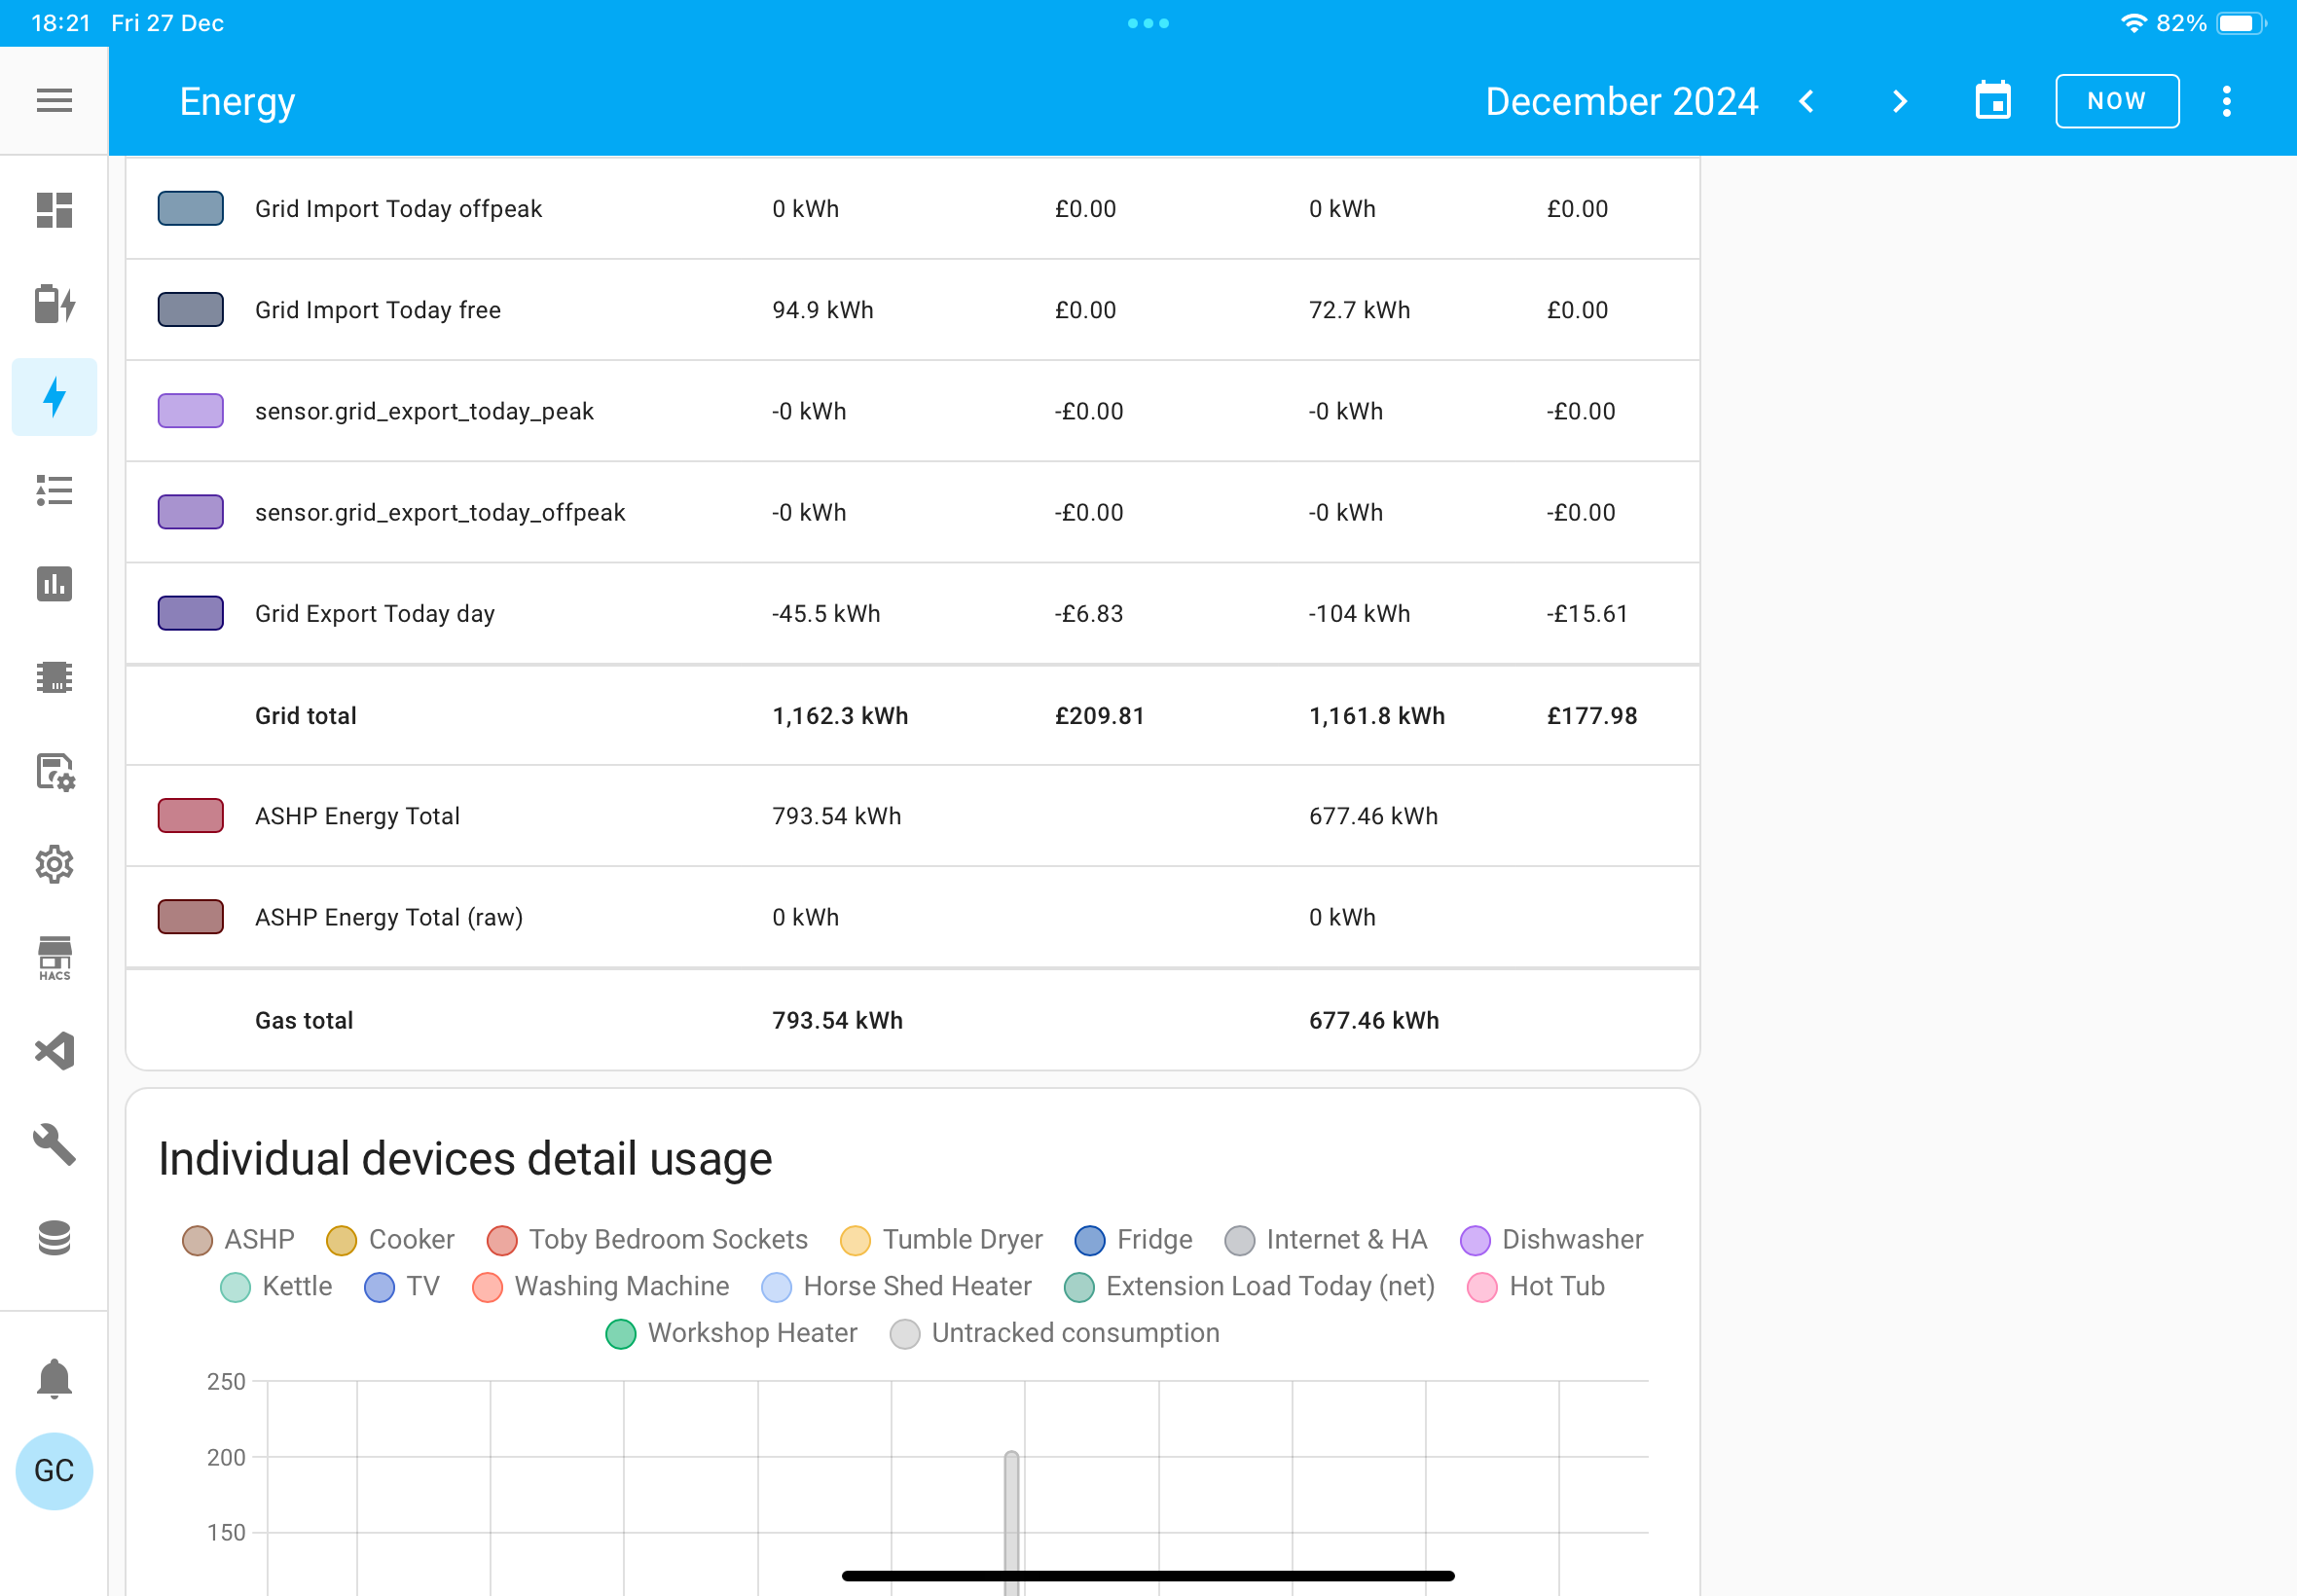
e.g. here’s my data for December 2024 compared to last year. Solar generation for December about half of last year’s, electric import about the same, cost on track to be the same for the month, export about twice as much (must have been some good low agile rates at times this month)


(the peak/offpeak stuff is artefacts of when I was on Octopus Flux and I still need to simplify the underlying data and remove it off the dashboard)

H
#26 Henry3rd

geoffreycoan Thanks, I only have data for the current month on the energy dashboard, can I import previous months?

G
#27 geoffreycoan

Henry3rd yes you can. I am planning to share a how-to article on this

J
#28 Jellybaby

Jellybaby Green line gone 🙁

lol, got some washing built up for when its next cheap 😃

G
#29 geoffreycoan

Jellybaby You can always tweak the colour thresholds to make it green again 😆

A score of 80 is fairly green

I’ve got a 2 hour power up event tomorrow so washing machine and tumble all set for then, as well as overnight tonight …

#30 PianSom

geoffreycoan
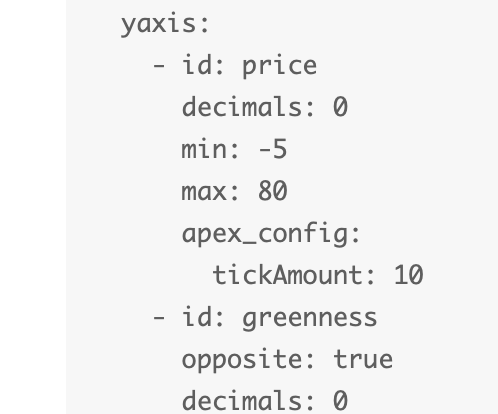
Given recent history, it may be better to amend max: 80 to max: ~80 in this section:

See the example here

J
#31 Jellybaby

geoffreycoan LOL, also you lucky post coder bugger 😃

G
#32 geoffreycoan

PianSom Given recent history, it may be better to amend max: 80 to max: 80 in this section:

Good point, I’ve changed mine to ~50. I had used auto but there’s a bug in the recent Apex charts that causes it not to scale so put the 80 and -5 in to show a ‘reasonable’ range. I’d forgotten about the ~ variant

J
#33 Josephiah

Thanks for this; a nice addition to my dashboard. The trickiest part for me was getting the sensor script in configuration.yaml to work properly, but that's probably just my inept YAML-ing. The colour gradient settings on the greenness forecast line are somewhat baffling, however!

G
#34 geoffreycoan

Josephiah The greenness line was originally the other way round, with higher being more green.

Combining it with the agile rate prediction I felt it needed the greenness line reversing so a higher line i.e. a lower greenness score would logically correspond to higher agile prices. Lower line, higher green score, lower agile prices.

But in reversing the line the color shading got inverted as well so I had to manually change all the thresholds. Probably why Jellybaby has lost his green line and why it makes little sense. IDK,I just set values to make it look similar to where it was before

J
#35 Jellybaby

geoffreycoan Green line went as its just a prediction, was just hoping it would stay for some super cheap leccie 😃 but that could very well change again 🙂

J
#36 Josephiah

geoffreycoan yeah, totally agree that the line should come downwards and become more green for higher greenness, but how the colour thresholds apply has been total trial and error with little understanding on part!

G
#37 geoffreycoan

Josephiah I really don’t understand how the colouring works either, suspect that because I have inverted the scale the colour thresholds have to invert as well, but they don’t seem to correspond all that well to what you see on the graph.

This set of colour thresholds might be slightly better, bit more green for the early part of this week:

    color_threshold:
      - value: 90
        color: red
      - value: 70
        color: orange
      - value: 20
        color: green
R
#38 Rbor

Looks better for me, at least:

Rob

G
#39 geoffreycoan

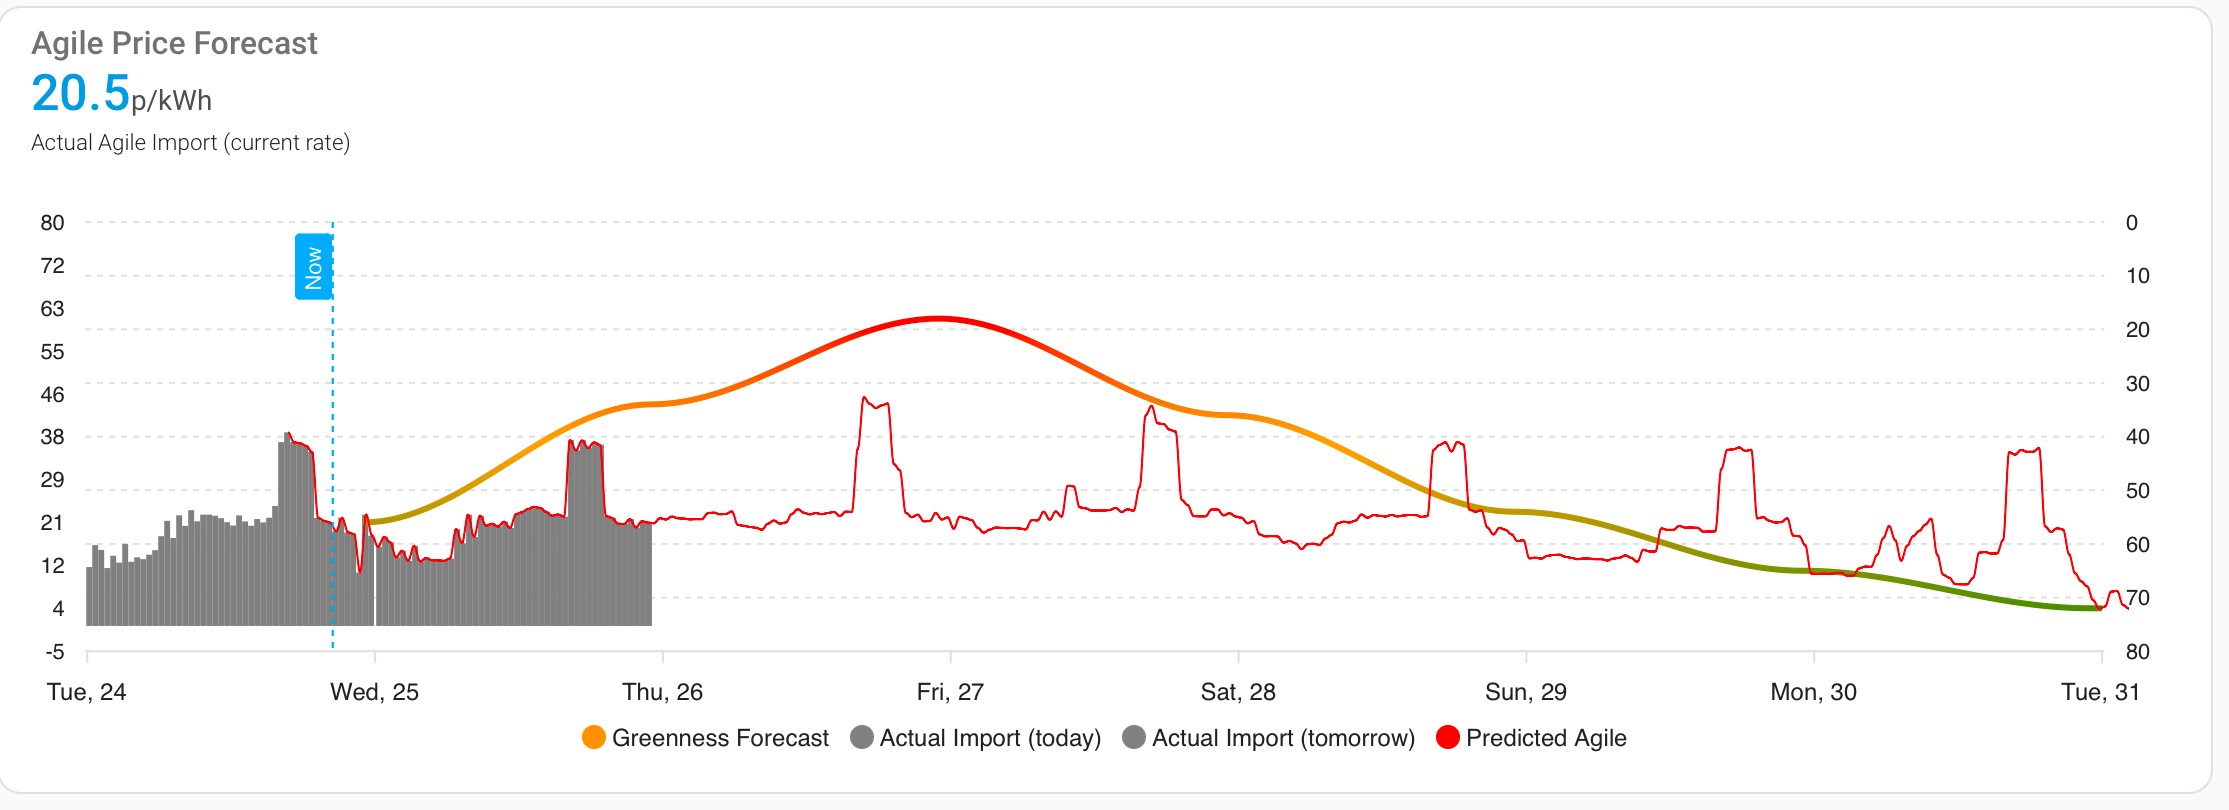
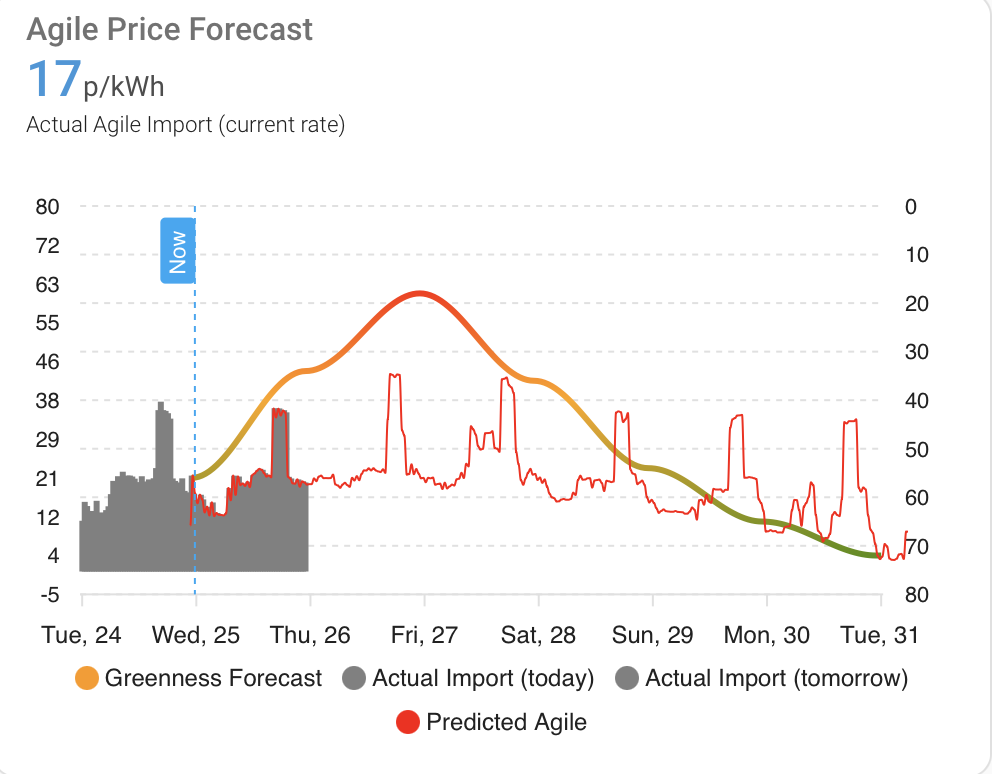
geoffreycoan I’ve revised the colour shading again of the greenness index because it was making the line generally too green, and in going back to basics I worked out how the reversed shading should have been, I basically just needed to reverse the colour order in the series definition.

Revised chart above, current chart below:

New series definition replacing the existing in the Apex chart (its only actually the color_threshold bit that has changed):

  - entity: sensor.octopus_energy_AAAA_greenness_forecast_current_index
    name: Greenness Forecast
    show:
      in_header: false
      legend_value: false
    stroke_width: 3
    color_threshold:
      - value: 0
        color: green
      - value: 40
        color: orange
      - value: 80
        color: red
   yaxis_id: greenness
    data_generator: |
      return entity.attributes.forecast.slice(0, 7).map((entry) => {
      return [new Date(entry.start), entry.greenness_score];
        });
R
#40 Rbor

geoffreycoan Thanks.
I have amended the color_threshold section and looks to be an improvement.
The greenness forecast day-to-day isn't good when 54 gets an Octopus green crown!

Rob