G
#1 G-dog
anyone having this problem?
i assume it has been updated, as there is now a legacy energy graph, which works perfectly BTW

anyone having this problem?
i assume it has been updated, as there is now a legacy energy graph, which works perfectly BTW
G-dog legacy energy graph, which works perfectly BTW
Your definition of perfectly may be different to mine.
Taking my figures for the 18th:
Inverter data/meter data/pv gen today = 5.20kWh
Energy Graph = 3.90kWh
Legacy Energy Graph = 5.39kWh
I never use the energy graphs as I have always found them to be inaccurate.
Same problem here. The new energy graph monthly numbers are terrible!
Legacy version is a very close match on import and export to the meter & Octopus account.
New energy graph monthly total is showing about 1/3 of home use and less than half of actual for import & export.
Quite shockingly bad!
Hmmm...
For me it the lack of weekly, monthly block graphs... I don't want 365 bars, I want 12.
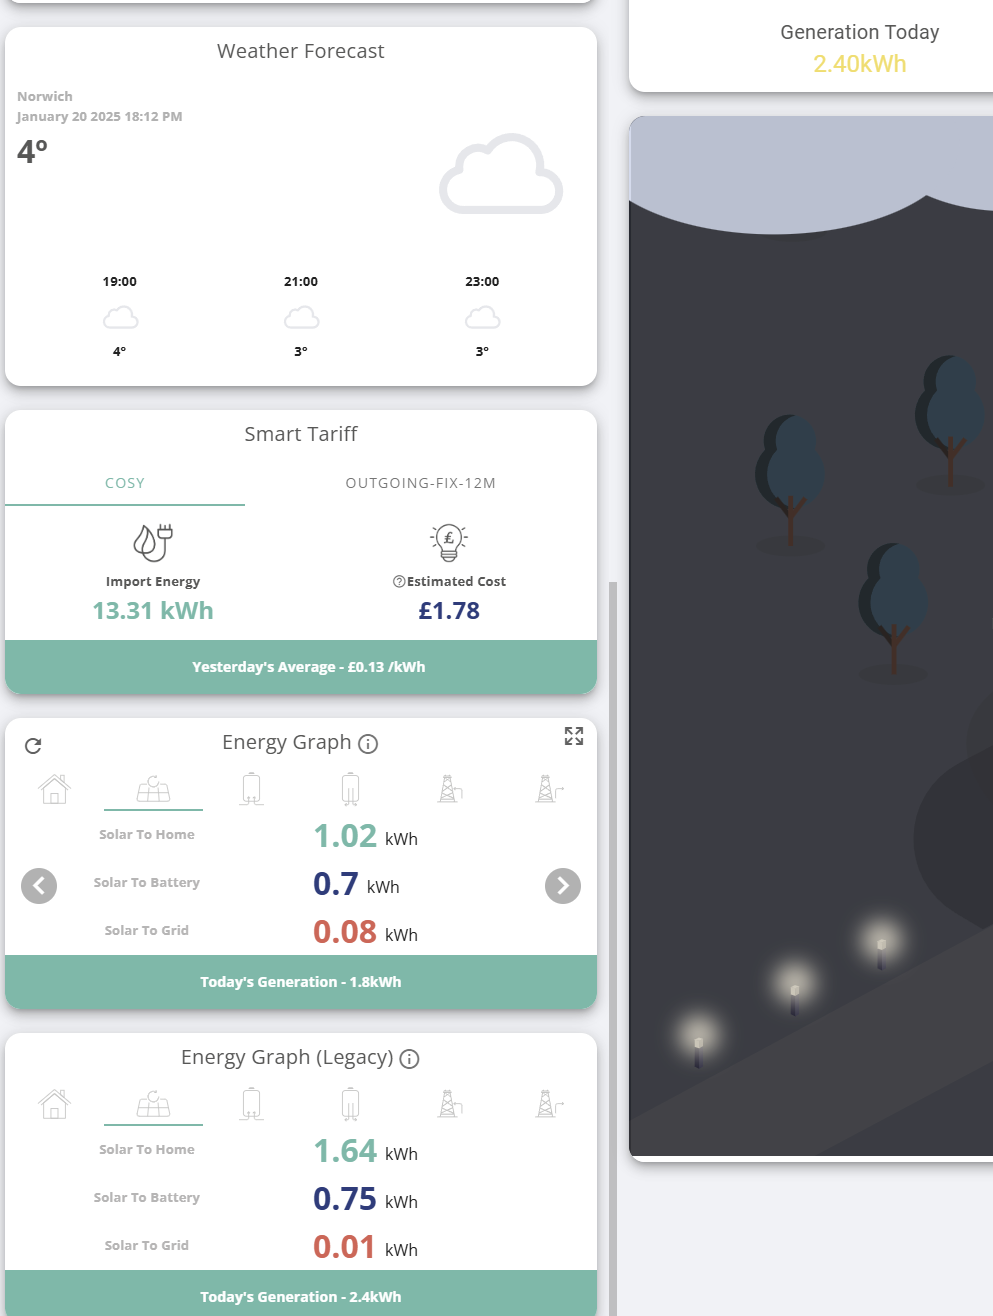
My energy graphs also nonsecnce as is the downloaded Energy Flows Data. Was never perfect but now the system is clearly broken. Data that was there from weeks ago no longer available. Will email GivEnergy.
when did this new energy graph come about. its useless
Rubikcube TBH i didn't analyse the accuracy output just monthly graphs are broken. Your analysis is shocking. who on earth checks this software before release.
Do the GivEnergy Guys look at this forum ?? I have the same problem downloaded data is all screwed up, data is missing, nothing adds up anymore.. This happened on the 17th Jan.... Guys please undo the changes you made then.
Wendy Not really, well not the ones who do the portal s/w.
You'd be better off directing criticism on social media which may get a fix/response. Feedback link on the portal is pointless, so don't bother doing it from there.

I have noticed that the Energy Graph data appears to be inaccurate since the beginning of the New Year... The Energy Graph data always use to present figures to two decimal places (xx.xx) whereas since the beginning of January the data is now being rounded up to one decimal place (xx.x). I have been recorded the daily figures since my system was commissioned and the data has always seem reasonably good, but now its totally useless...
The legacy graph is still available if you edit the dashboard you can add it back in. However if you are choosing yearly but choose 2025 the graphs seem to retain daily views as there isnt over a months data. Presumable it will be ok in Feb!
I'm also having this issue. Is Givenergy working on fixing the new power graph?
luckypants Hello, I've changed my Dashboard view to using the 'Energy Graph (Legacy)' panel which appears to offer the correct values / data that I have always been accustomed too... Hope this helps ???
I have the same issue where it says i had imported 4 MWH from the grid in november, previously i called Giv and they removed the error information easily and i gave them a suggestion to add a feature to remove the data but it was never actioned.
Now it has happened again and now you never get through to them via calling, just a comment to email them but it just gets ignored.
it seems to get worse each time
[unknown] Thank you thank you thank you!
Hopeful Thank you thank you thank you!
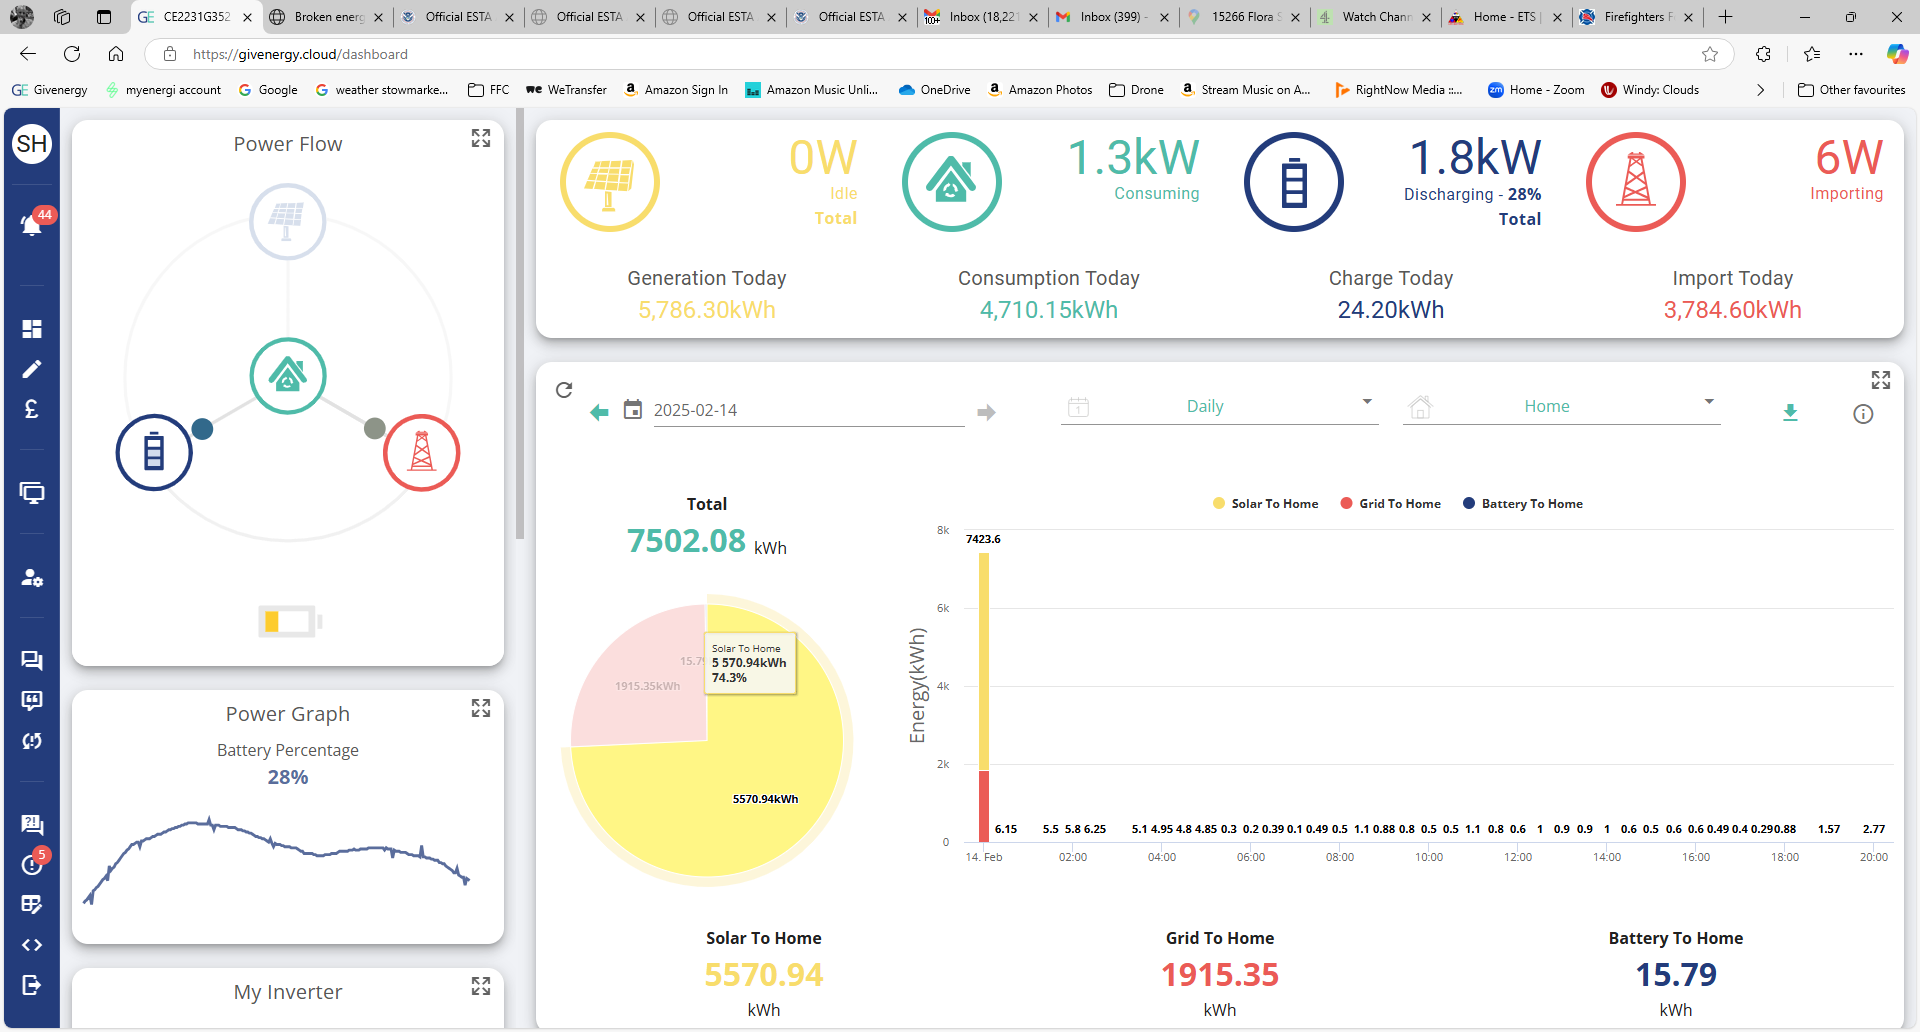
I have been having the same issue as it appears others have. The data shown was daily and was fairly accurate, now the data shows that I generated 5570.94 kWh today. Normally this time of the year on a good day may generate about 6kWh!!
Does anyone have an answer as to what is happening please?
Thank you for your help.
TooheyGE Hi
Did you ever get a response?