Data Analytics

6 comments started 2025-02-23 last 2025-03-05
Cloud PortalAPIsHome AutomationGivEnergy Products
#1 Maxwell

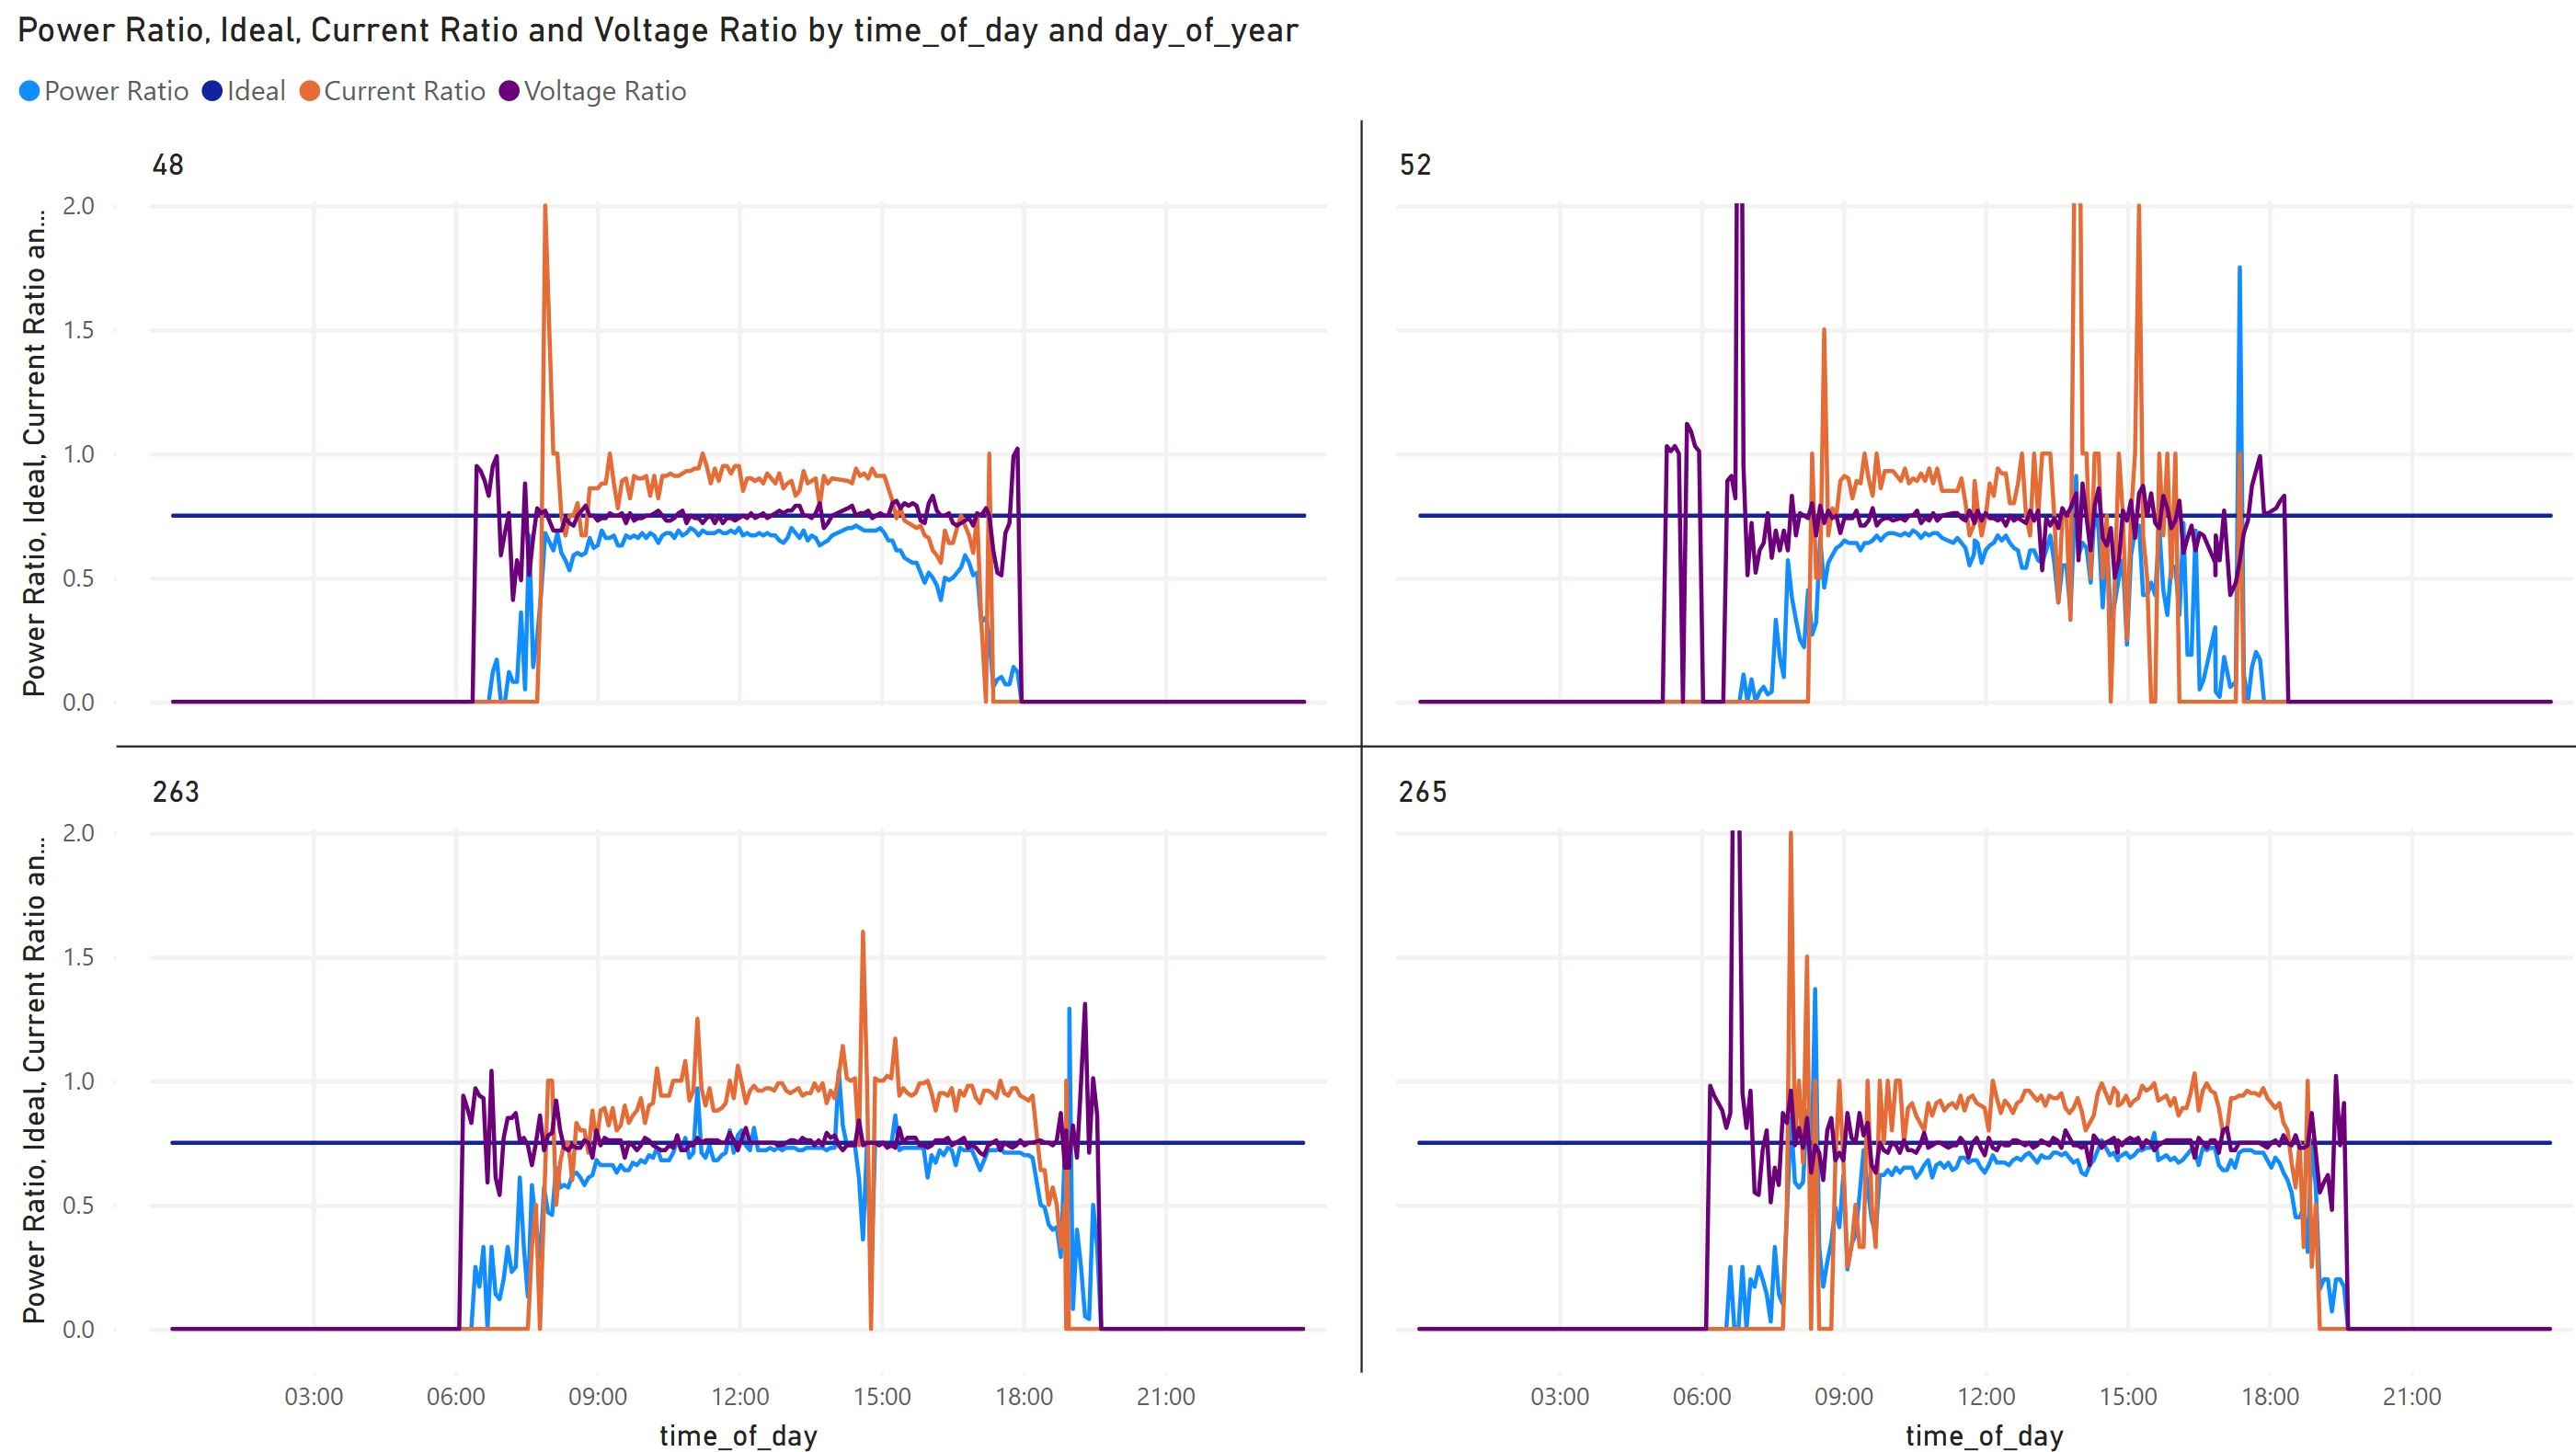
So, having used a very manual process i was able to identify a fault in the system. It turned out that the fault was in the inverter. Now i appreciate that looking at the ratio of power, voltage or current between the strings (for those who have two different strings of panels) isn't going to help you identify the exact fault as there are many variables like shading, differences in orientation of differenr strings, panel faults or as in my case in one of the mppt chanels in the inverter. But at least it can give you an indication that something is wrong, there were no inverter errors in my case. And there is no one solution here that will work for everyone. In my case the panesl are in two strings, 6 & 8. So, give or take conversion losses etc i was expecting the power ratio to be circa 0.75. For me both strings have the same orientation and no obvious selective shading. But, in different set ups then this may not be quite that simple. But, if you can visualise/analyse your data then you can start to work out what normal looks like. And yes, i know we shouldn't have to.
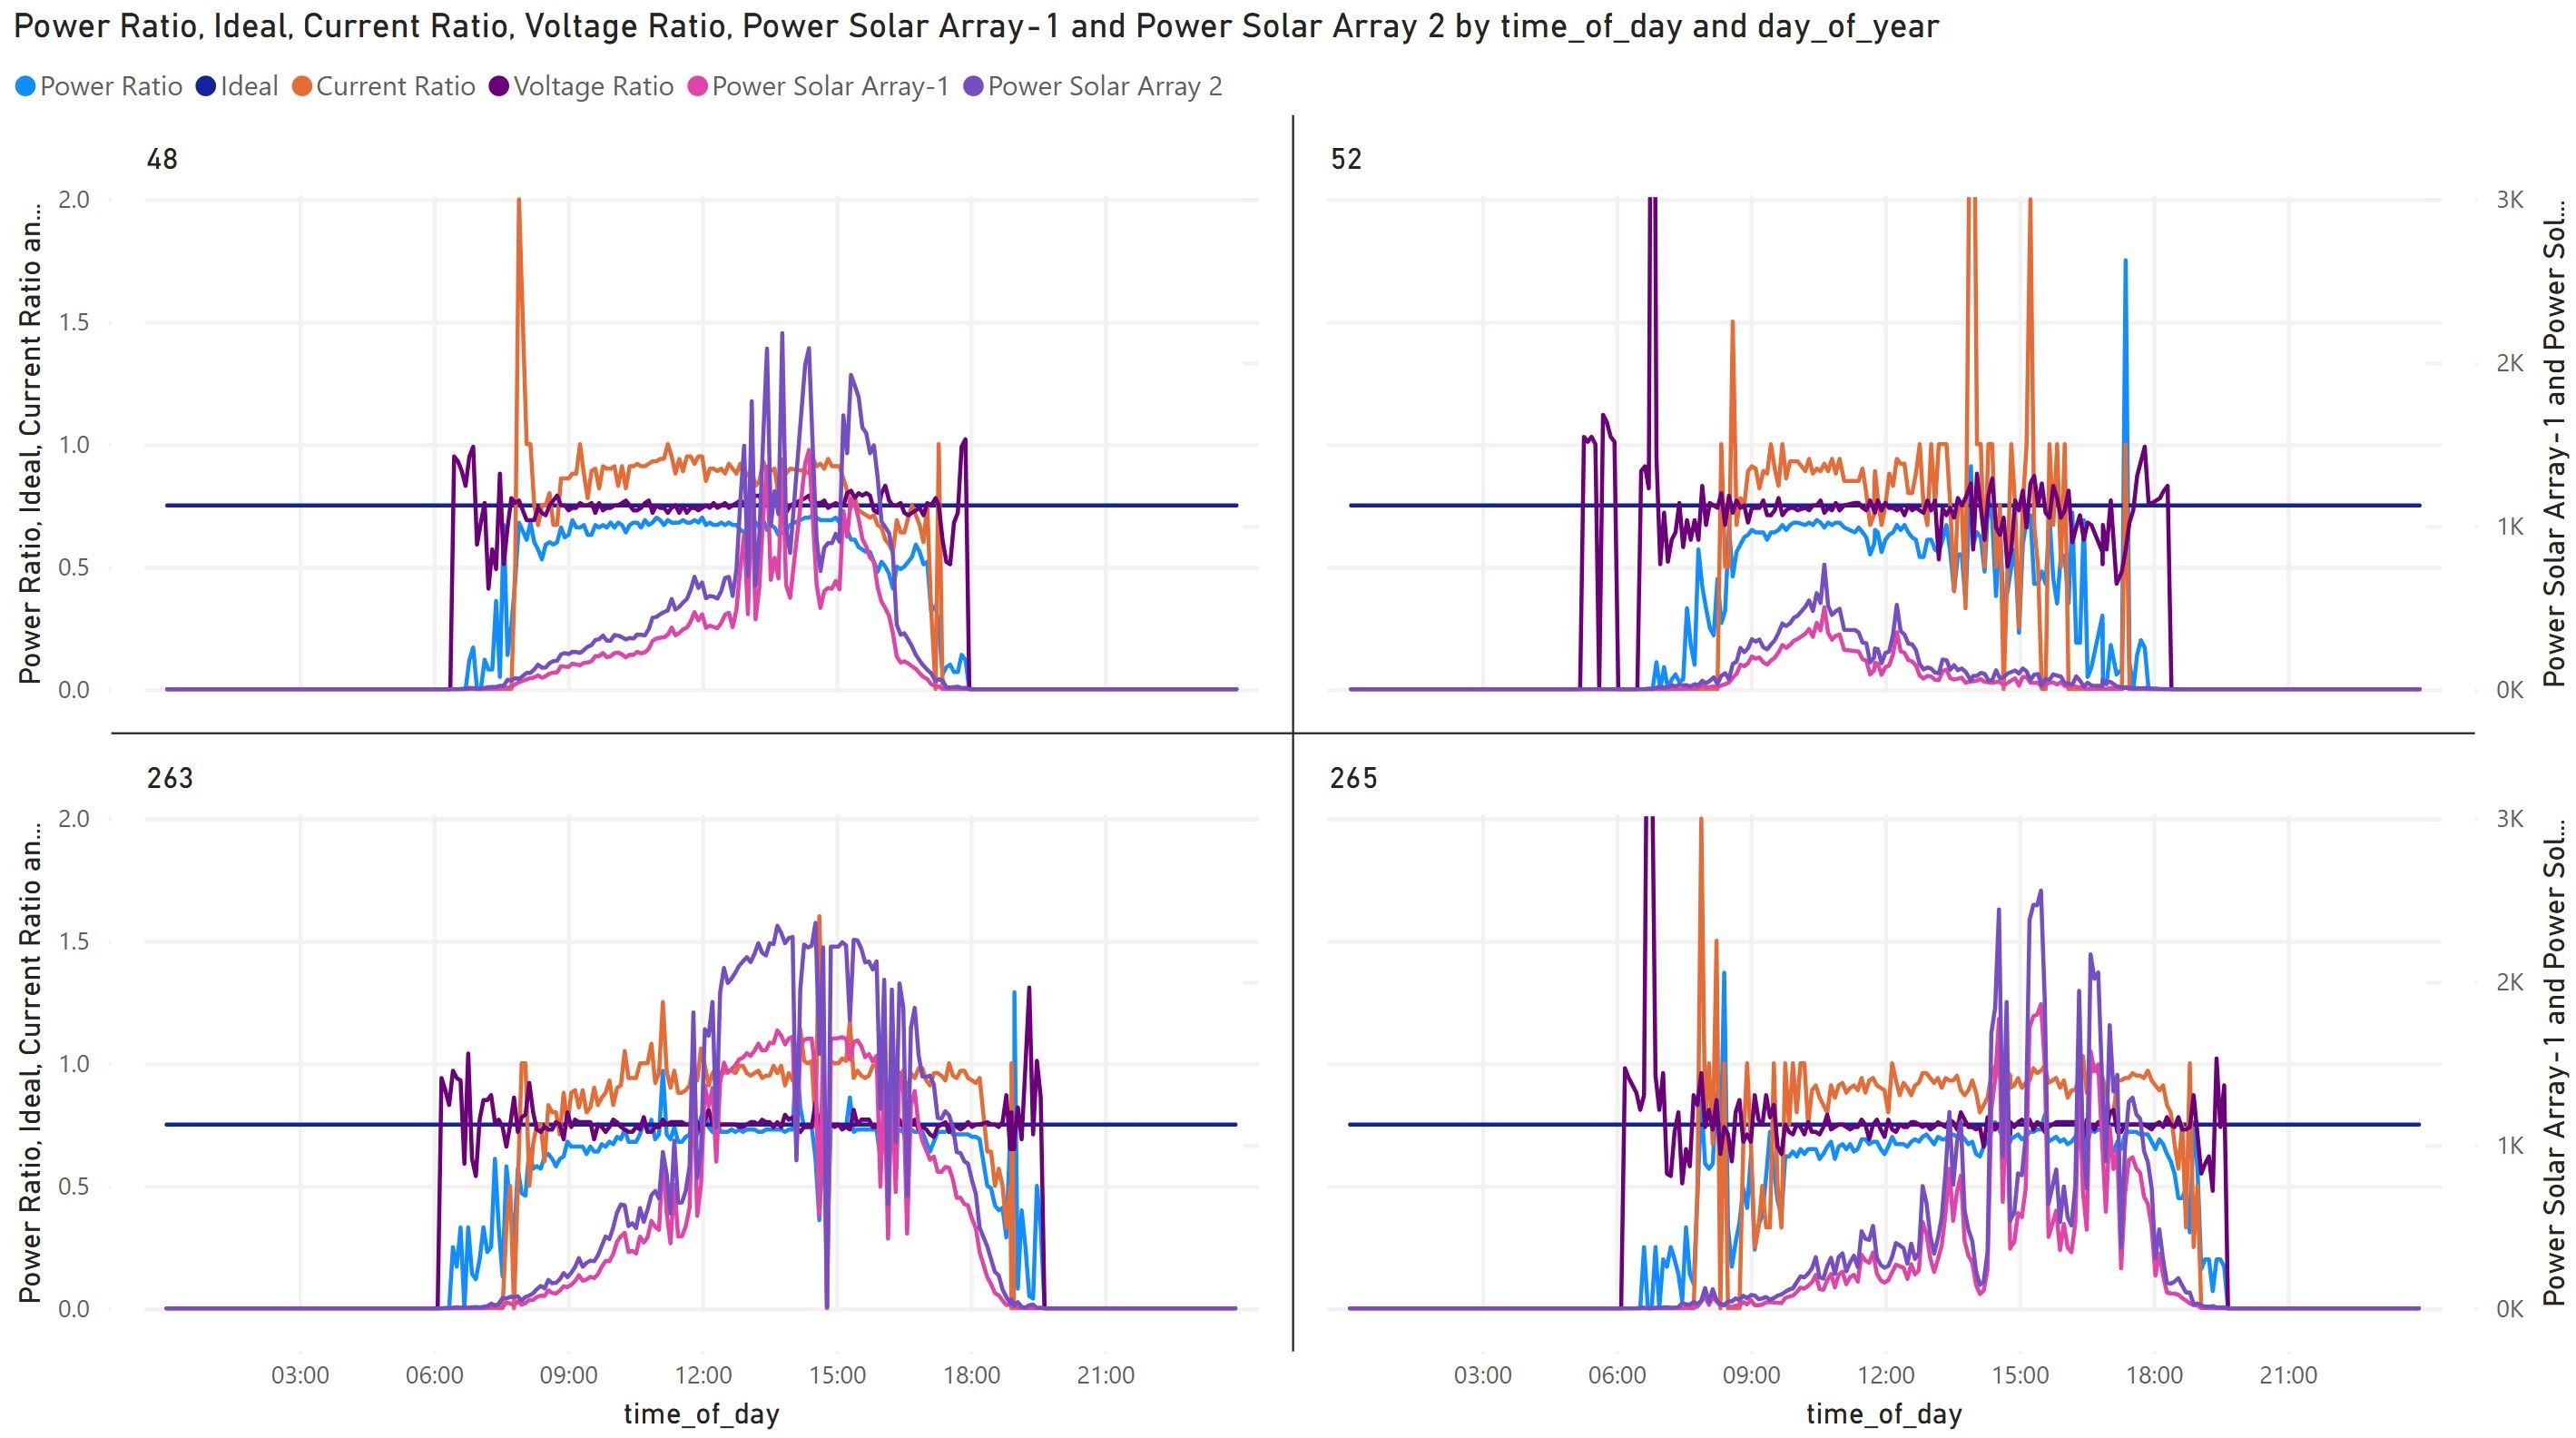
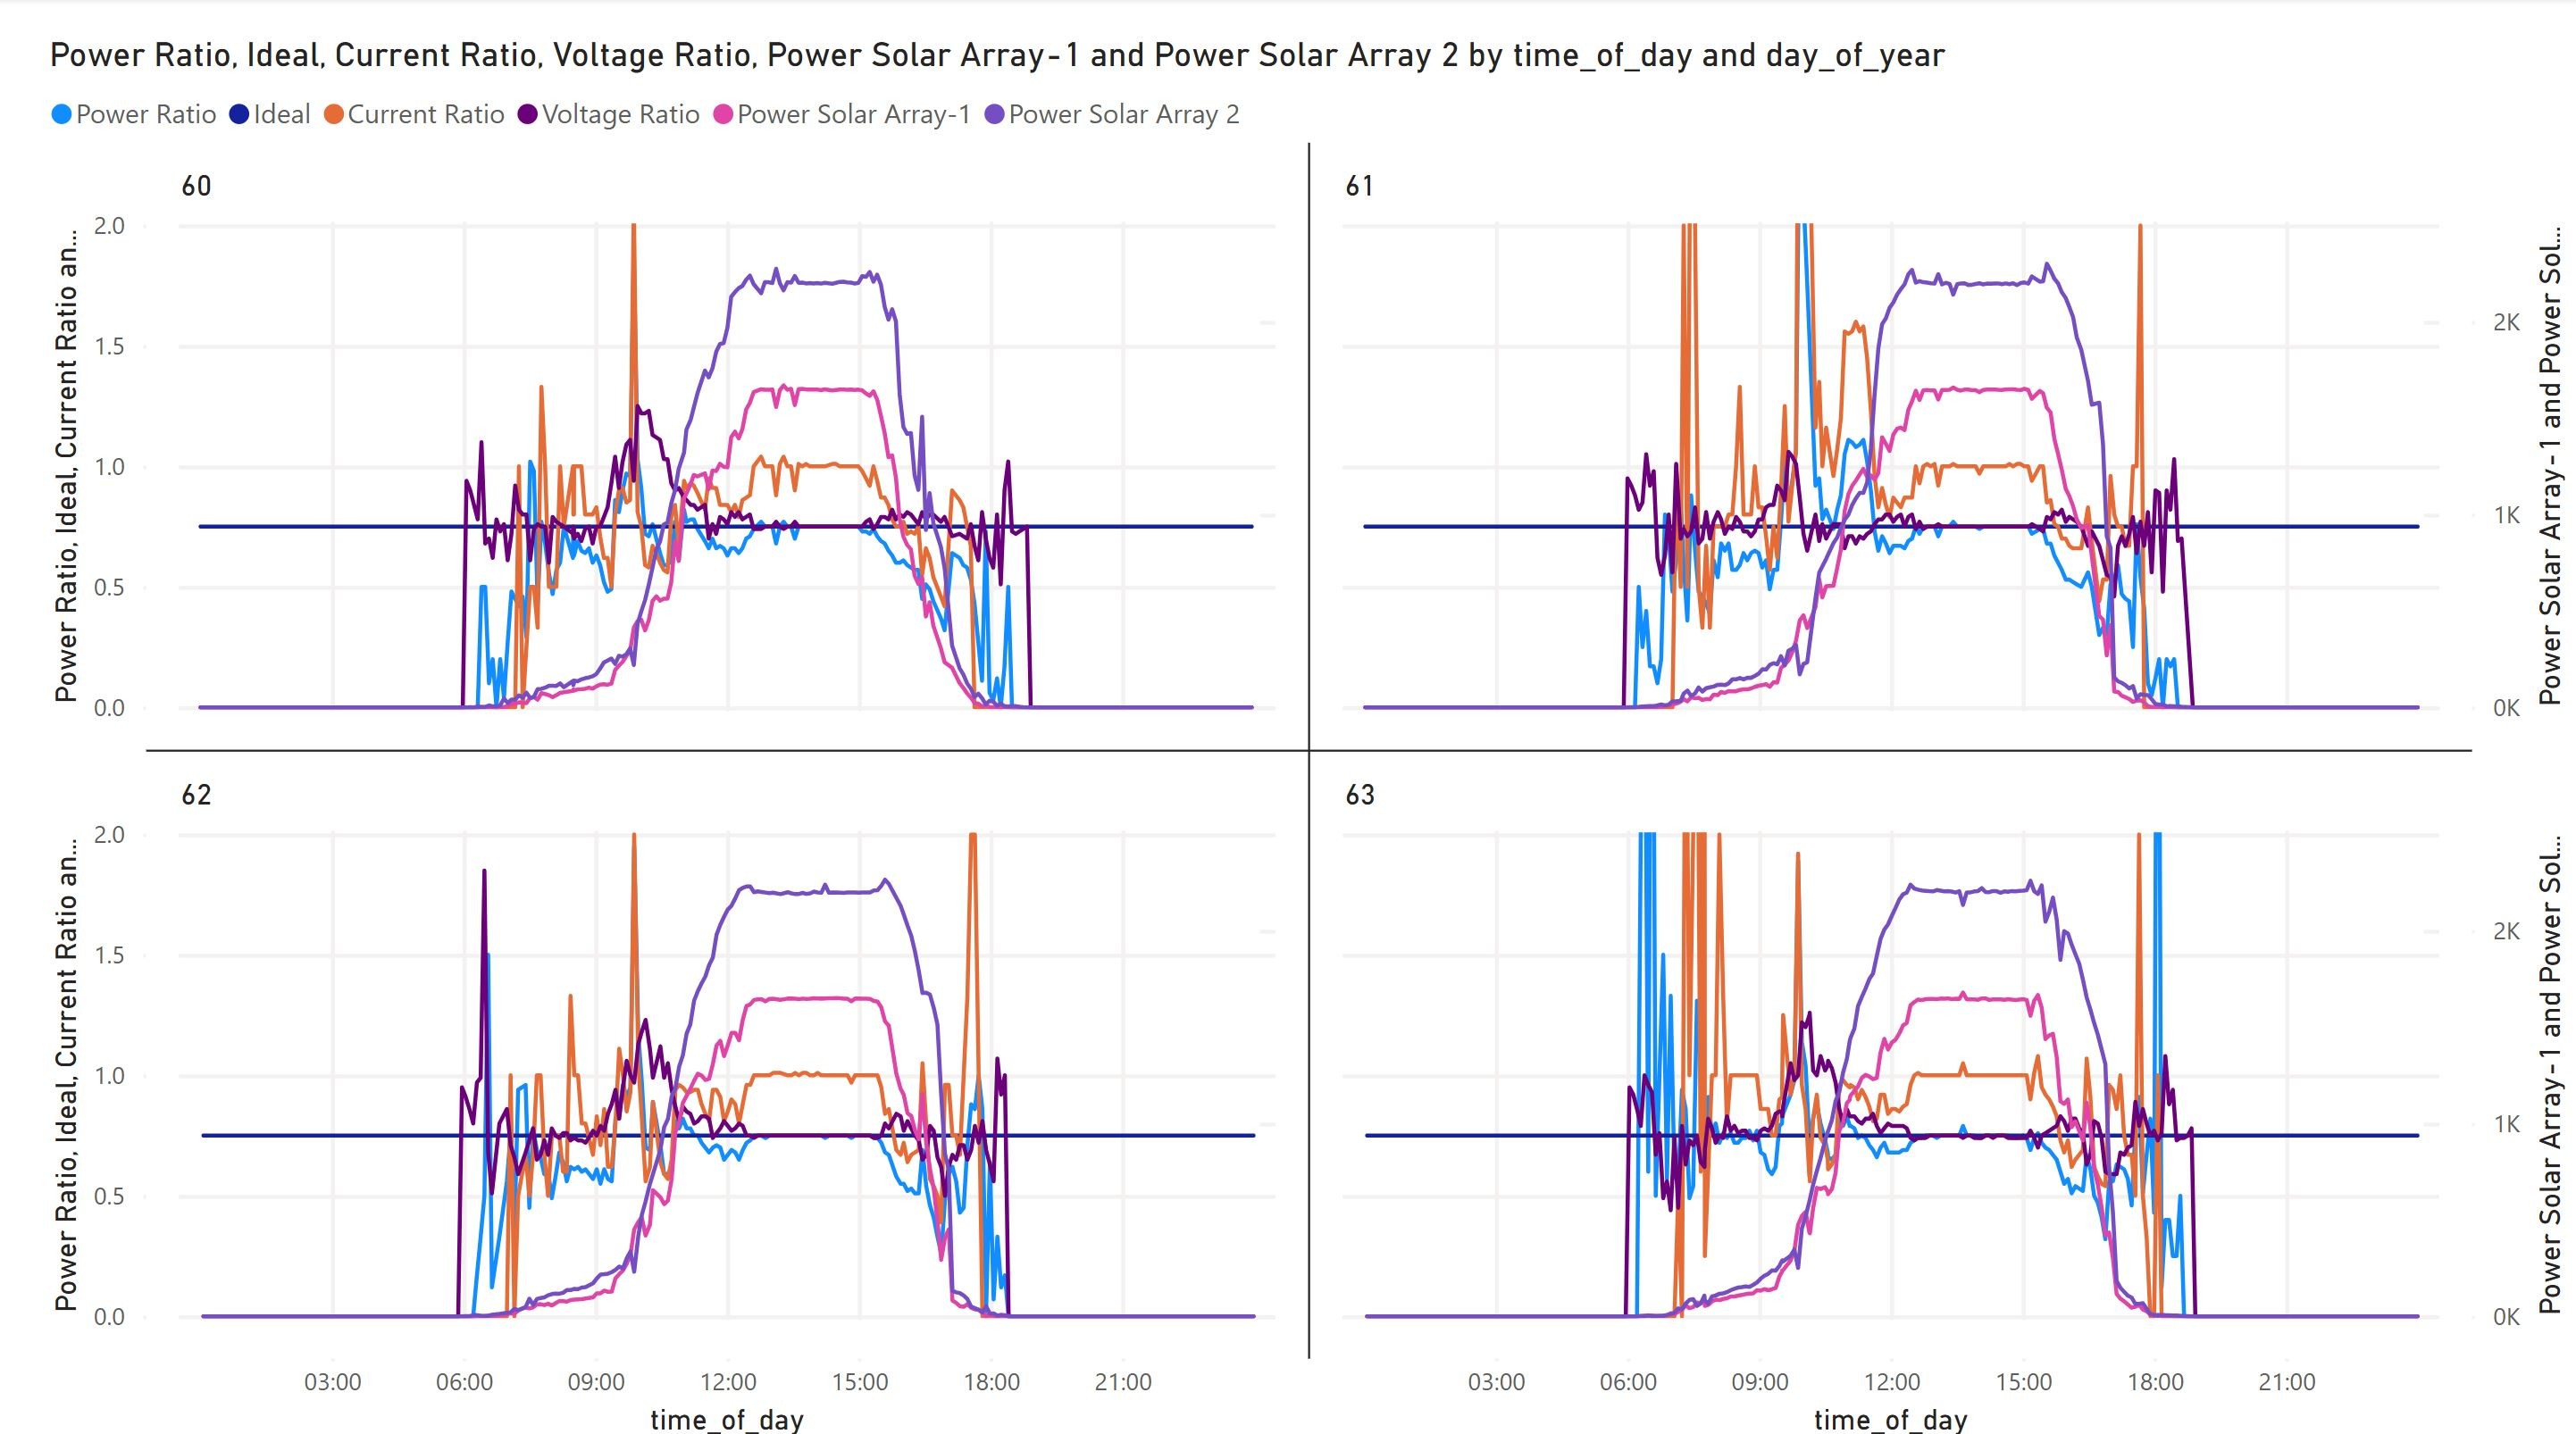
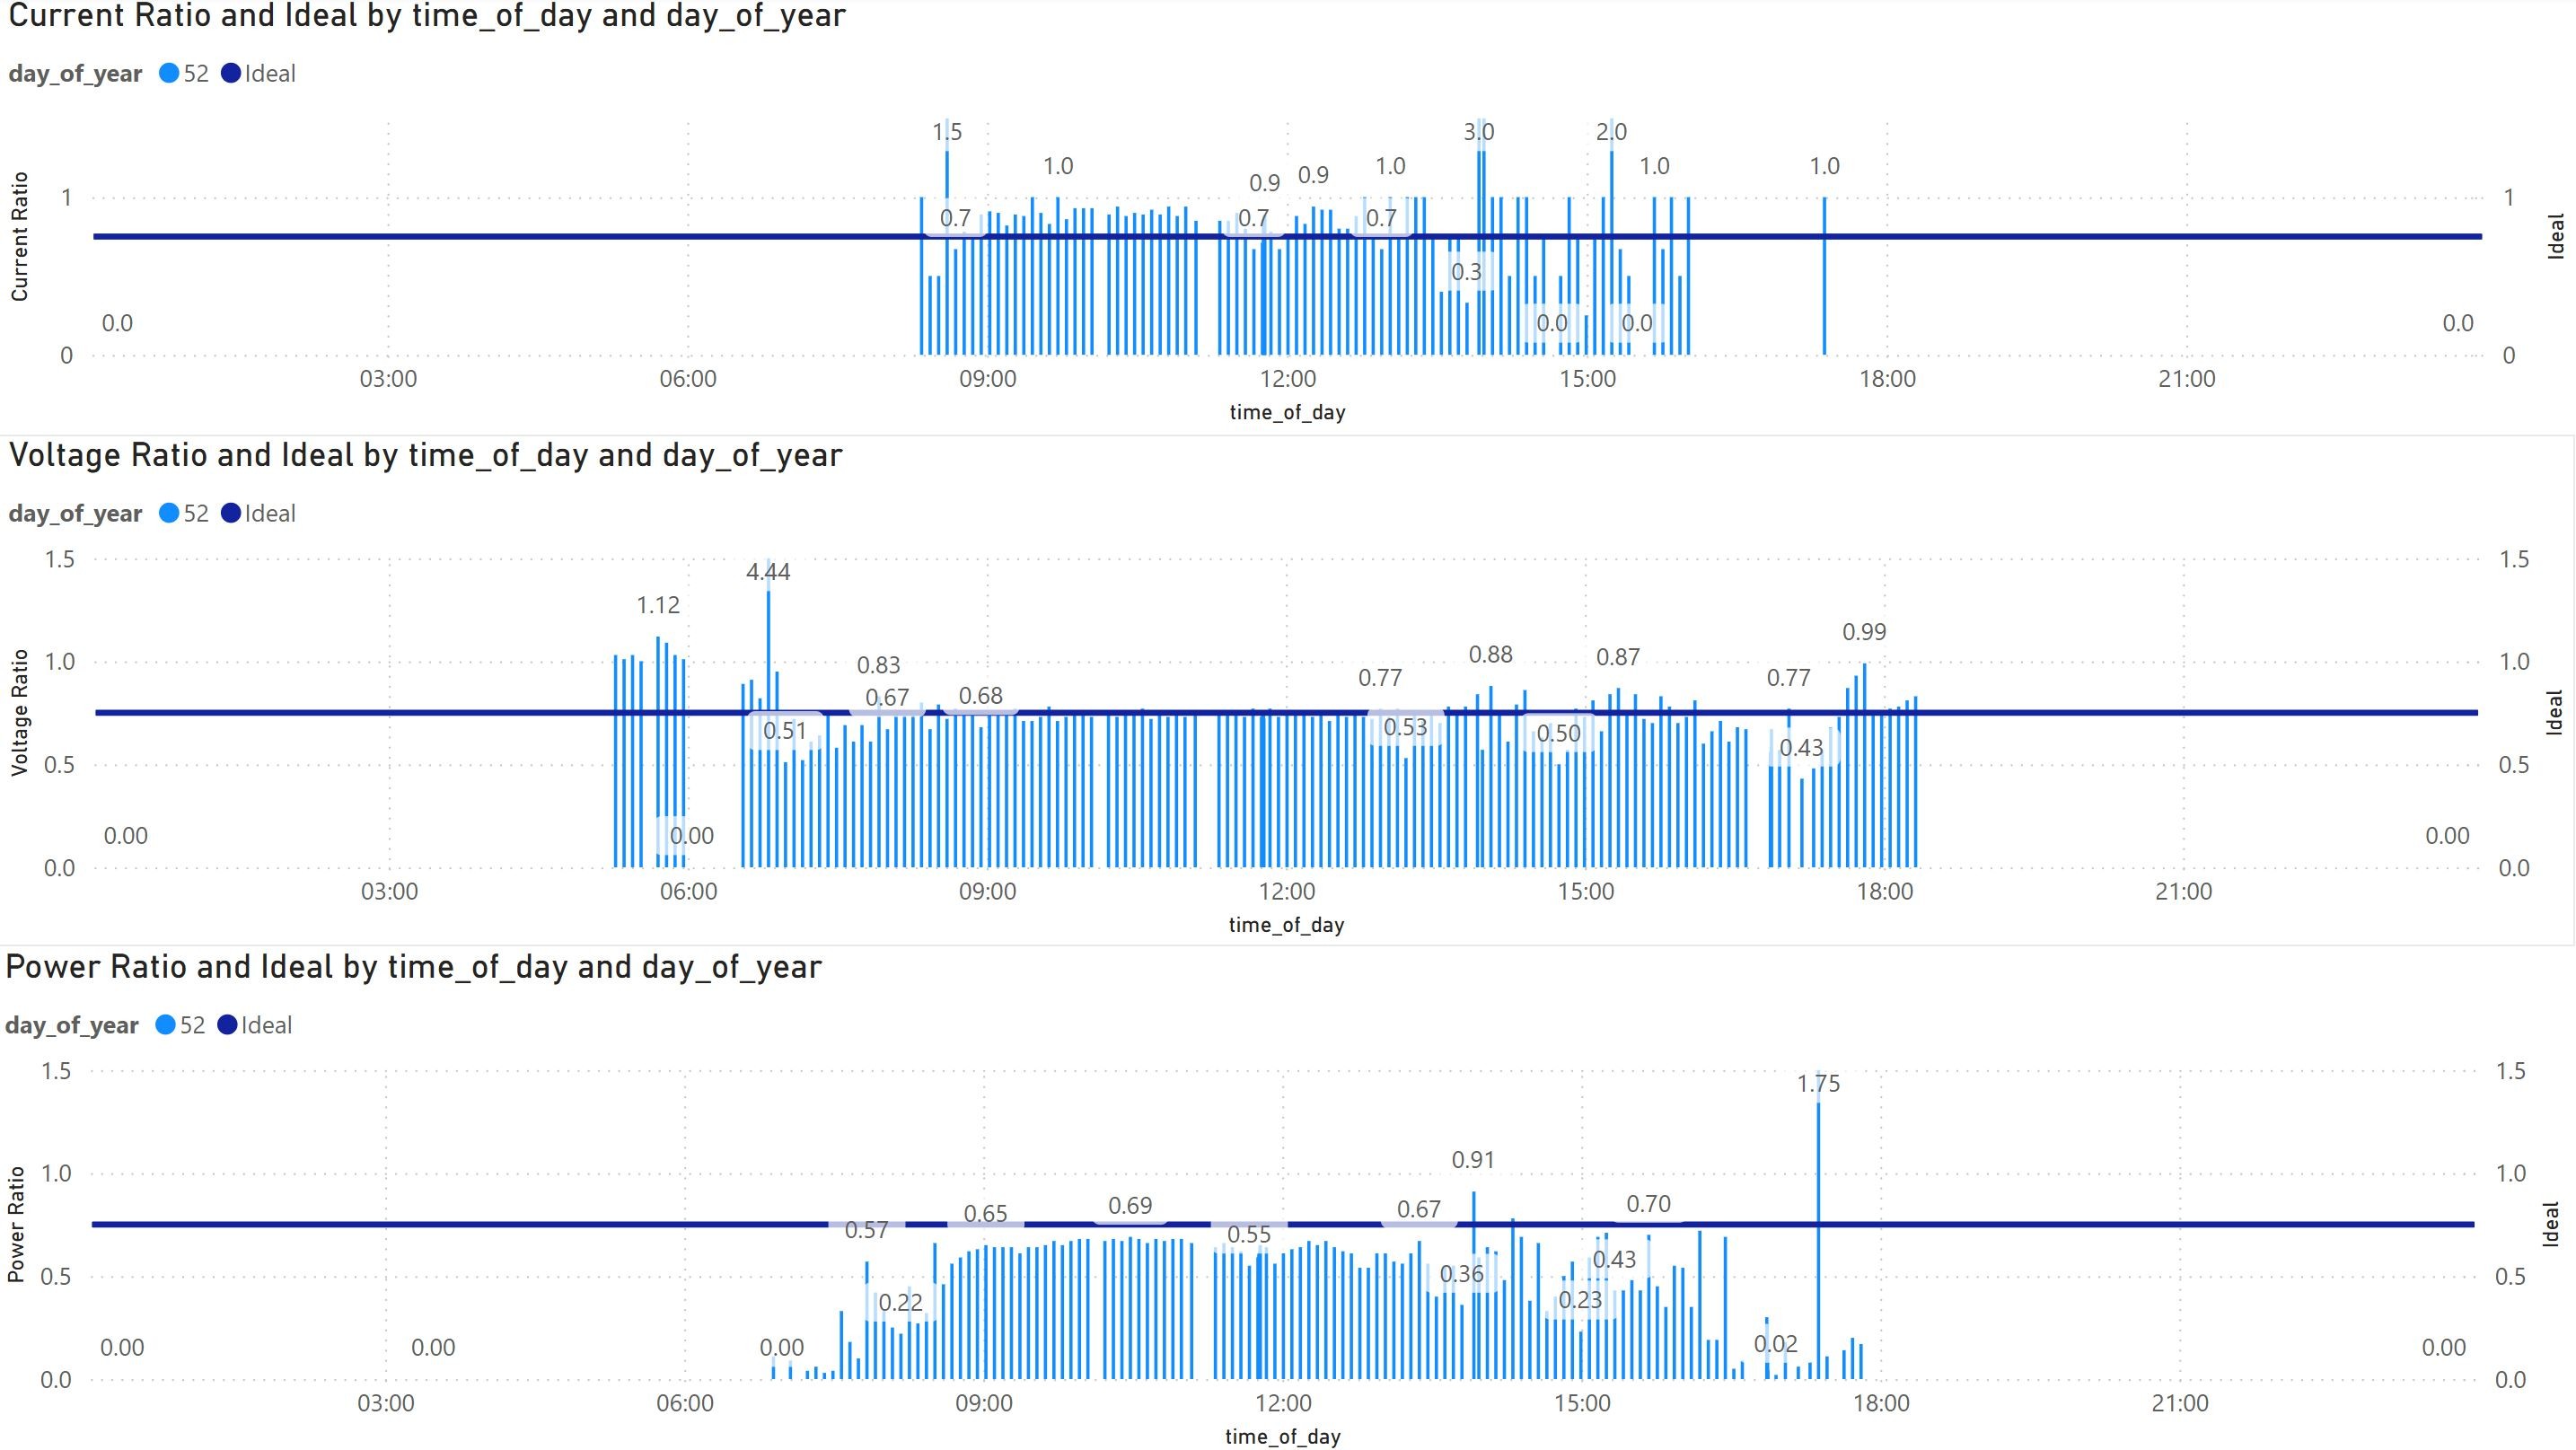
So, with some help from co-pilot i have a power query (you can use this in Excel or Power bi) which will pull your data from the cloud. I also have a query that then calculates the required ratios. So, i used power bi and with that you can compare different days. So here we have two days about 1 month after the inverter was replaced and two daya from this month. You could have a month's worth of days to scroll though if you wanted. The 2nd image just includes the sollar array power outputs (2nd y axis). And the 3rd image is each of the ratios on their own graph in a bar chart for day 52.

I will pop the scripts and a description of how you can use them into later posts.


#2 Maxwell

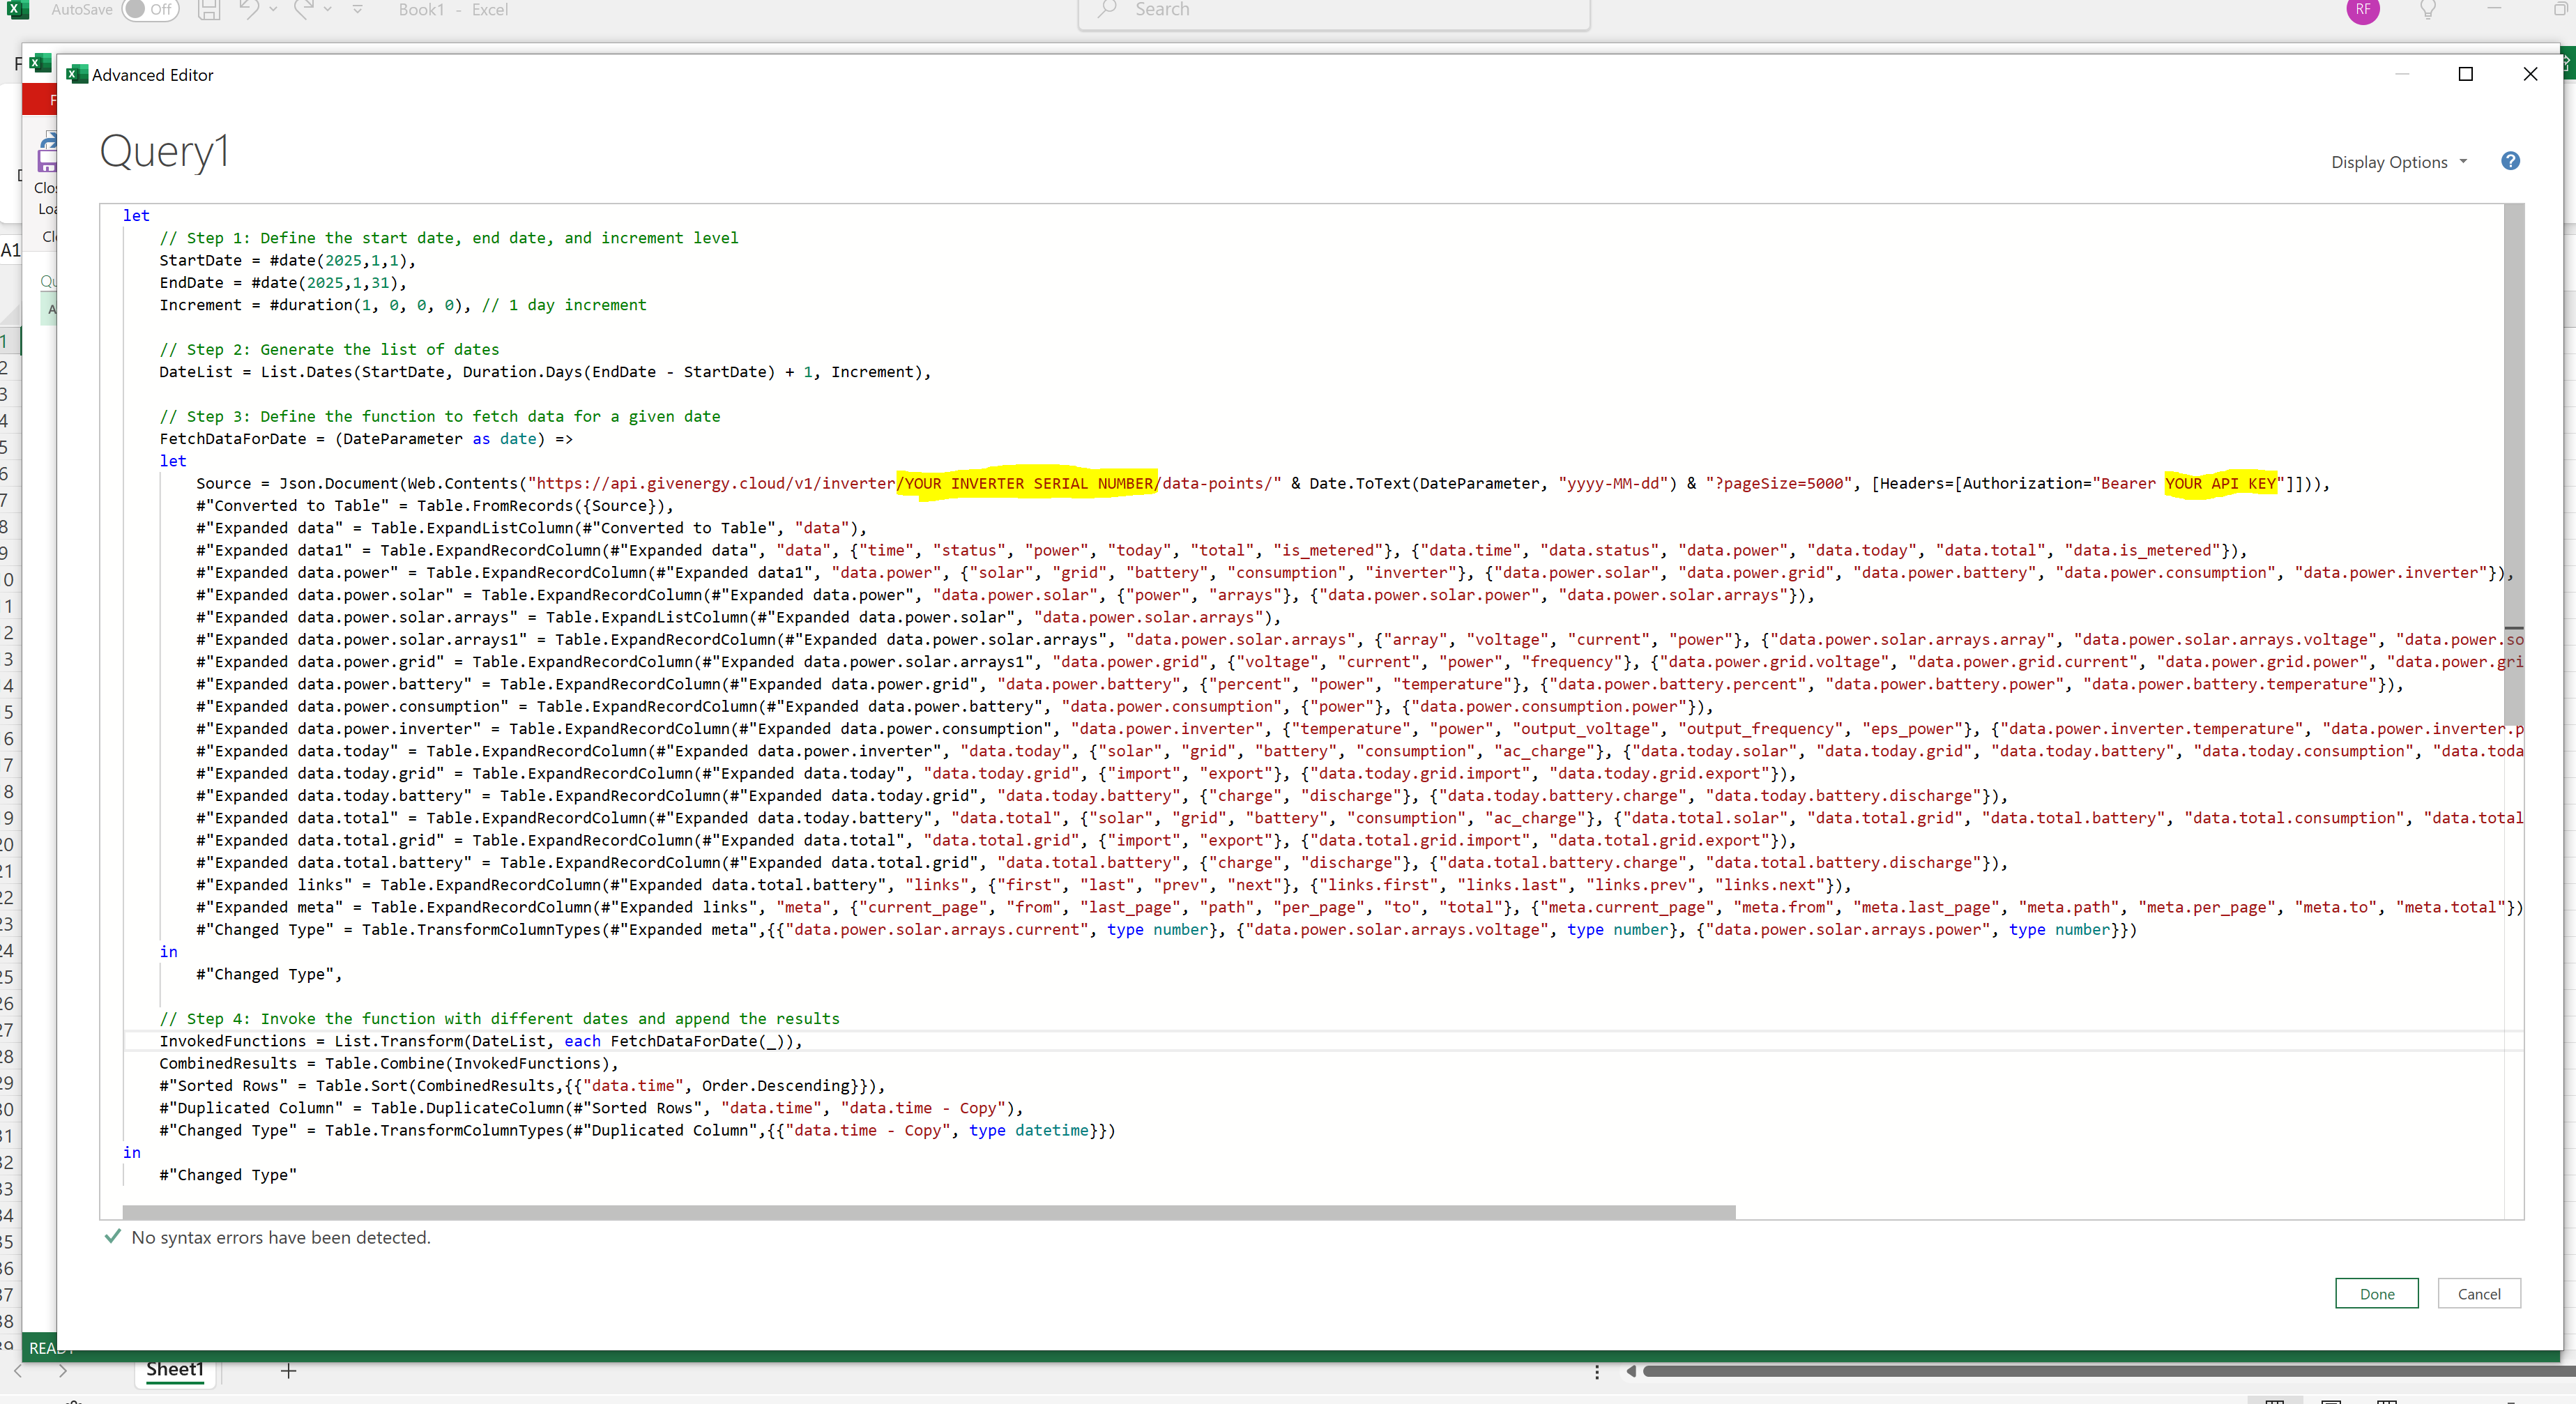
So this is the query that pulls the data back using the GE get data points api
https://givenergy.cloud/docs/api/v1#inverter-data-GETinverter--inverter_serial_number--data-points--date-

You will need your inverter serial number and an api token. And then put those into the query, simply replace YOUR INVERTER SERIAL NUMBER with yours and replace YOUR API KEY with your api token.

You can change the dates as required. In this case it pulls back data for the month of Jan 25. But you could make it for less. This script may not be the most efficent or optimal but it works and I'm sure that any of you power query ninjas out there may be saying i wouldn't have done it like that. But, if anyone has suggestions for improving it then great. And once you have the query set up you can delete columns you don't need.

get-data-query.txt
6kB
#3 Maxwell

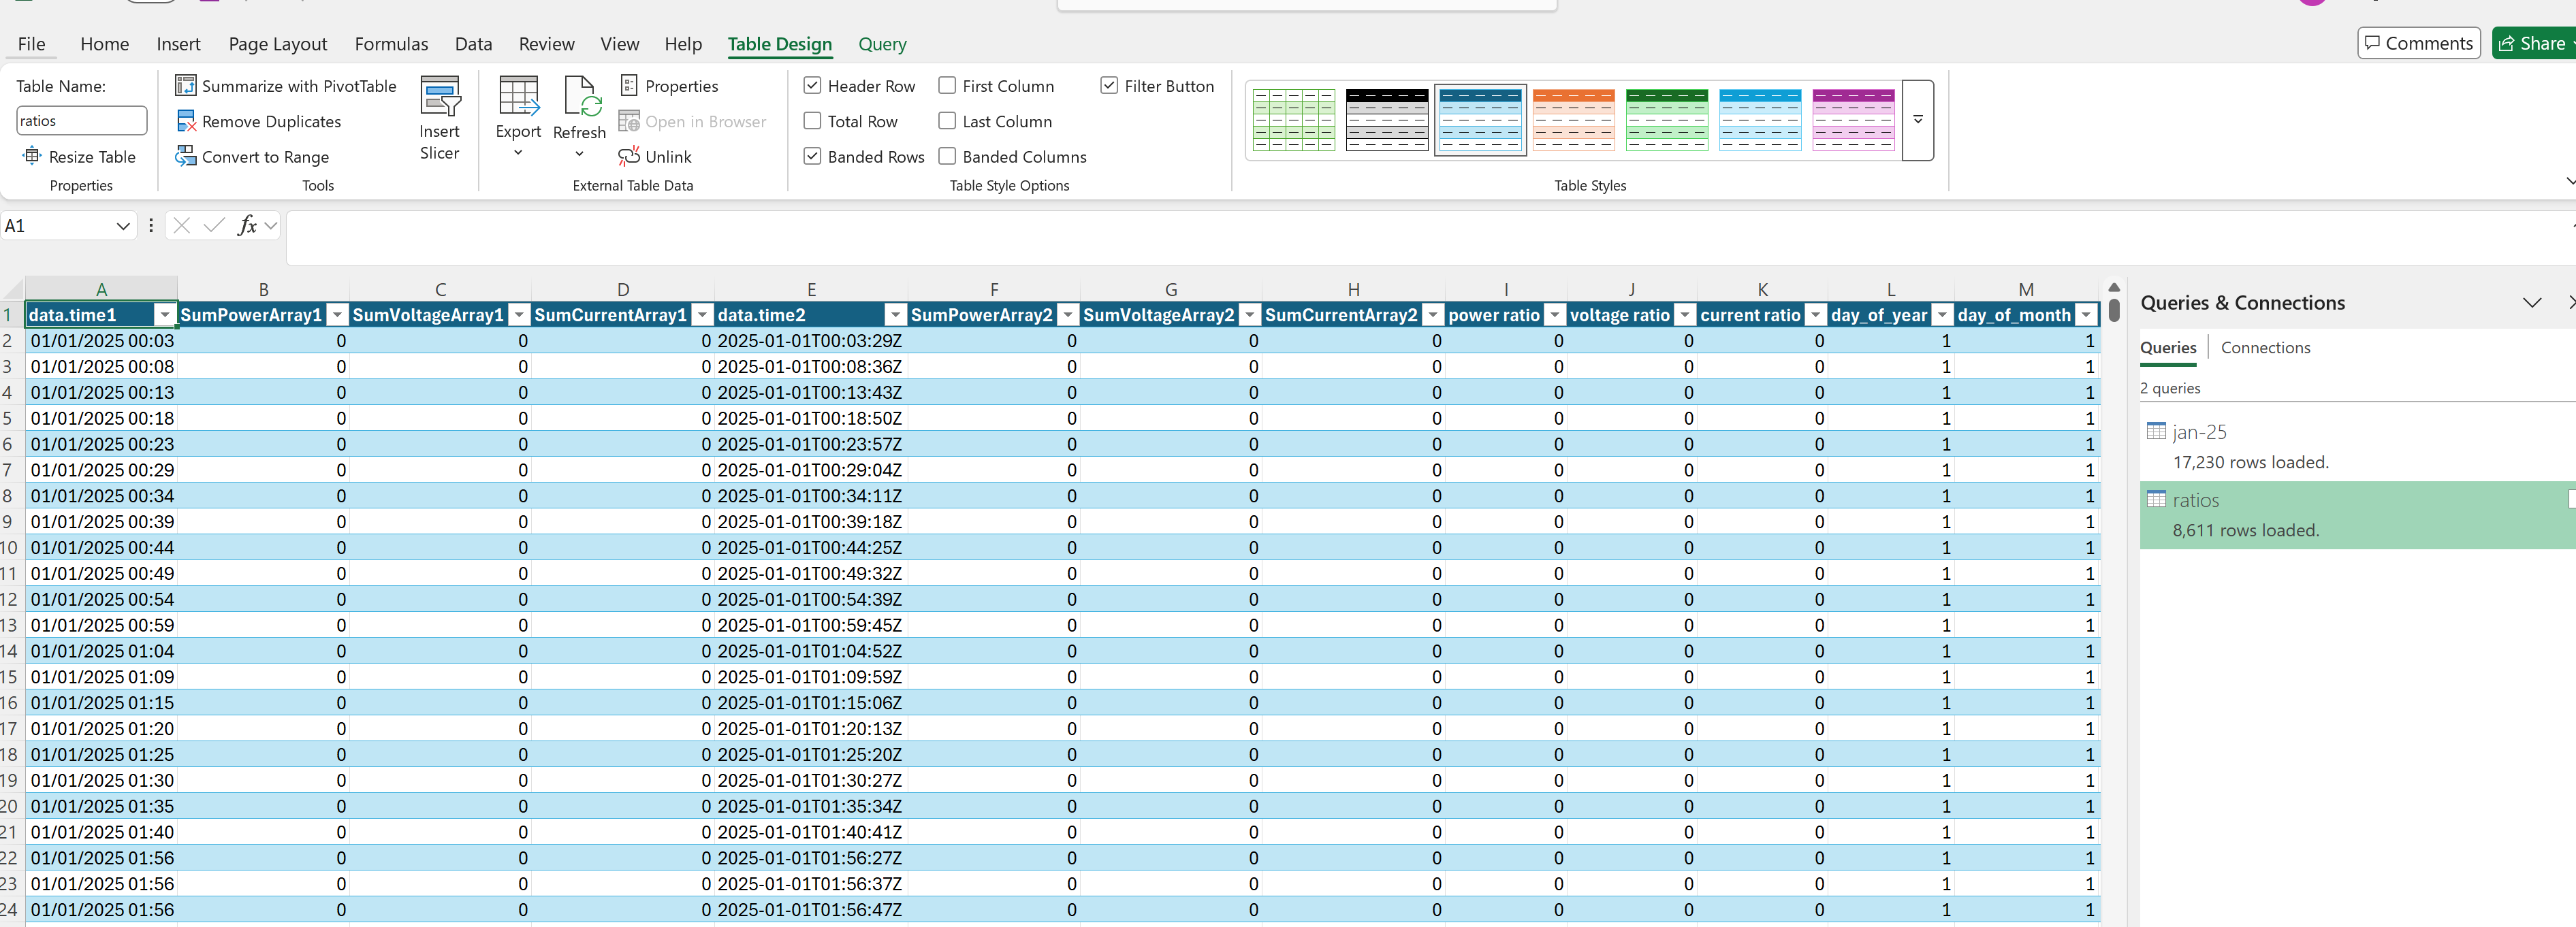
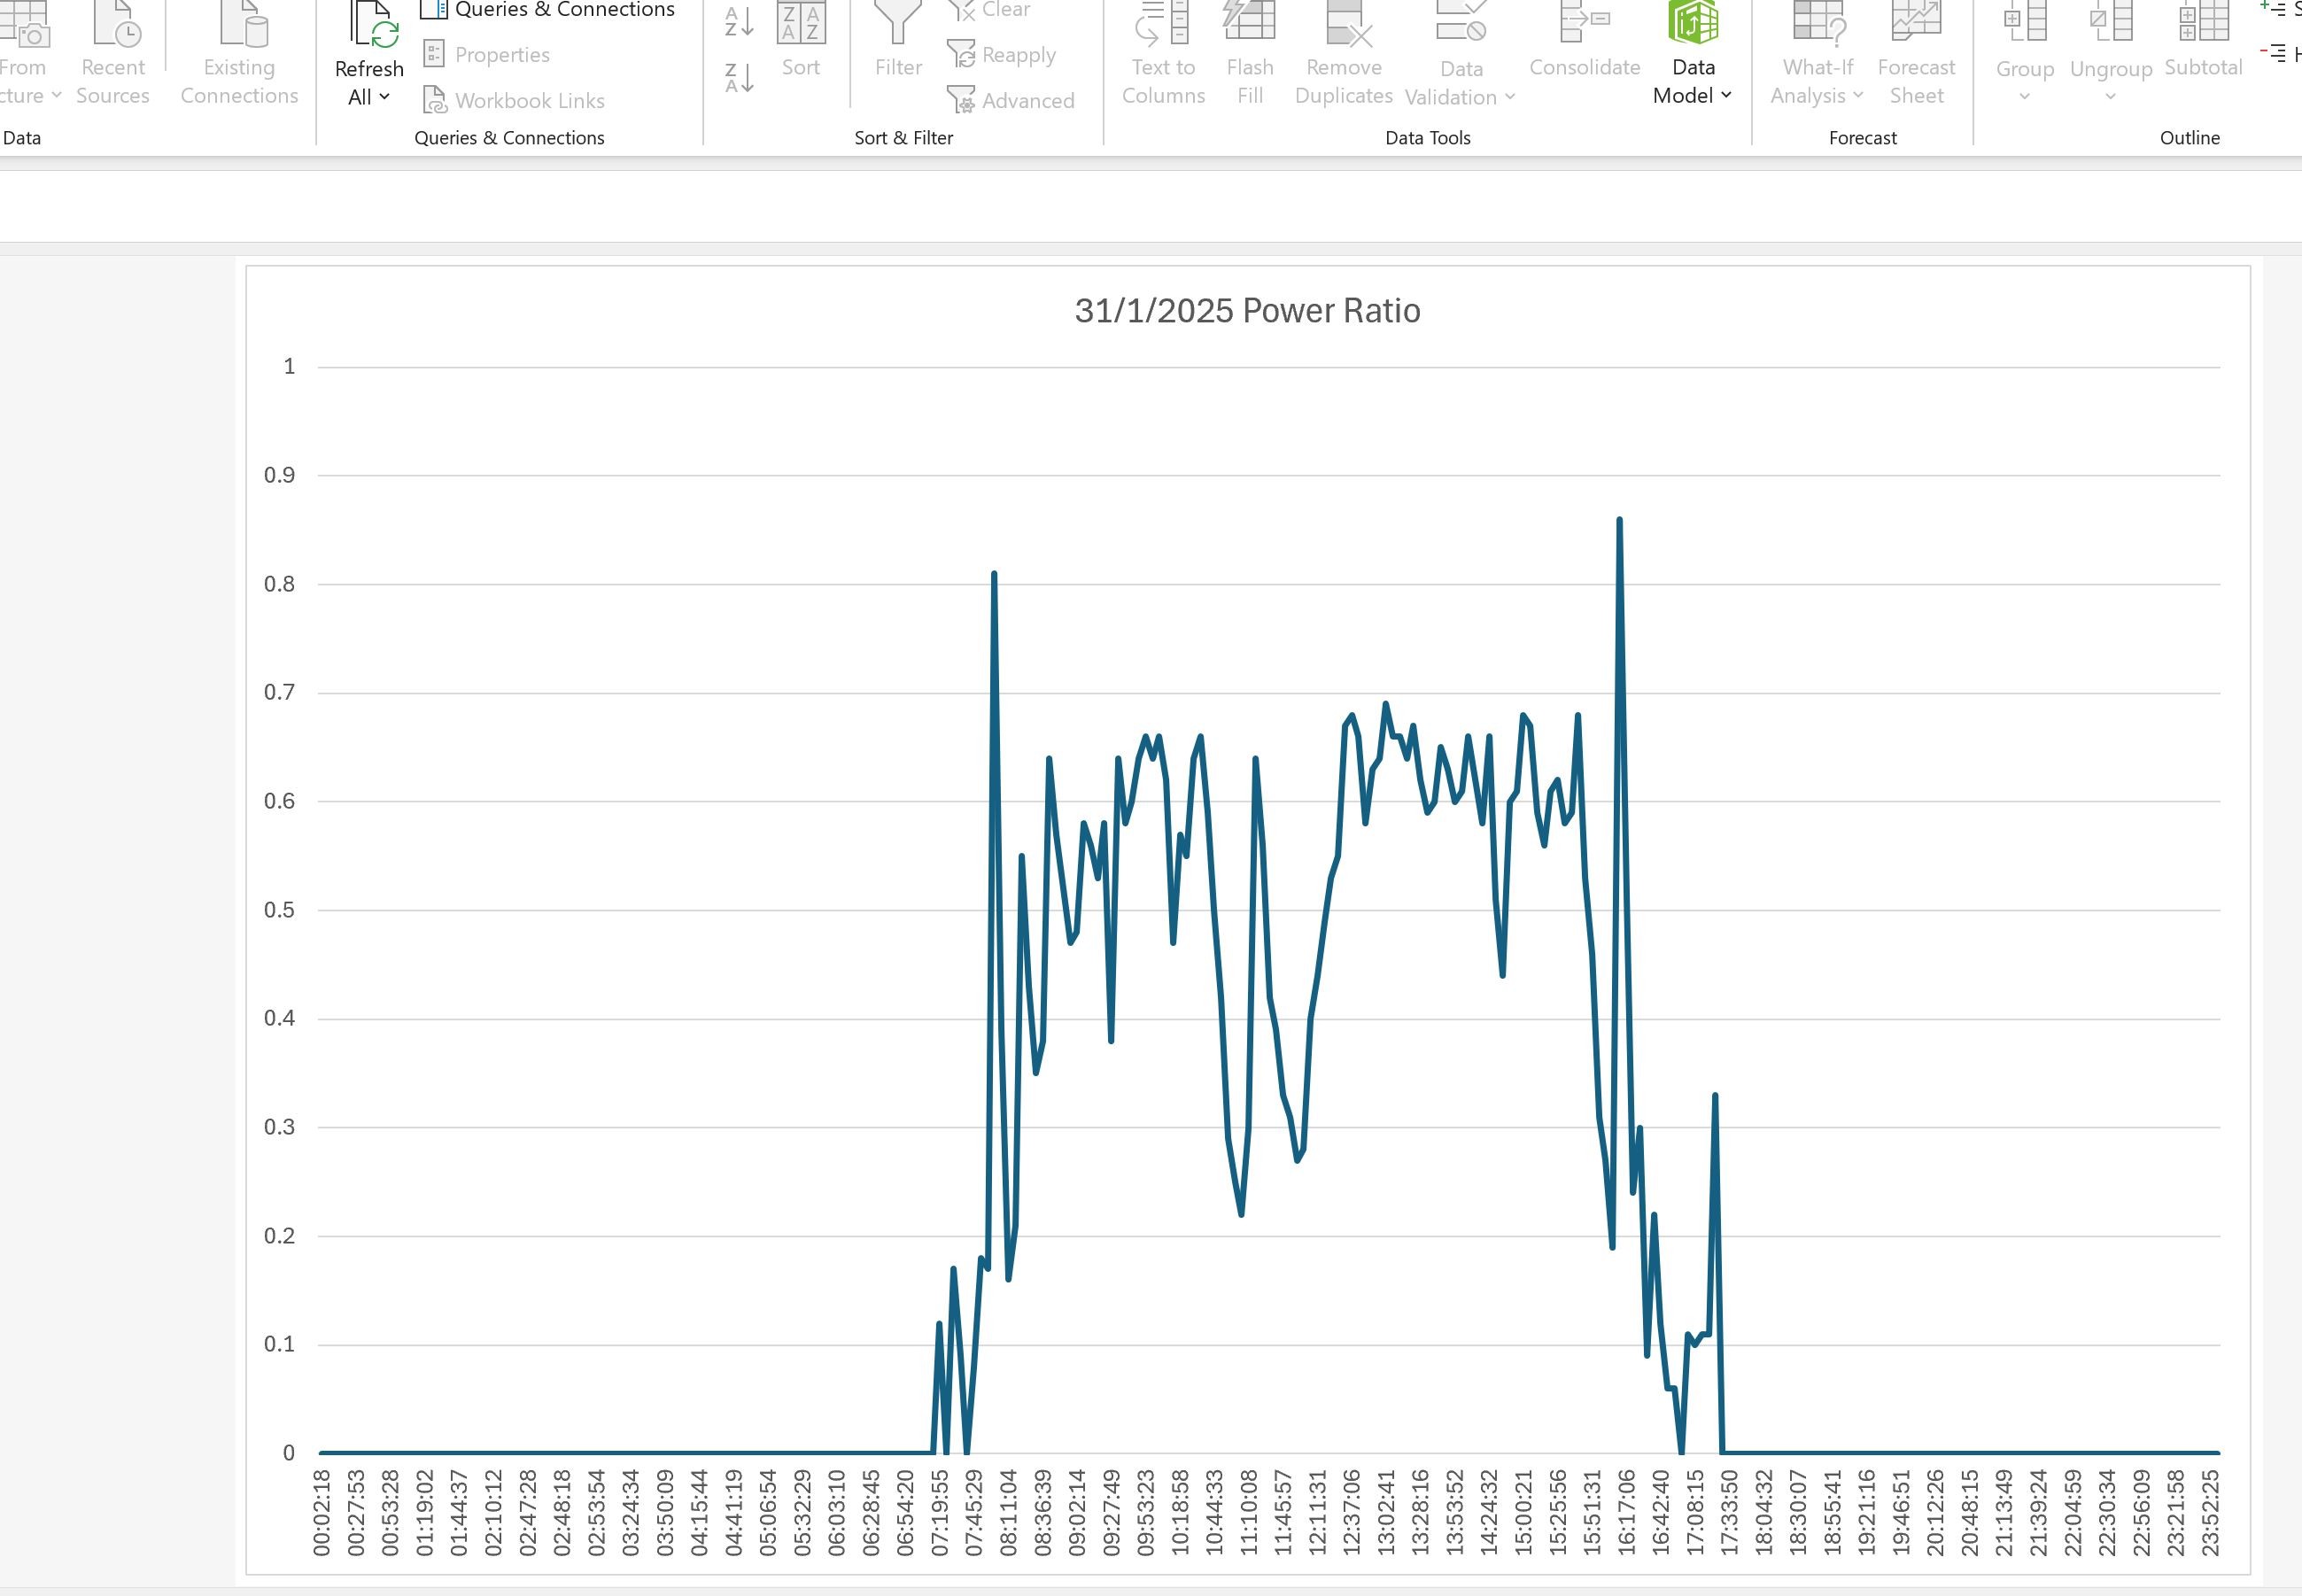
The query to calculate the ratios is here. In your query you will need to change the name of source table (2nd line of this query) to whatever name you have given the previous query that pulls the data back. So in this enclosed query my source table is called "results" and that is the name you need to change to match yours. And then an excel chart for one day's power ratio.

And when you run these queries for the first time (excel or power bi) you may get a pop up window asking you to select an authetication option. Just click on the anonymous option, your authetication is handled by your api token which is in the query.

.

calc-ratios-query.txt
4kB
G
#4 geoffreycoan

Maxwell Interesting, and great that you found the fault by looking at the data from your inverter.

Have to admit I have just assumed that the inverter was working fine and in Home Assistant that I used I disabled the PV voltage and current entities coming from my inverter, expecting that I would only ever look at the PV power.
Might need to re-enable them to look at my own data

Clever use of the givenergy API to pull it into Excel/Power BI.

I tried to look at your spreadsheets but on my ipad they just loaded with an error “ {"errors":[{"status":"500","code":"unknown"}]}” - possibly because it tried to execute the code rather than open the file??

Could you share the formulae you used so I can try recreating in Home Assistant

Cheers

#6 Maxwell

Looks like with the last several days of good sunny weather and we are getting back to that 0.75 solar power ratio when the sun is on the panels. Today is day 64, will pull that data tomorrow.