The National Grid Interactive map

13 comments started 2025-03-13 last 2025-04-12
GivEnergy Products
R
#1 Rbor

The national grid
This is a link to an interactive map showing the national grid, both present and planned: https://openinframap.org/#6.5/54.747/-3.25

I find this fascinating. You can zoom in to pick out any area in detail, right down to individual houses. The map shows sub-stations, every wind turbine and solar farm.
And you can zoom out to see the whole country with interconnects with Europe and beyond.
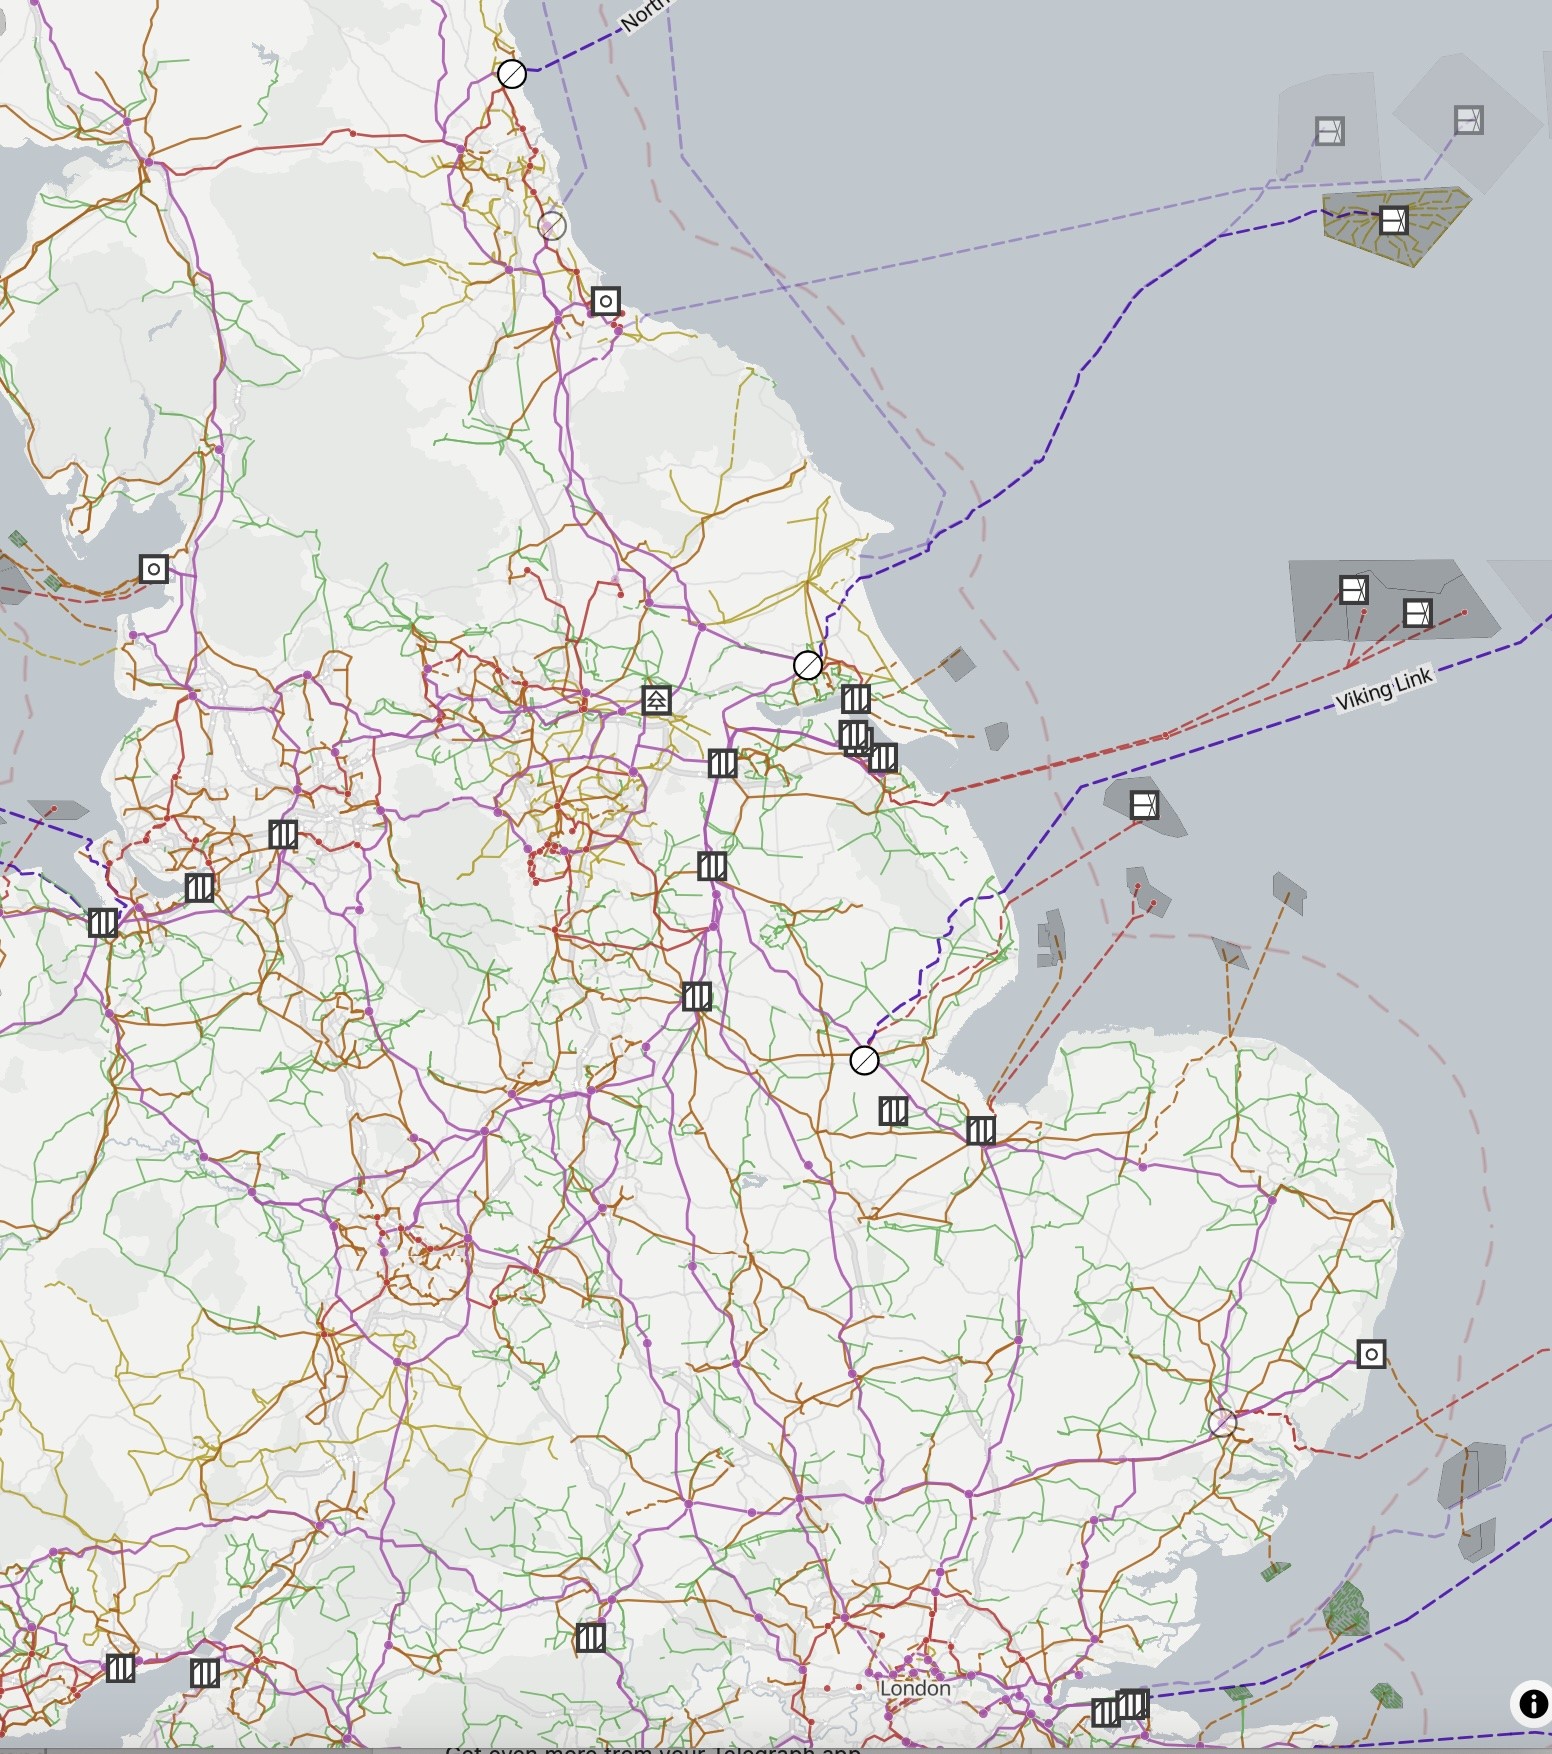
Here is one snapshot:
Rob


#2 Tenkaykev

Rbor
Interesting in that it shows solar PV installs but none newer than about 5 years ago. I think the local council fitted solar PV to their housing stock several years ago and these are the ones that are showing. There are several houses that I can see have solar pv but don't show on the map.

L
#3 Leeshore

Just added my PV system....

R
#4 Roy124

[unknown] how did you do that?

G
#5 geoffreycoan

The map is really interesting, shows a lot of detail, but some of it is a bit weird like 11kV lines starting and stopping seemingly in the middle of nowhere.

The solar map seems weirdly incomplete as well, there's several solar installations showing in my village, but not mine (and I have two installations, one 2016, one 2023). One of the neighbours opposite is showing but not the other. The Lidl about 8 miles away is about 2 years old and their installation is shown, but not my son's work that's 9 months old. And if I look at Huntingdon where my son works its a solar ghost zone with not a single home PV installation showing.

But is interesting nevertheless

#6 miffy

I just zoomed in to where I live. Almost opposite my house is a small local substation that's been there donkey's years, however it's not shown on the map. So the map must only show things over a certain size, perhaps to reduce the chance of anyone who doesn't know the area doing something nefarious. Security by obscurity?

#7 PianSom

The source of the data on the map is "crowd" - so if someone has put the data in then it's in there. It may not be complete, nor even accurate, but someone put it there.

Some data - especially regarding large infrastructure - may have a reputable source. But other data is just dependent on what the individual responsible put in. By clicking on an item you can see who submitted the data and when.

L
#8 Leeshore

Roy124 just created an open maps account and then edited the site by adding in a PV installation

L
#9 Leeshore

Roy124 just created an open maps account and then edited the site by adding in a PV installation

W
#10 wrighar

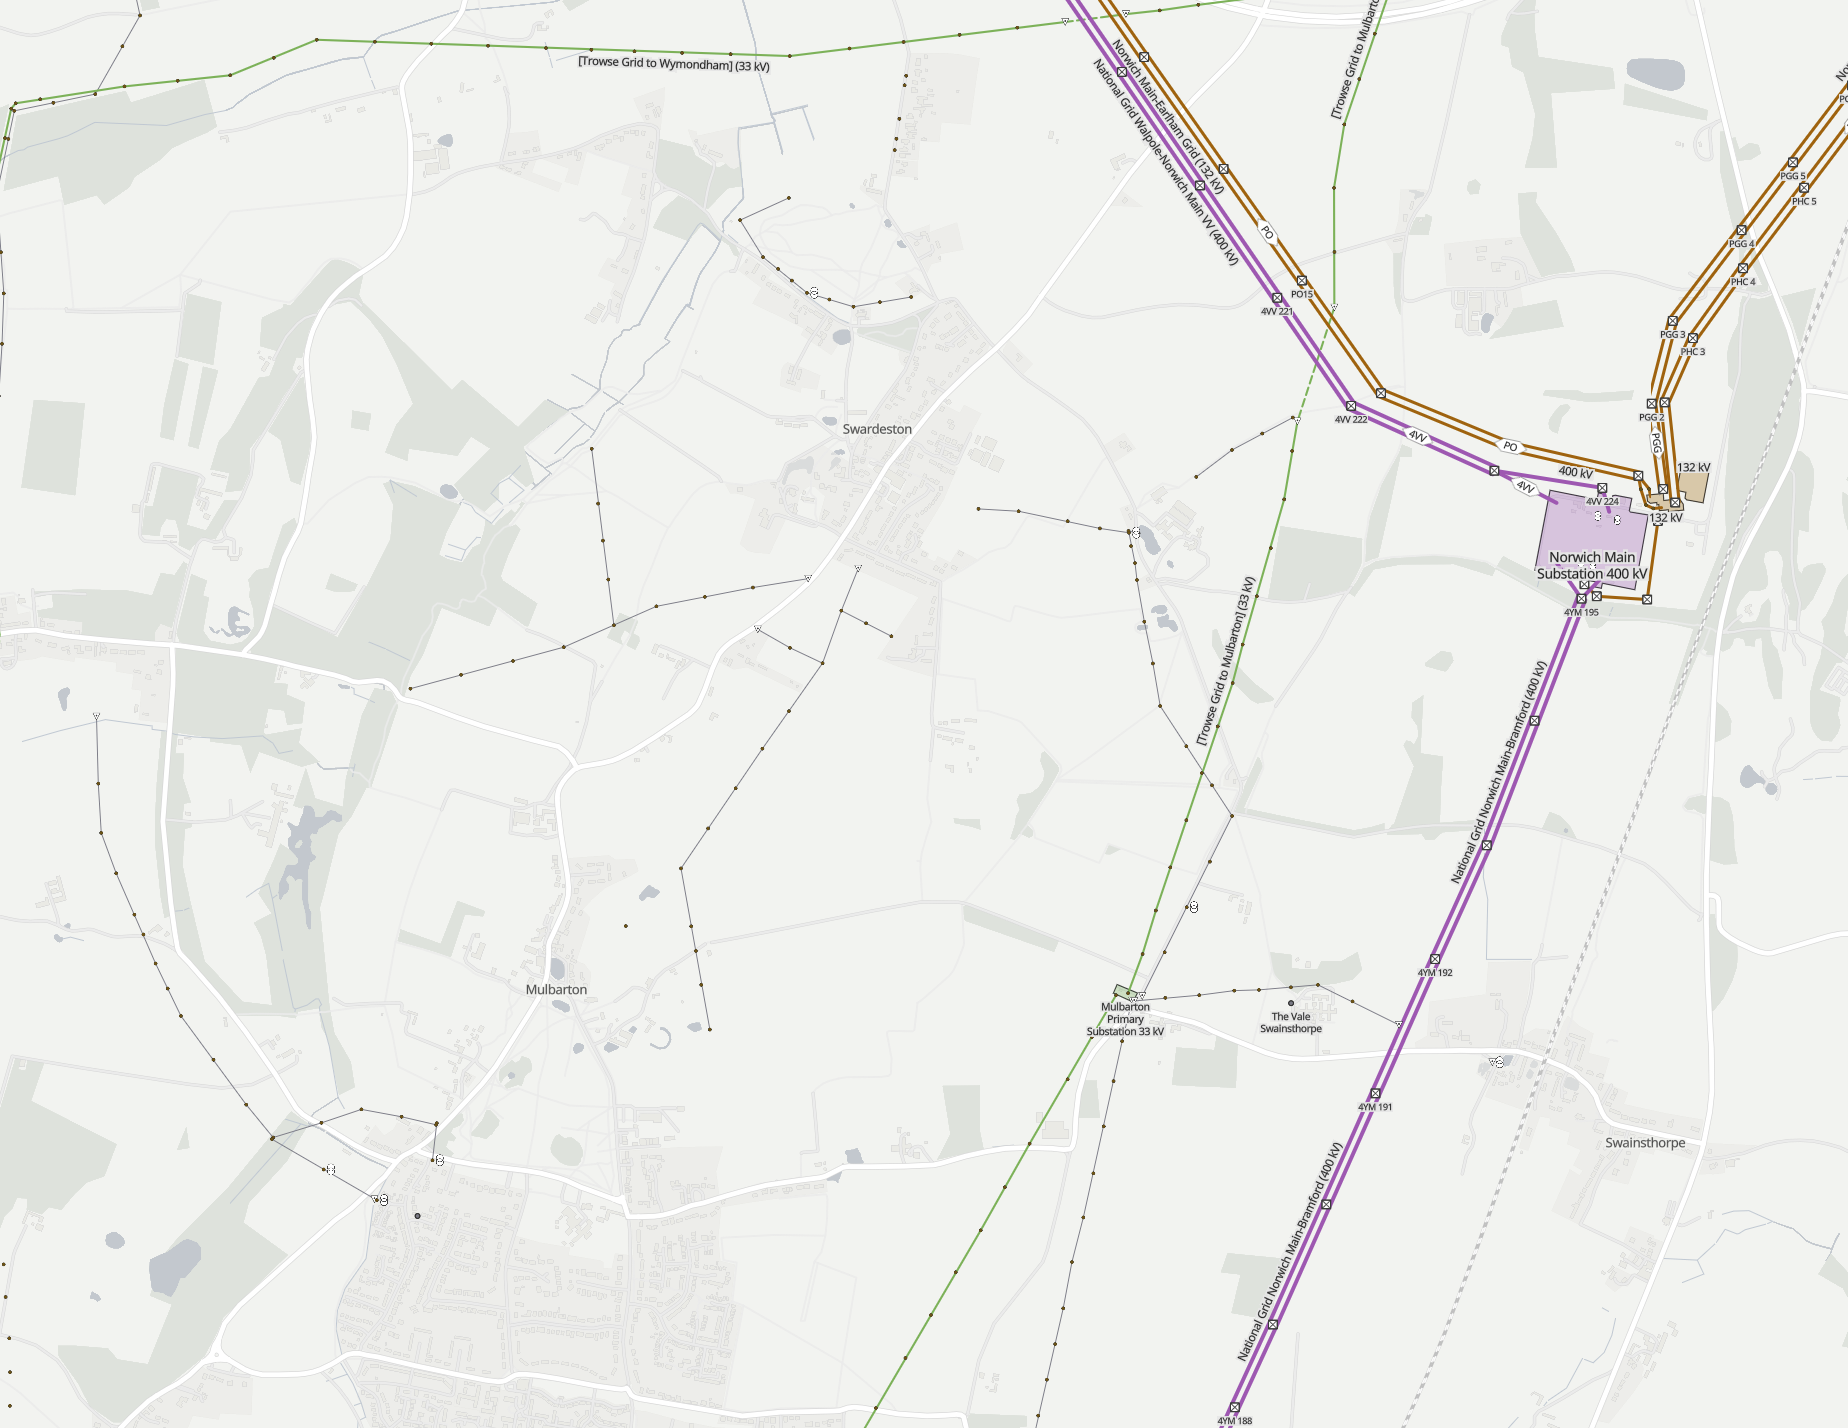
Near me, plenty of Infrastructure:

But missing
The planned Norwich main Substation to Tilbury 400KV lines
The hornsea off shore windfarm onshoring Substation
The new 700MWh battery storage
Several planned multi acre solar farms.
All should be in this picture:

#11 hoggy

nobody knows this yet (well you lot now do) but TerraVolt is having a bit of a facelift in the background - one thing it includes is a live map with live generation data which may be of interest when its done.

R
#12 Rbor

hoggy I look forwards to your updated Terravolt. I visit the site regularly.

This is the source URL: https://openinframap.org
If you look at the options top left, you can find out more about the project and how to add your own energy source.

See also:
https://github.com/openinframap/openinframap

It made me wonder whether the UK really knows how much energy is potentially available.

PS. It looks like I named this discussion thread incorrectly, assuming another source!

Rob