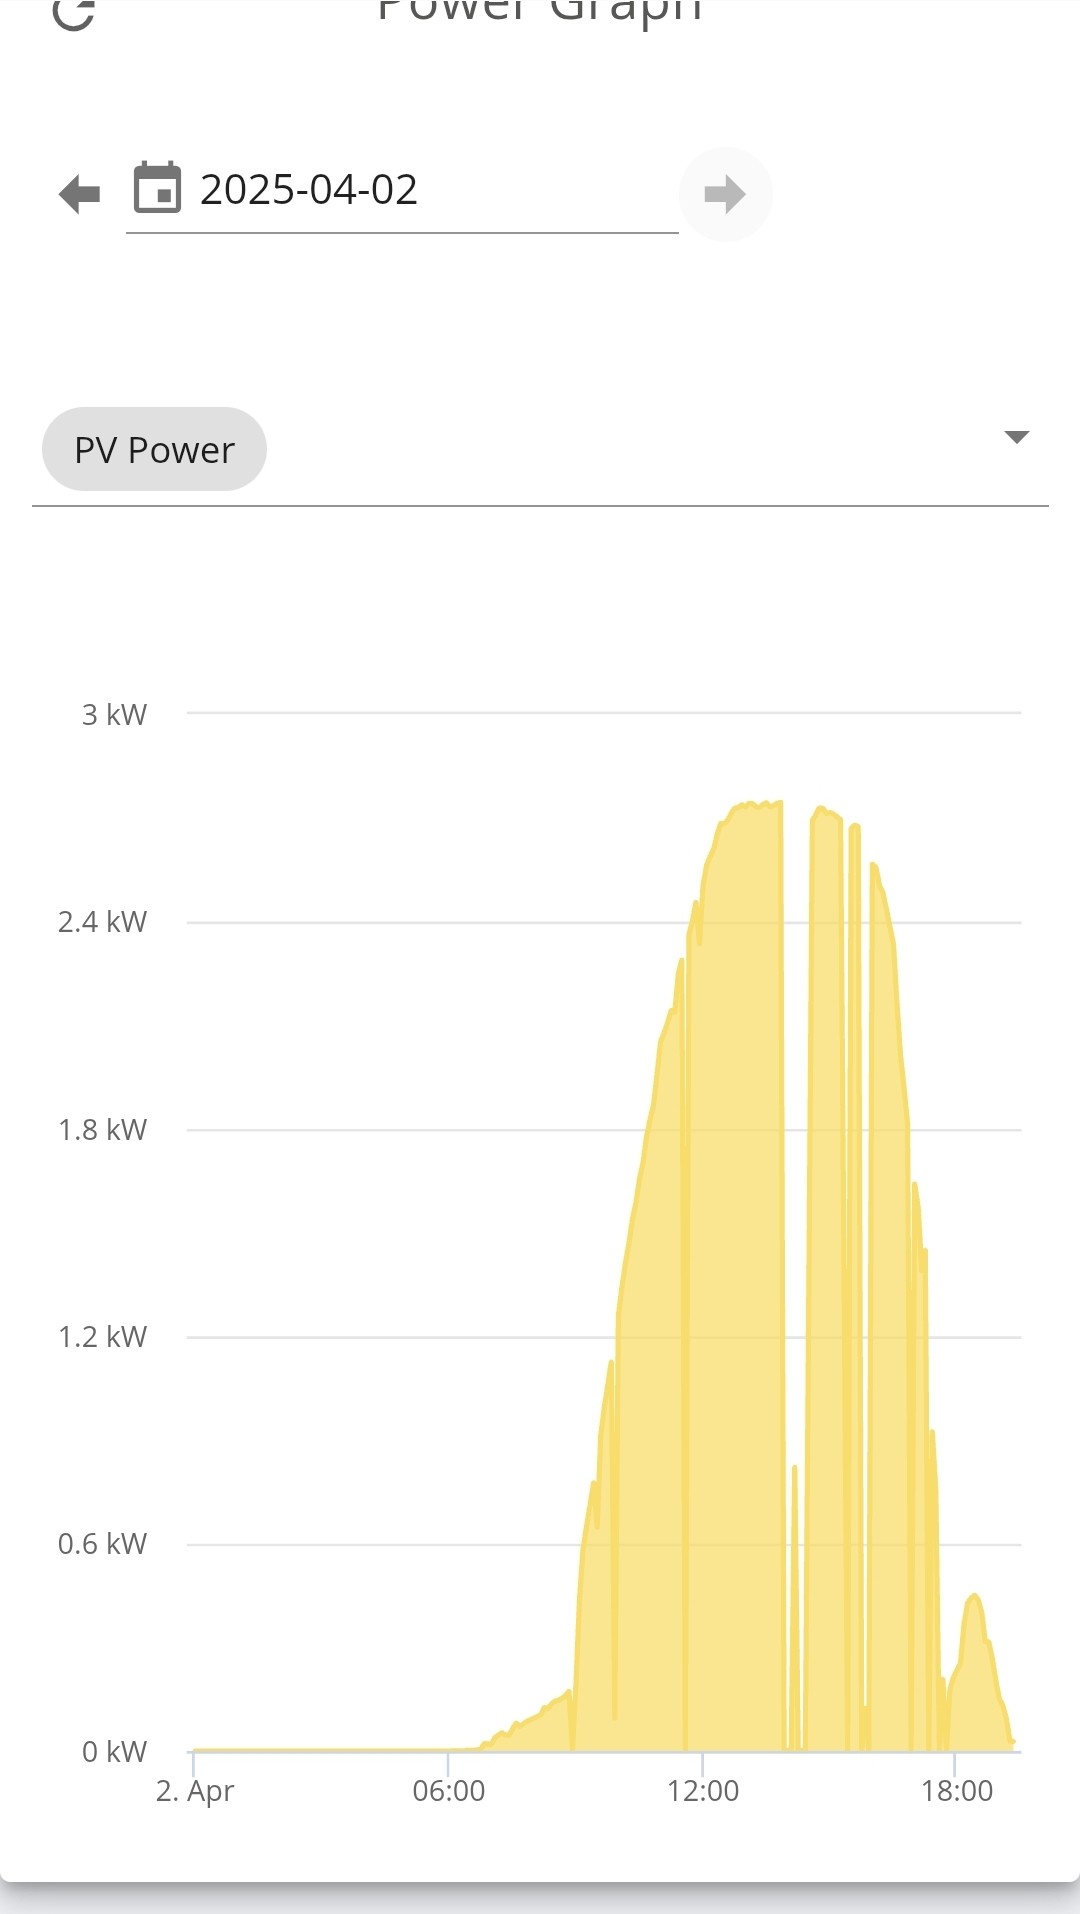
I have been looking at my solar generation graph and noticed repeated drops to nearly zero during the day.
Is this normal? Can someone explain what is happening or how I can diagnose it?
I wondered if something is overheating, but the inverter temperatures don't seem more than 50c
Thanks
G
#2geoffreycoan
Inverter temperatures of 50 degrees C is a bit hot, I keep mine cooled to 40 degrees C. Plenty of other threads on here about solutions with PC fans, etc.
Have a look at your grid voltage during that period, if its too high then your inverter will shutdown generation
B
#3BenS
Thanks for the reply.
Its doing it again this afternoon.
Grid voltage and temperature are same as they have been all day. So probably not that?
G
#4geoffreycoan
BenS 50 degrees isn't excessively hot for the inverter, if it was above 60 then I would be more worried
I definitely do see grid voltage rising to about 258V then the inverter shutting down PV generation, voltage drops, PV restarts, and the cycle repeats. On the screenshot above this isn't as obvious that this is the issue for you
B
#5BenS
Thanks again. I think I am going to put a call into GE.
I dont think it's normal behaviour and I'm not hearing anyone else saying they have the same symptoms so I wonder if I have a fault.
#6Windy Miller
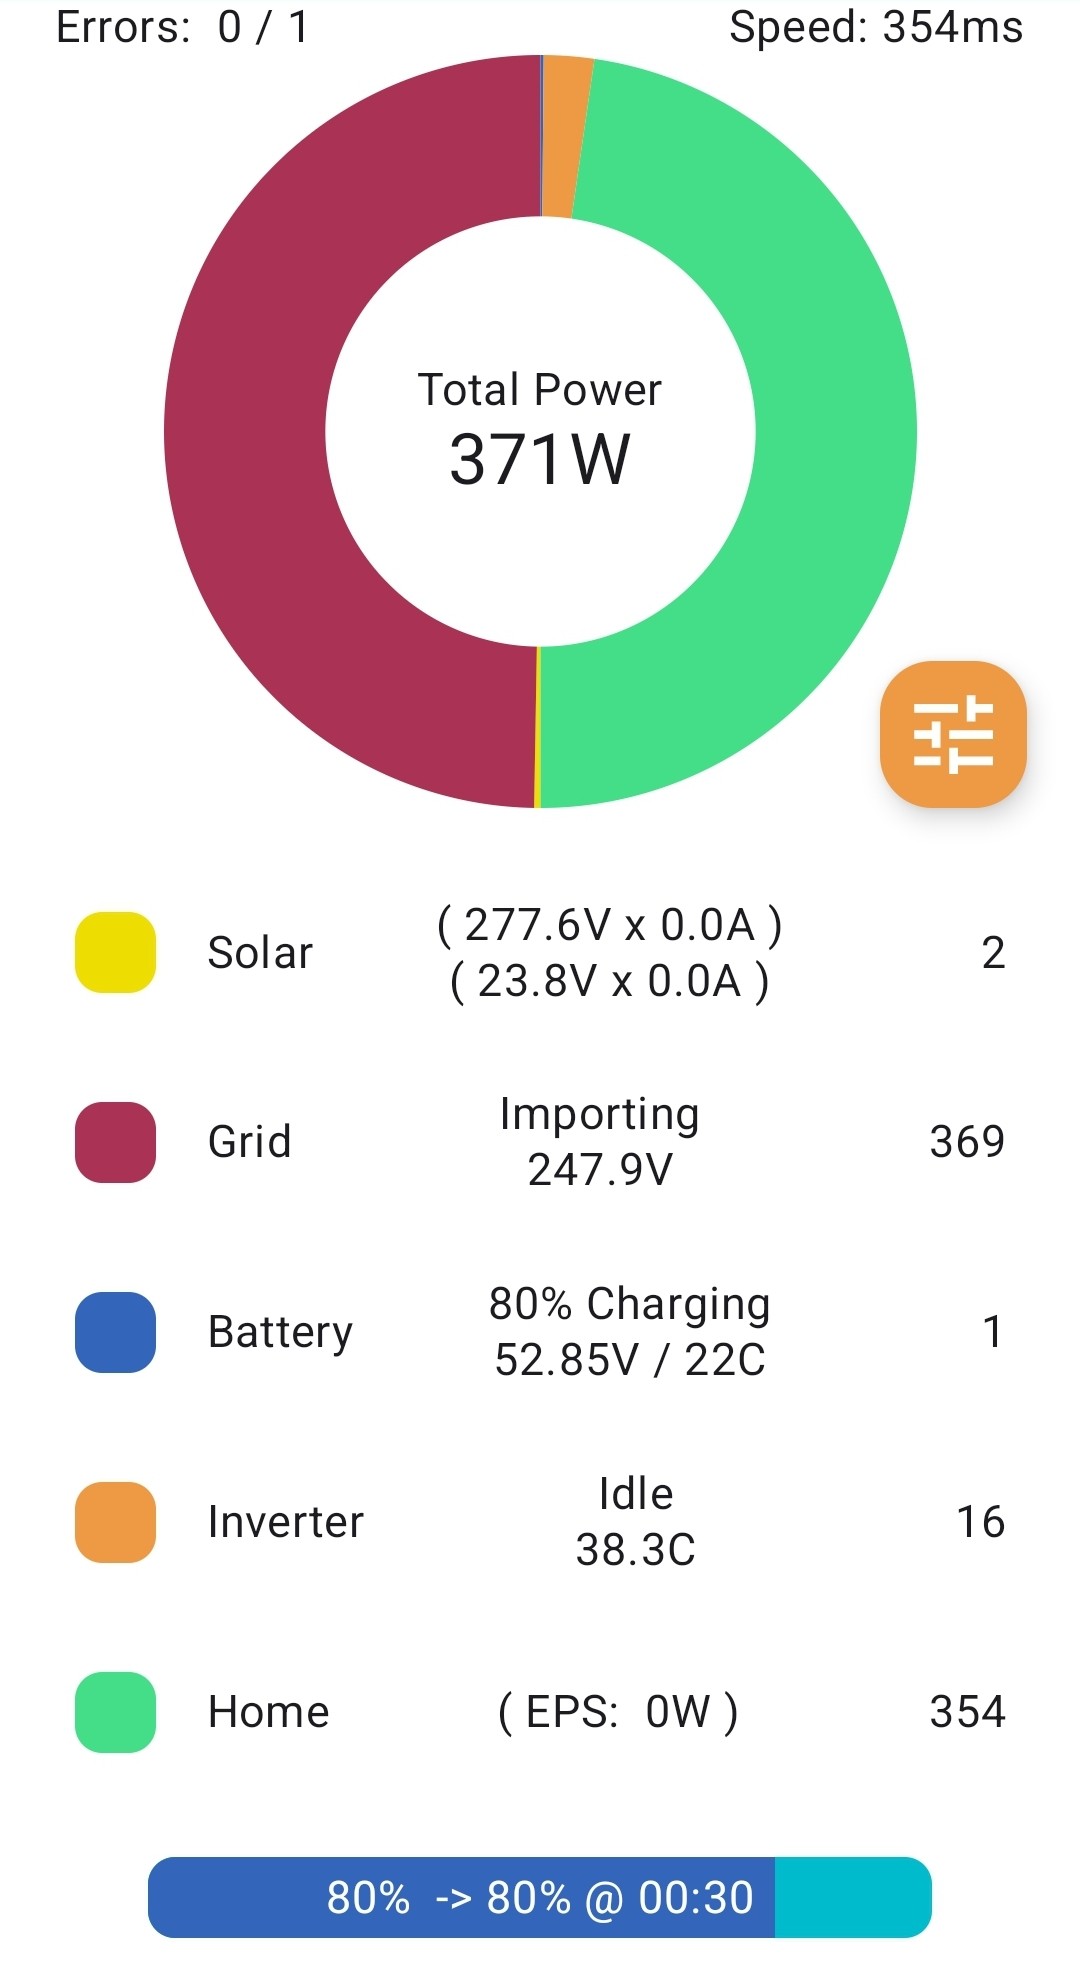
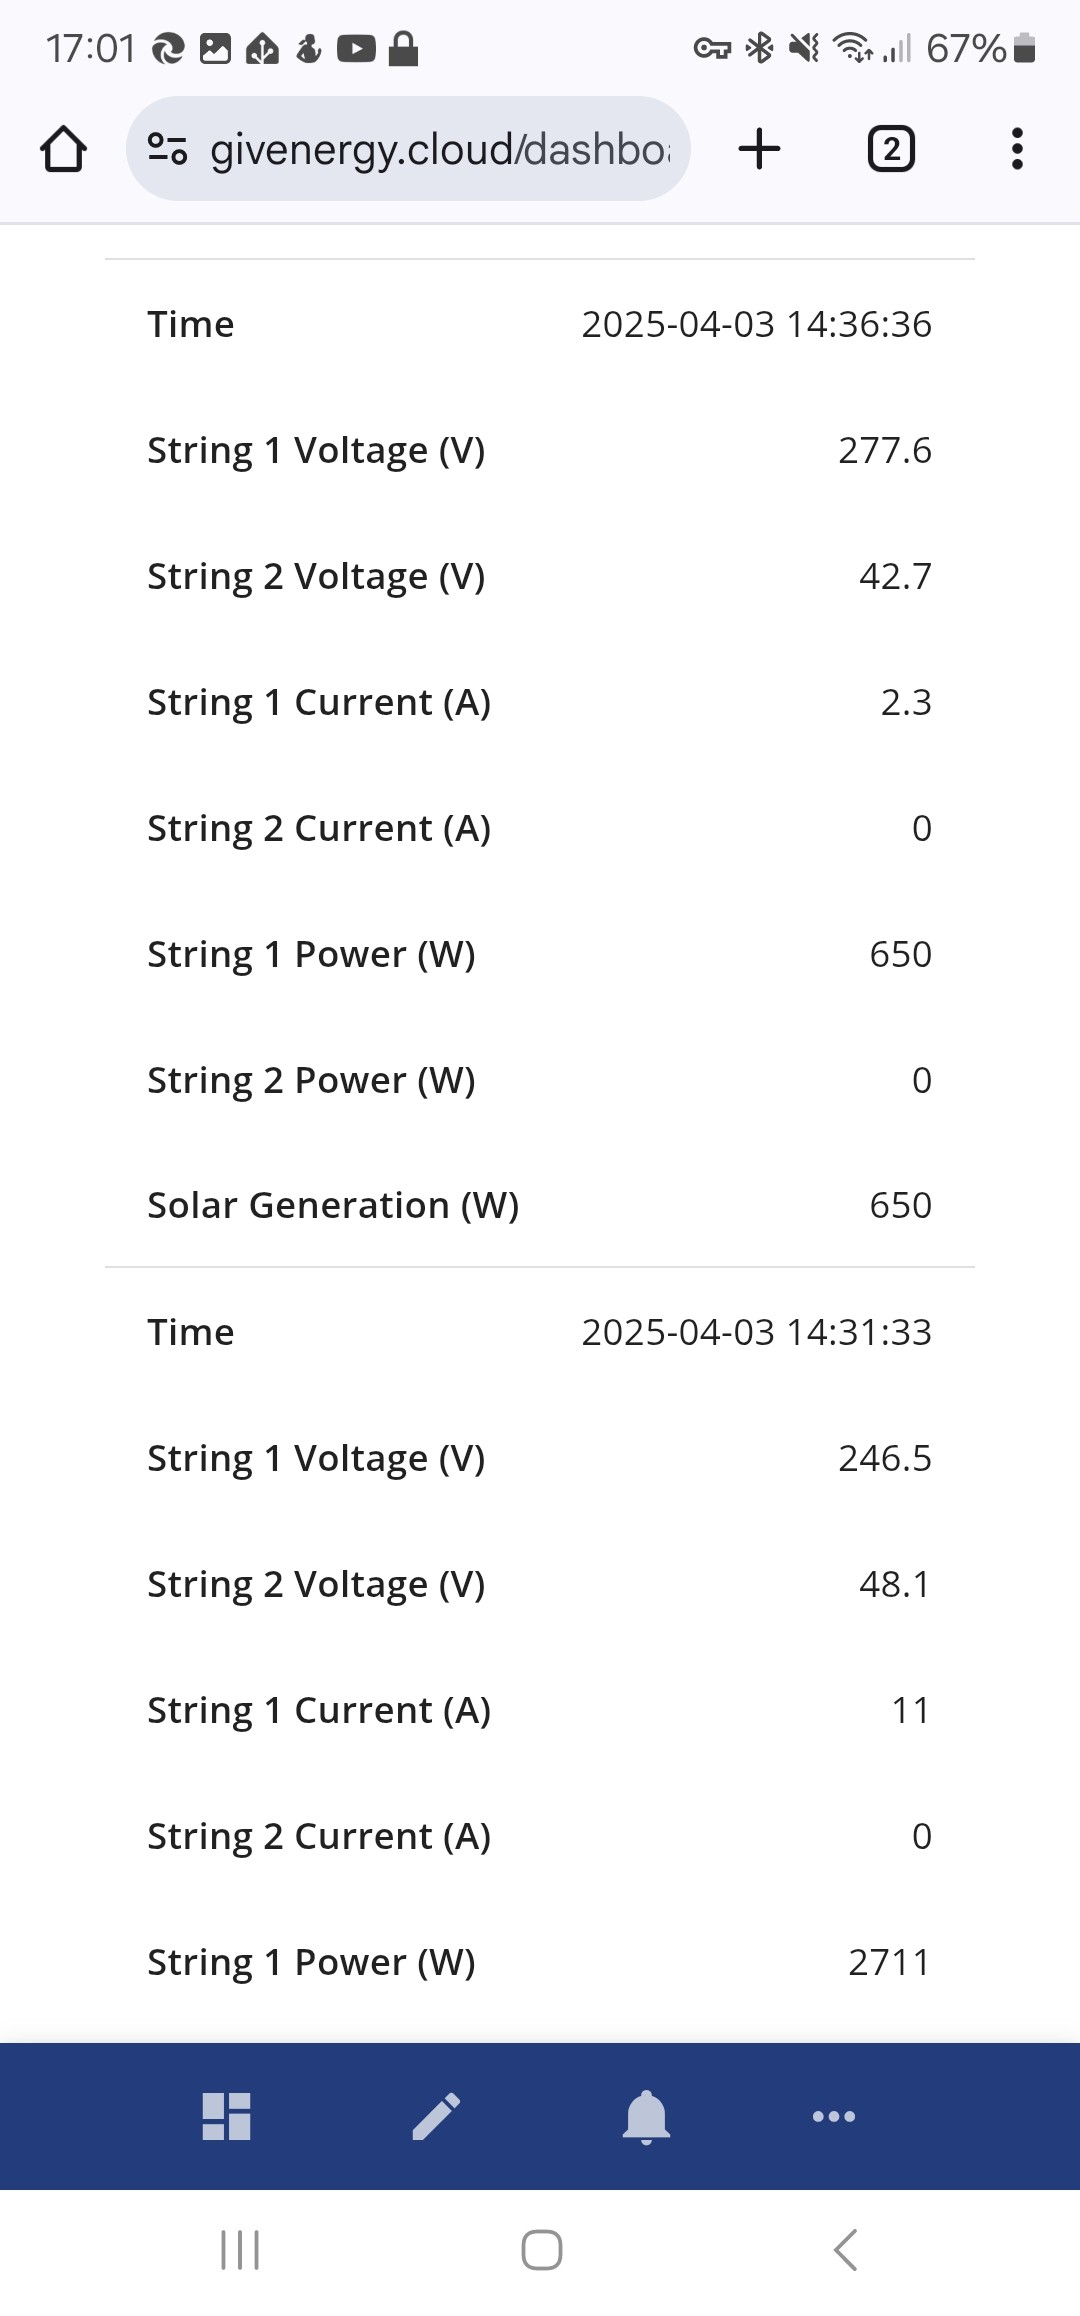
BenS Your inverter app screenshot shows the state just after the solar inverter has backed off for some reason. Can you capture a screenshot at the peak solar (around 2.7kW) whilst it is exporting most power to the grid so we can see what the grid voltage is at that time as going over-voltage is a distinct possibility. The inverter backs off when the grid rises above around 256v which is a distinct possibility when you're pushing lots of power back to the grid.
Thanks. I dont think I can look at the history on the inverter app, so will try to catch it tomorrow (hopefully it is sunny again!)
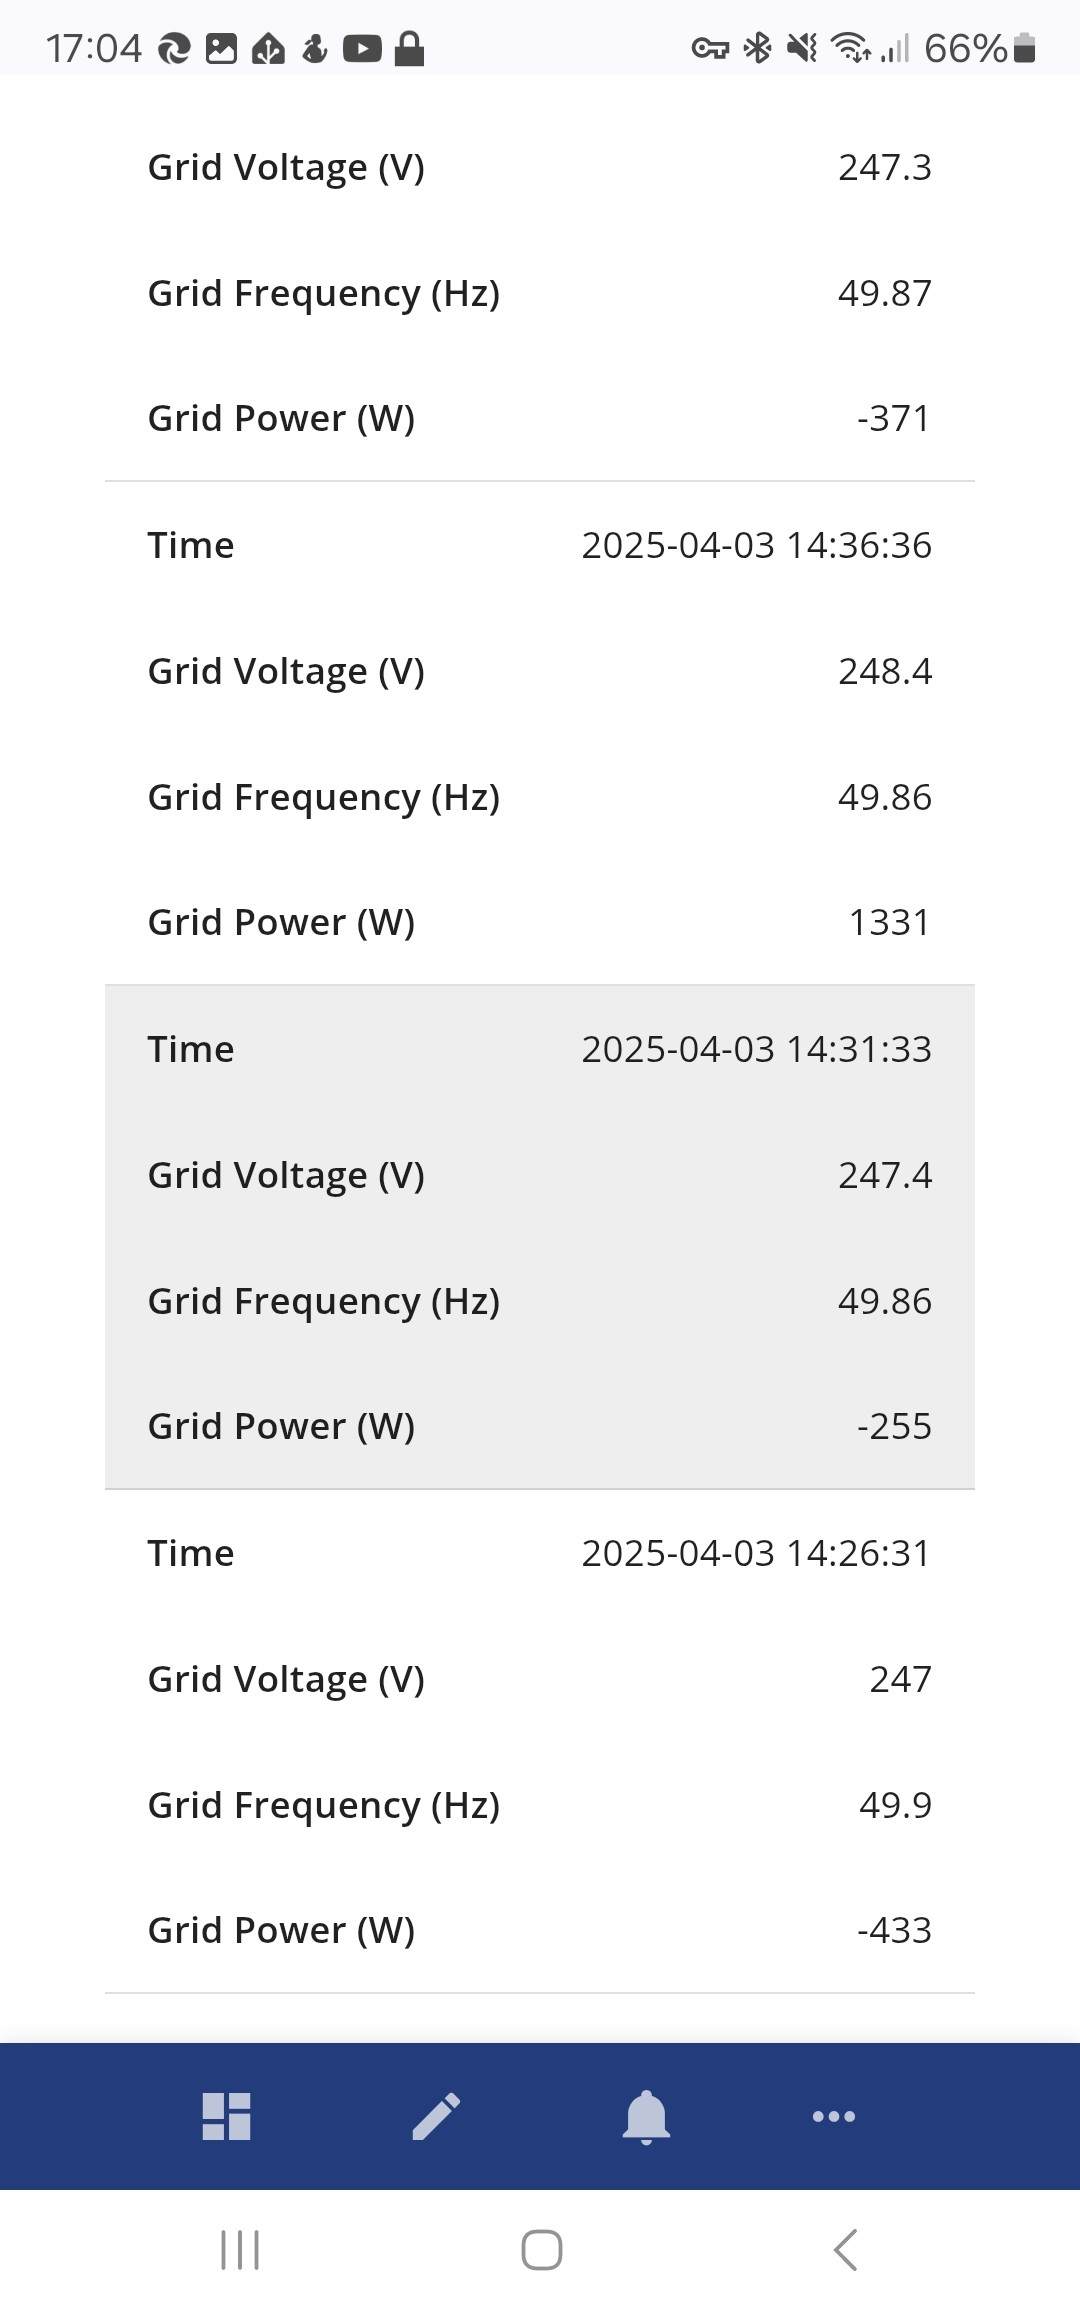
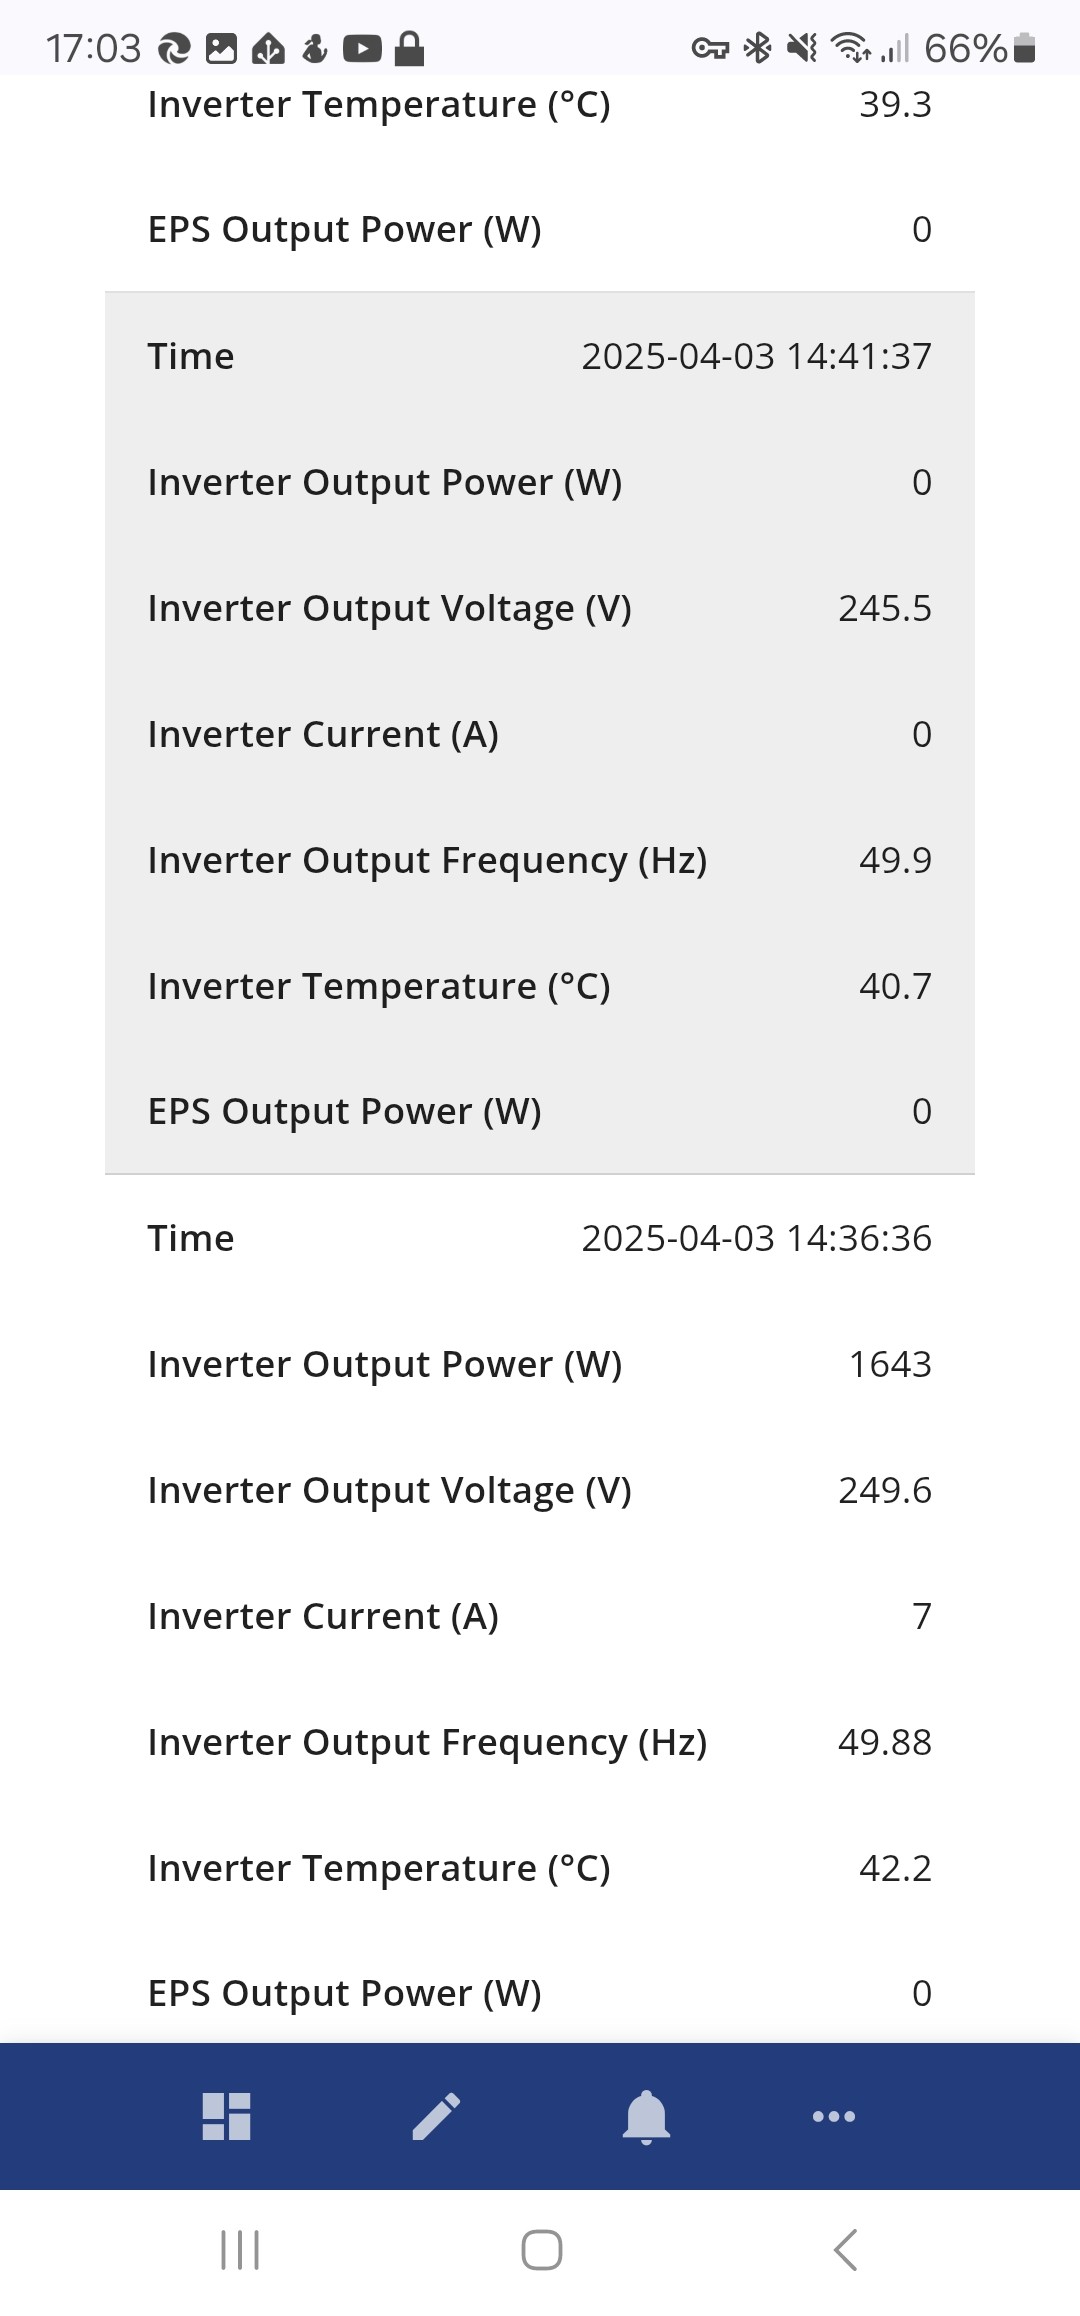
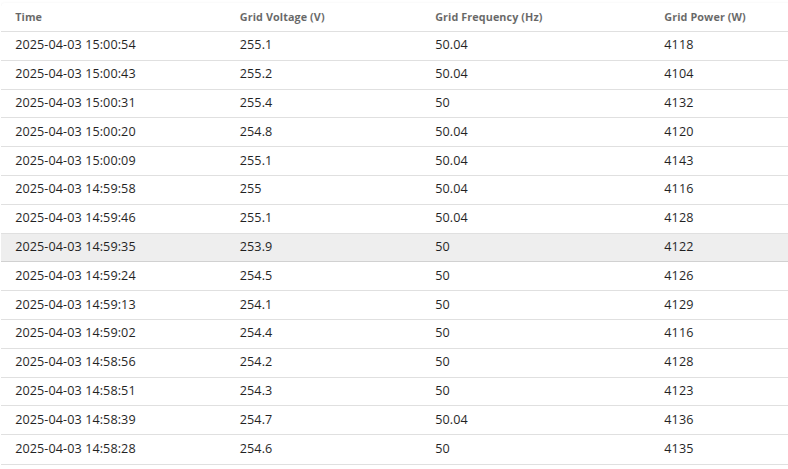
Not sure if this is useful but i have screen grabbed some logs from the same time (there's probably a better way to do this)...
R
#8Rubikcube
You can get a minute-by-minute history in the inverter app by going into settings and turning on "Collect Stats".
If the problem is high grid voltage, then when the inverter shuts down, the PV voltage will rise. If it were a big cloud, the PV voltage would fall.
If you tap the grid line on the main screen, you can see the voltage ranges that your inverter has been set to.
#9Windy Miller
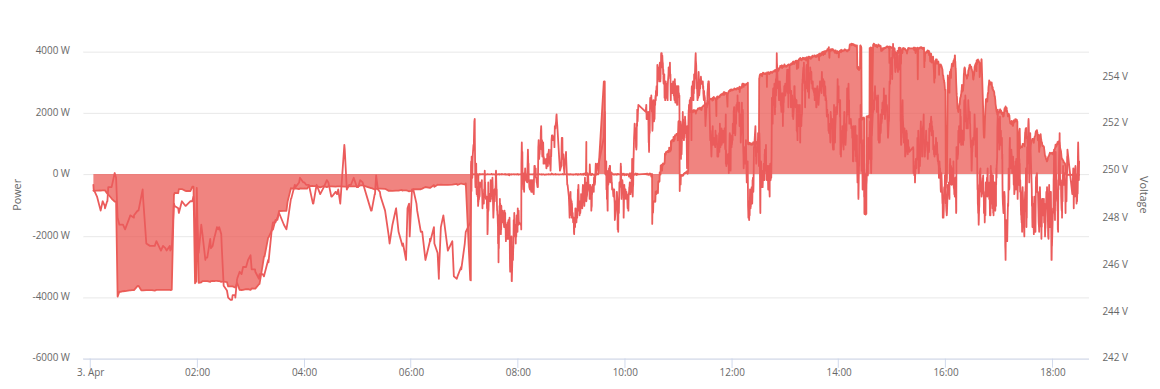
On the portal (web not app) go to the inverter section then grid data tab and you can see the voltage vs power. Mine is below. You can see that I regularly have 254v and occasionally 255v but that isn't making the inverter back off. I find that 256v may cause the GE inverter to back off.
My nominal voltage is 248v so 255v is what the inverter pushes the grid up to export 4-5kW.
G
#10geoffreycoan
BenS the problem with the GivEnergy app and portal data is its only sampled every 5 minutes so its very easy to not see whats actually happening
As @Rubikcube says, have a look at the logs in his Android app, will be much more detailed
I have managed to capture logs in your app (thanks, its great!), and can see the time when solar PV1 drops. I dont see anything unusual. Is there an export option as I can't fit all the data on one page?
I'd like to share a screen shot for you and others to comment in case I'm missing something.
R
#14Rubikcube
Yes, the data table is rather big and you have to scroll it left and right as well as up and down, even more so on a phone than a larger screen tablet. There is no way to export the data.
Take a look at the graphs and turn on the voltage switch. You should see something like the bottom graph on this page https://givenergymonitor.wixsite.com/tutorials/clipping Do the drops in solar power match up with peaks in grid voltage? If so check the grid settings as explained here https://givenergymonitor.wixsite.com/tutorials/inverter-settings It has been noted in the past that different inverters often have different settings, but I have no idea why. You can post a screenshot of a graph or settings if you think it might help. Remember the graph scrolls left and right too.
I doubt the inverter itself is overheating, you only seem to have 7 or 8 panels, mine has 14 and doesn't overheat. It could be a loose connection in the cabling somewhere. Could possibly be on the roof and affected by wind or birds. Could be a loose connection on the AC side which may be overheating. Do you have an emlite meter fitted, some installers seem to have trouble with those?
You have identified a problem and it is not normal. You are the best placed person to figure out what might be causing it.
B
#15BenS
Rubikcube
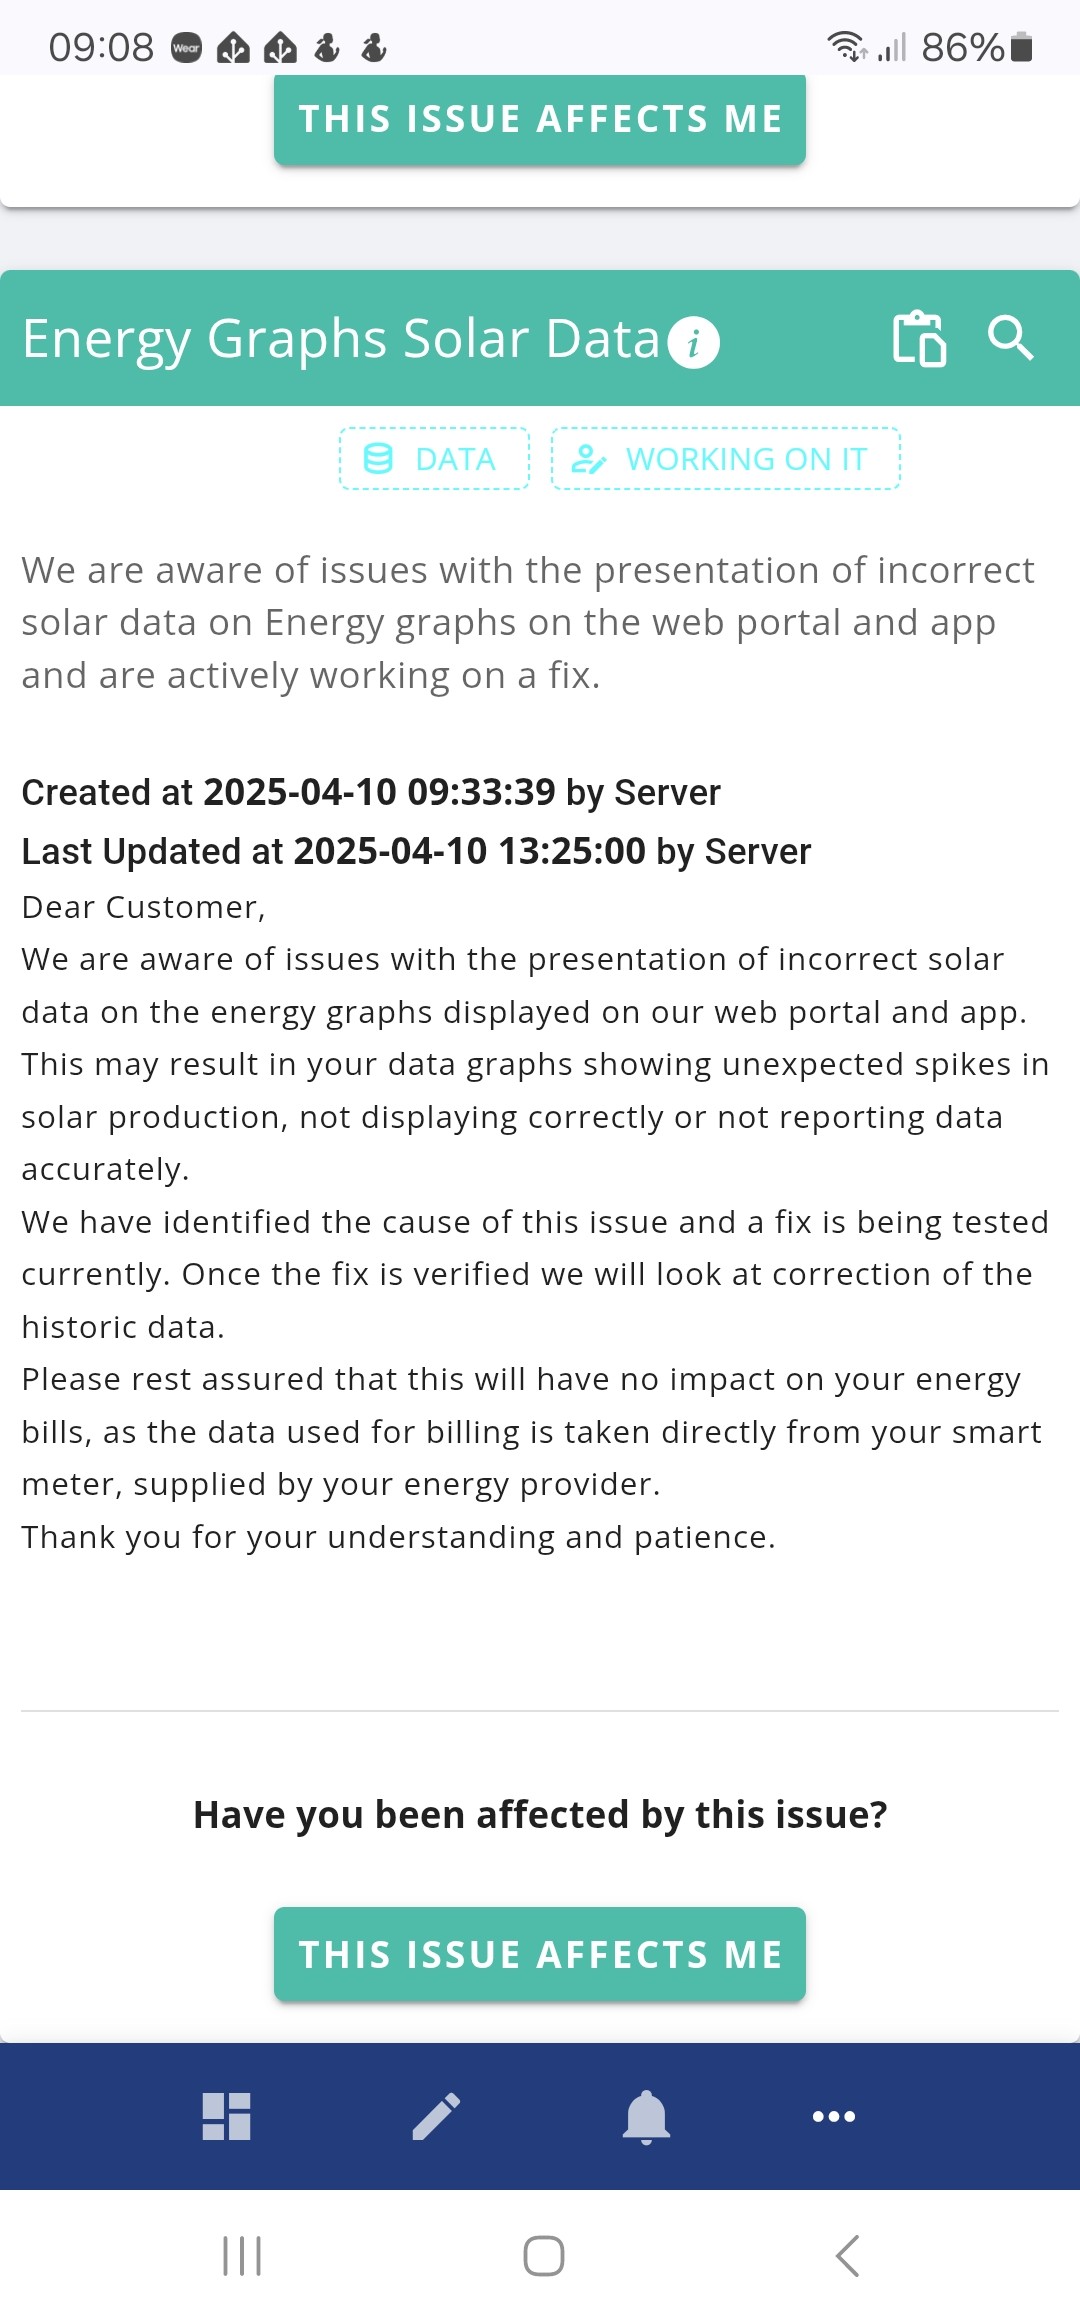
Thanks. I cant see any abnormalities in voltage etc. before the drops. But this has just appeared on the portal, since I reported my problems to GE.
Before looking any further, I will wait till they confirm a fix and see if my problem goes away.
V
#16Vallah
BenS I have the same problem. i.e. solar generation cuts out repeatedly on sunny days. My solar inverter reports a grid over voltage error which I think is being caused by my local grid voltage being fairly high (but in spec?) and a longish cable run with too smaller cable from inverter to grid connection. I'm planning to upgrade cable from 2.5mm to 4 or 6mm.
#17Judith
Thanks for showing the latest understanding. We’ve had drops in apparent solar production to 30% but only one data point at high solar levels, time varying.
I assumed it was data loss in some respect because it wasn’t like a physical feature such as passing cloud. Since reading this thread I’ve checked grid voltage and it wasn’t that.
So I’m glad it appears to be understood.