L
#1 LMA
Anyone else spot some odd data on the cloud today - also on the app
Showing I generated over 6000Kwh today - pretty sure thats not right. Consumption 1300Kwh, exported 3900Kwh.
Very strange

Anyone else spot some odd data on the cloud today - also on the app
Showing I generated over 6000Kwh today - pretty sure thats not right. Consumption 1300Kwh, exported 3900Kwh.
Very strange
The app appears to have gone mad. Comparing the app vs Website for yesterday & a few days before that it appears to be doubling the reported solar generation & grid to Home, while halfing the battery.
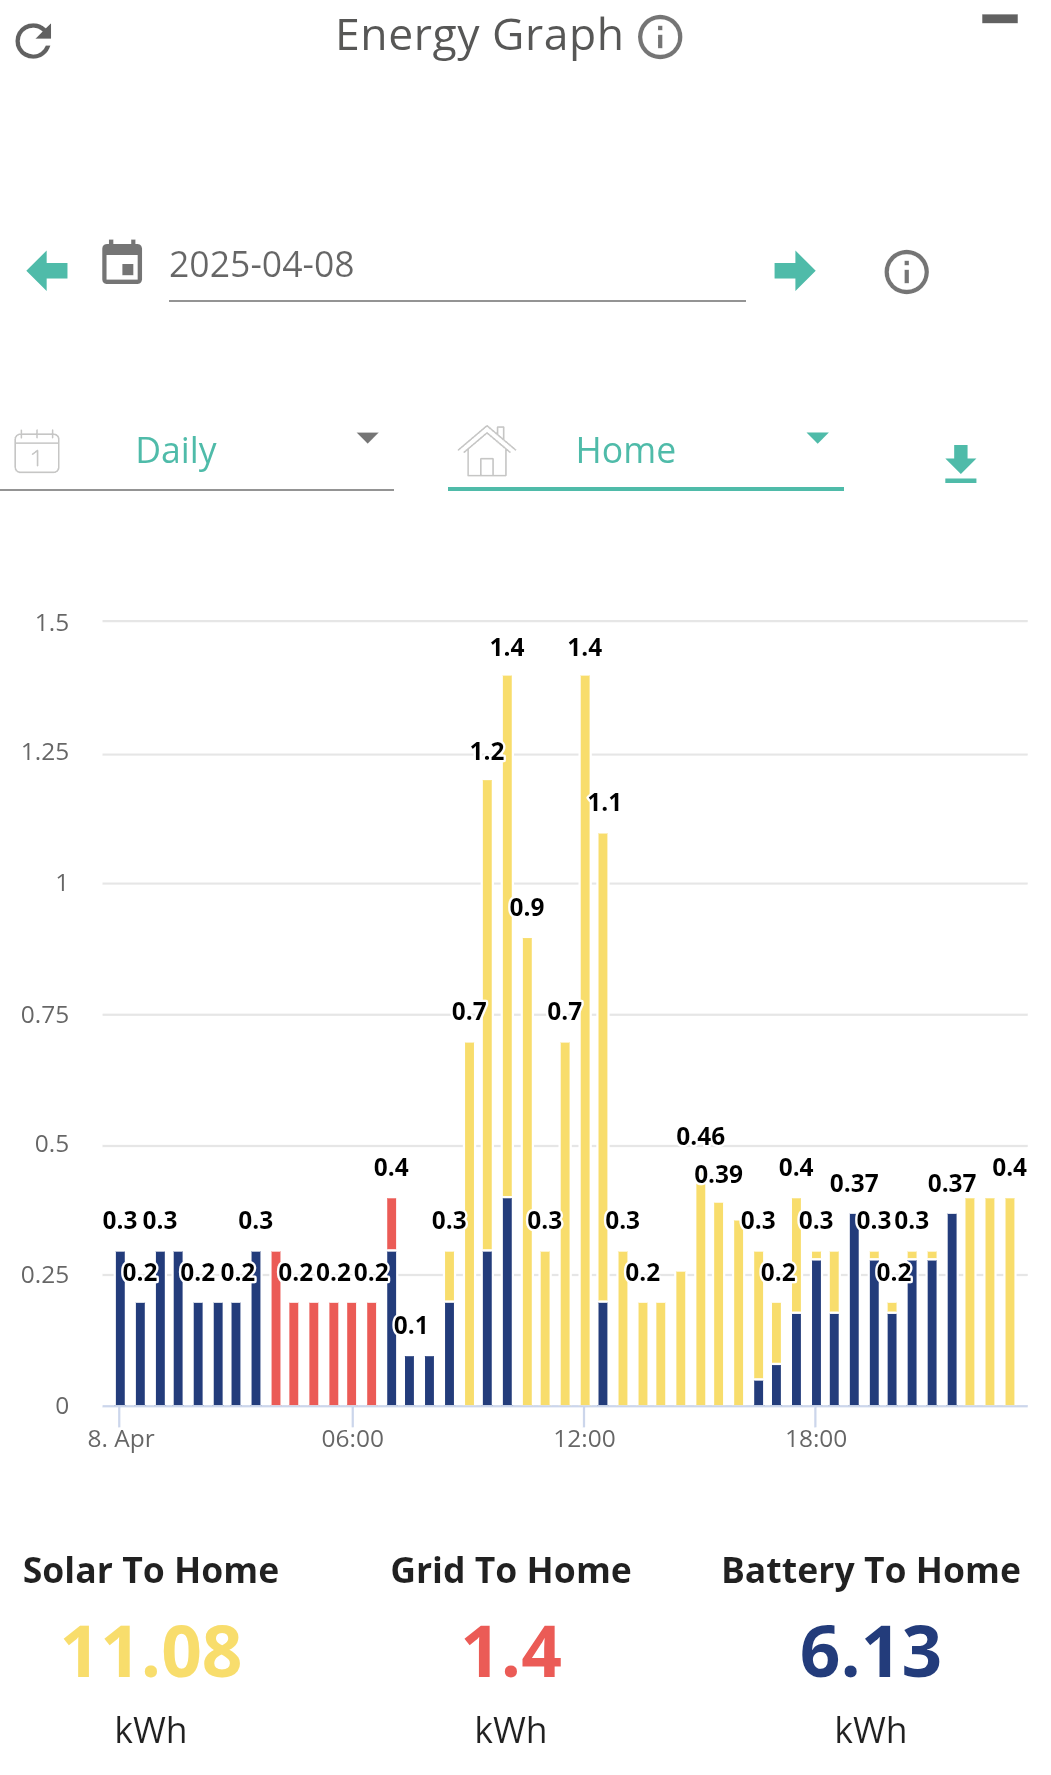
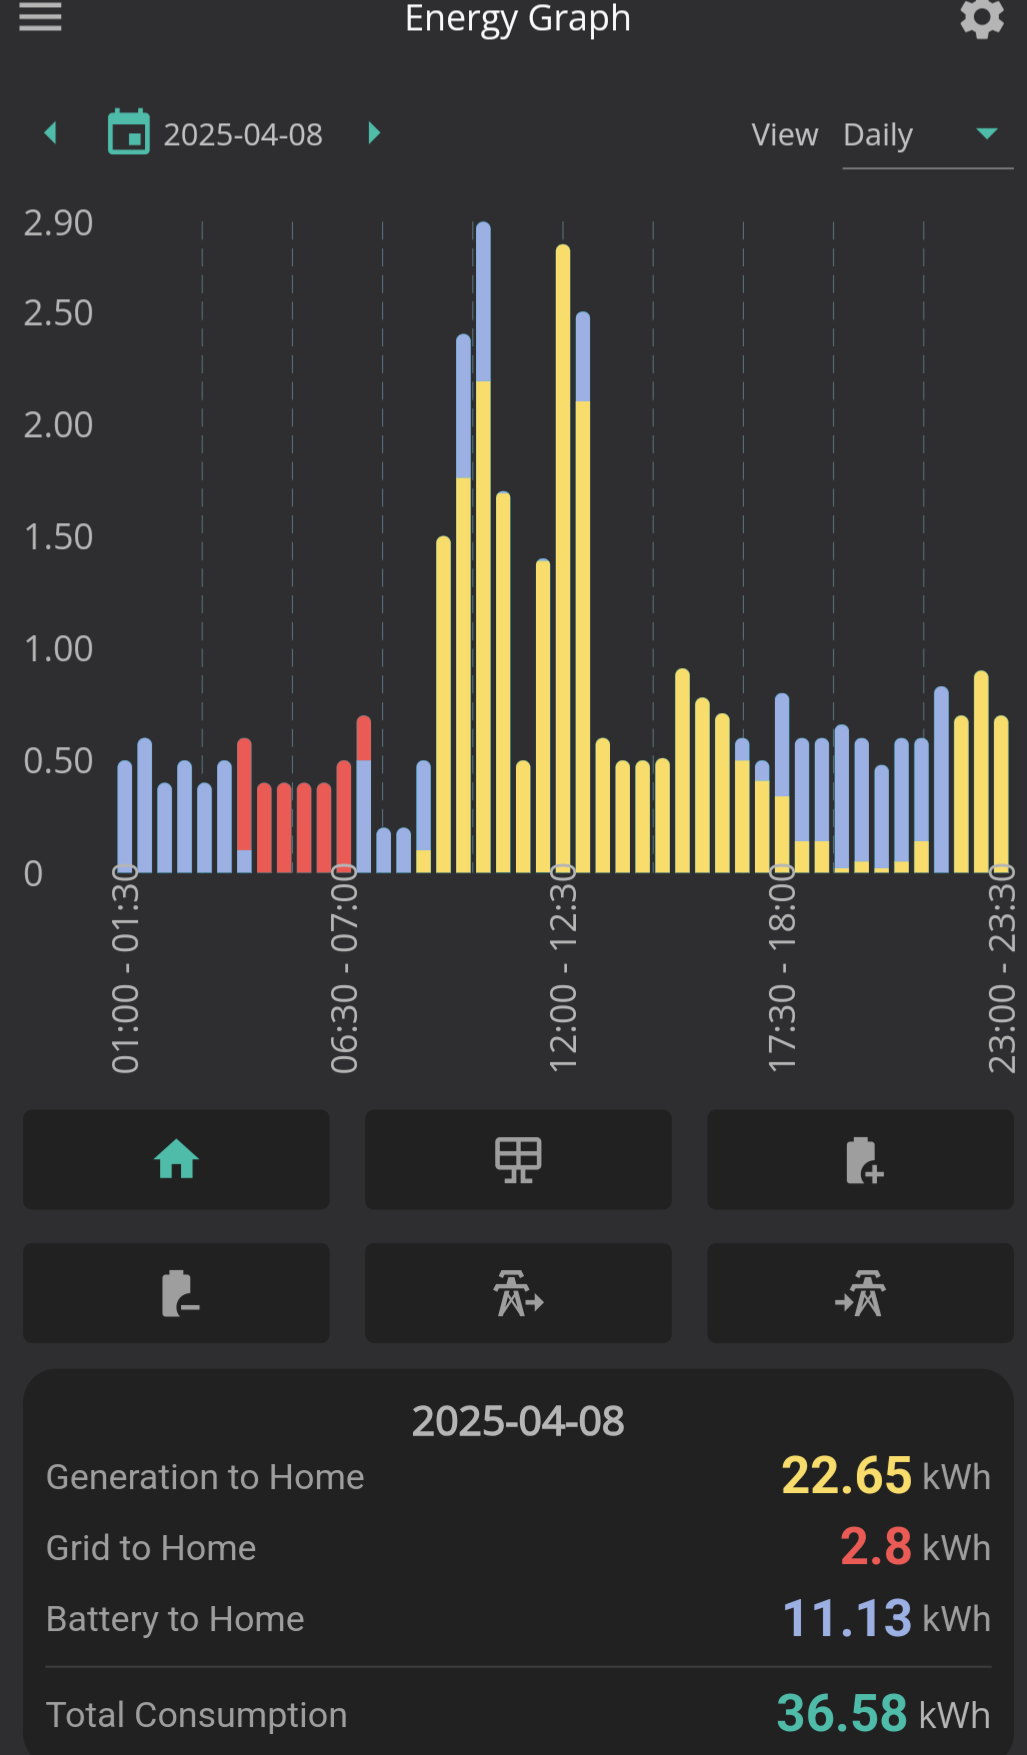
Comparing app vs Website.
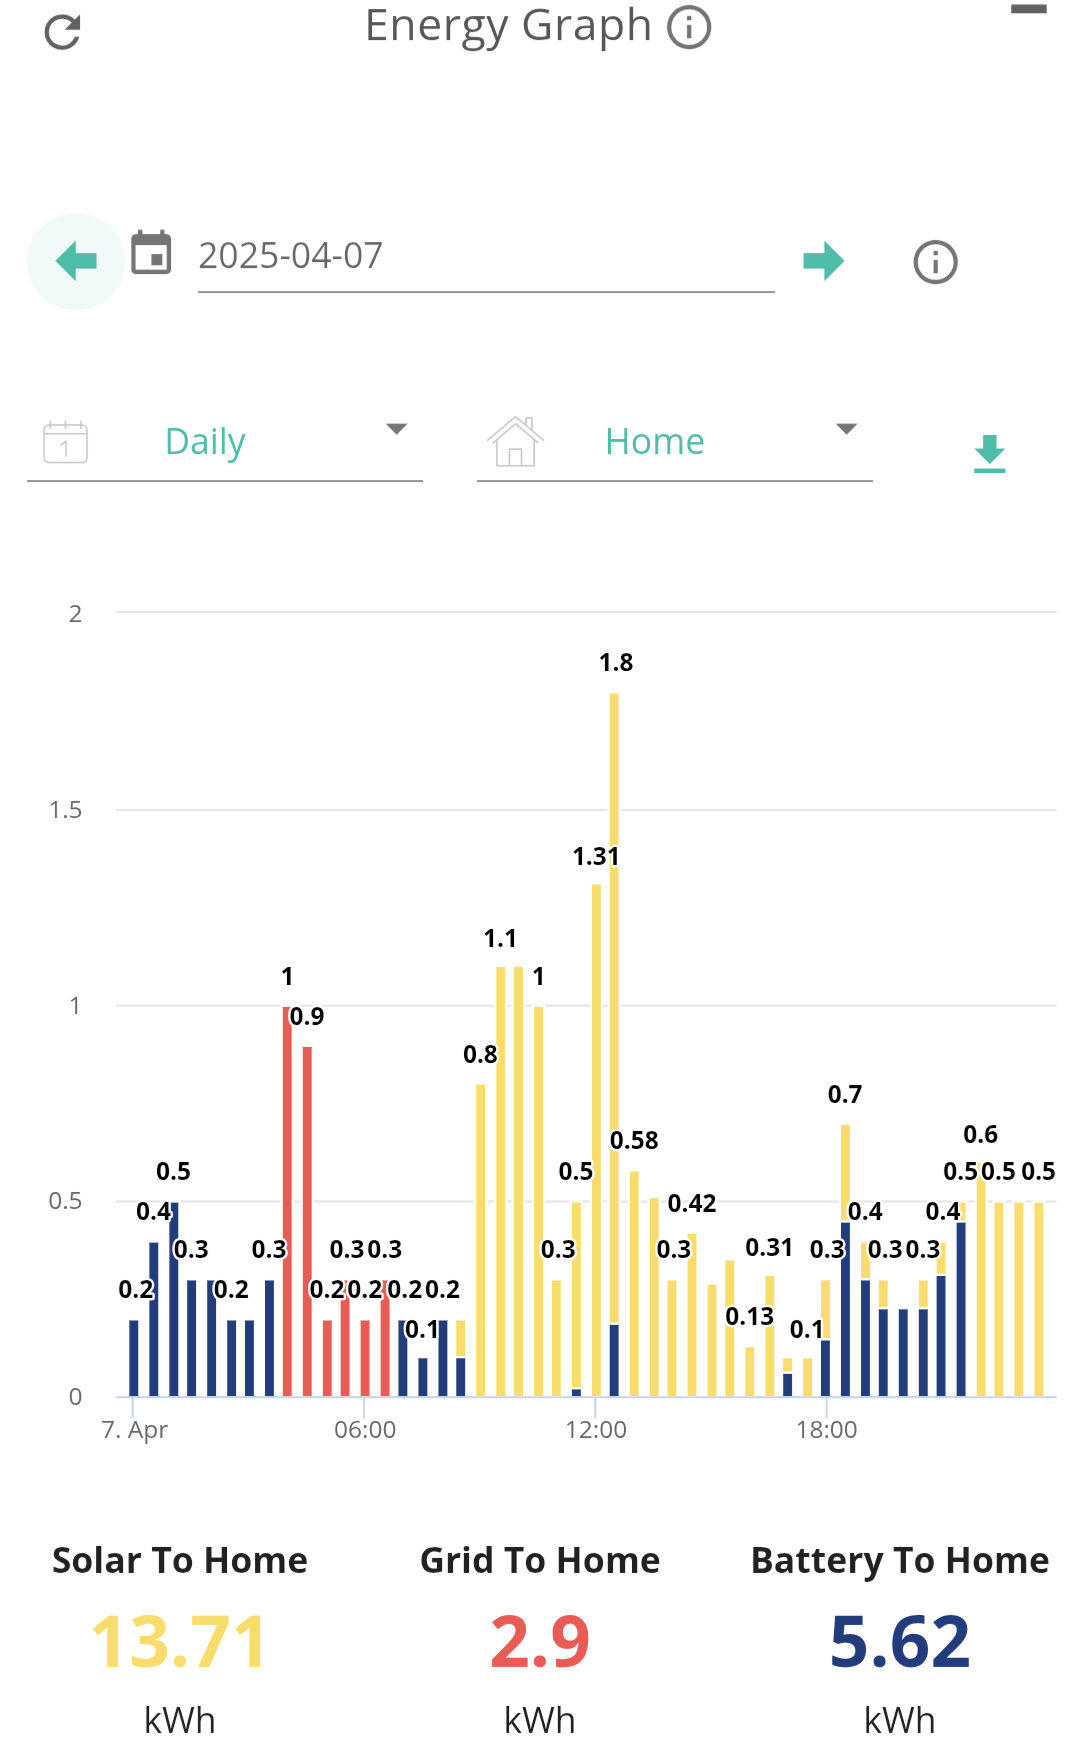
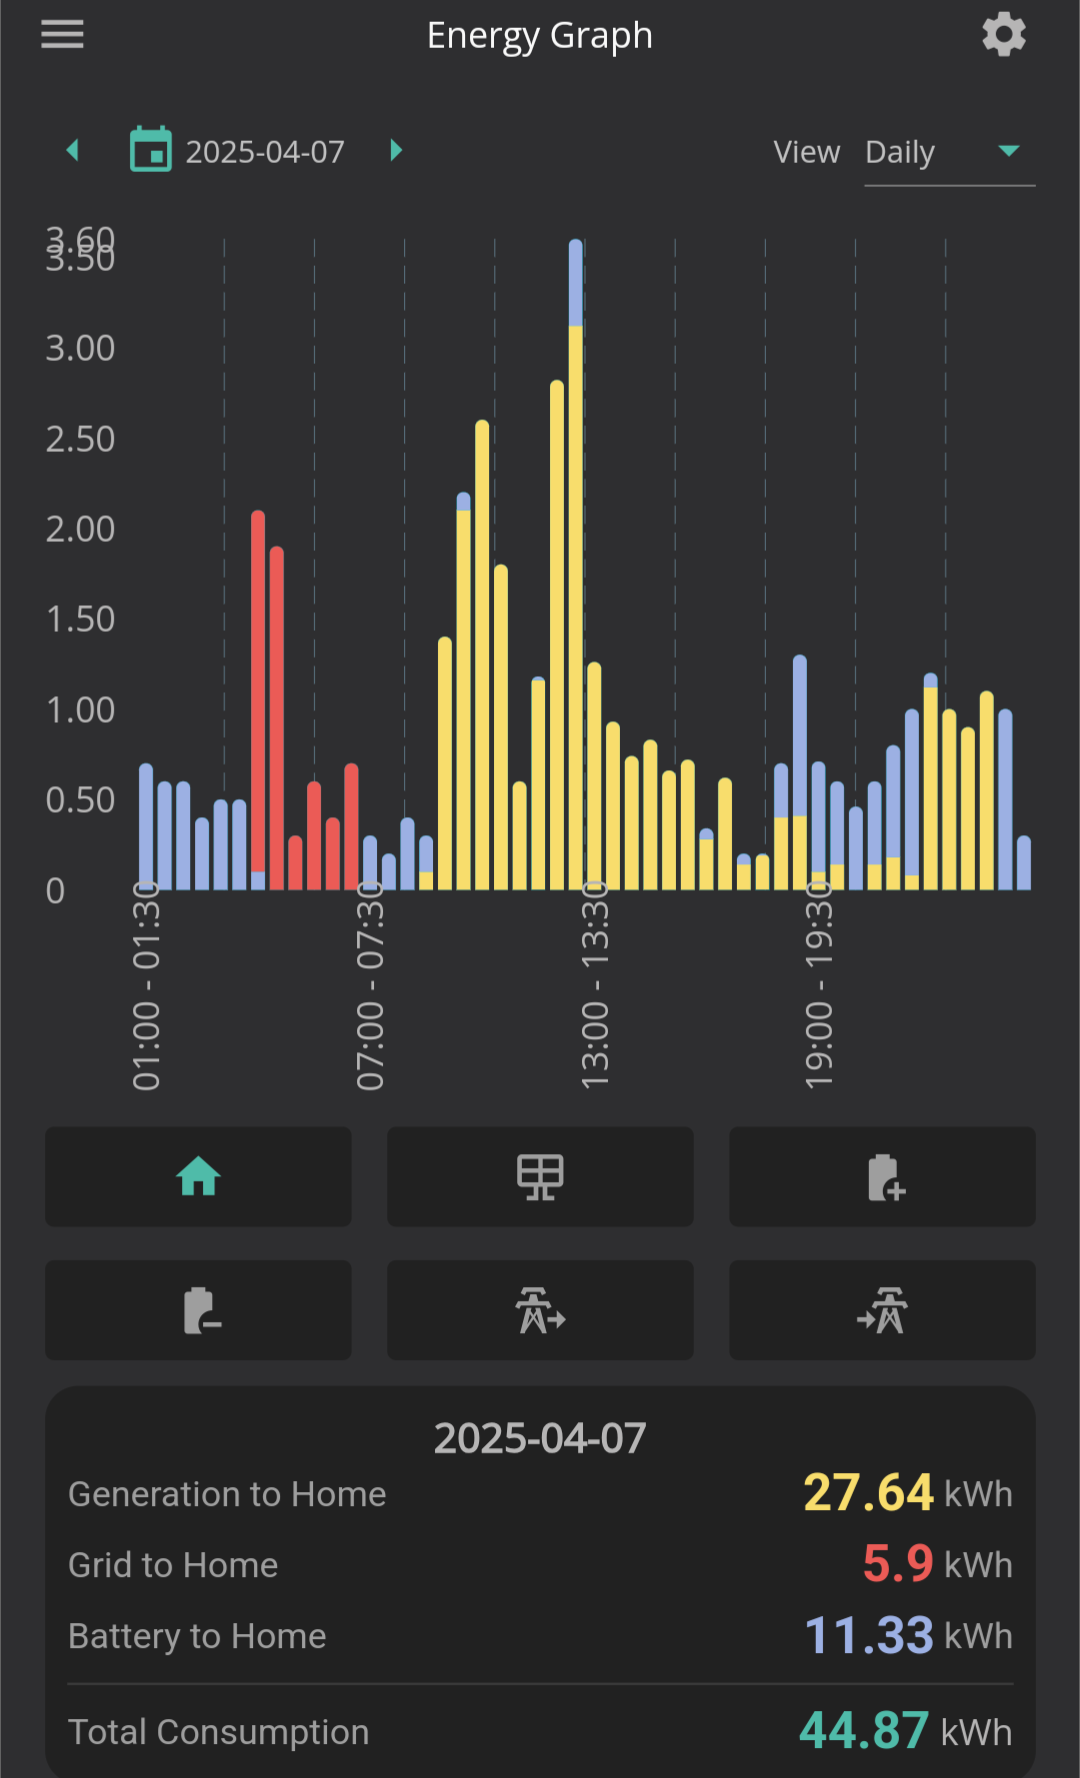
Same pattern on the 6th of April. The App appears to be doubling the reported solar generation & grid to Home, while halfing the reported battery.
Looking back through the app, it's now showing previous months wrongly with this same doubling the solar generation & grid to Home, while halfing the battery (compared to the website). Ie these were previously showing correctly in the app.
I wonder if this app bug has anything to do with the new tax year which just started.
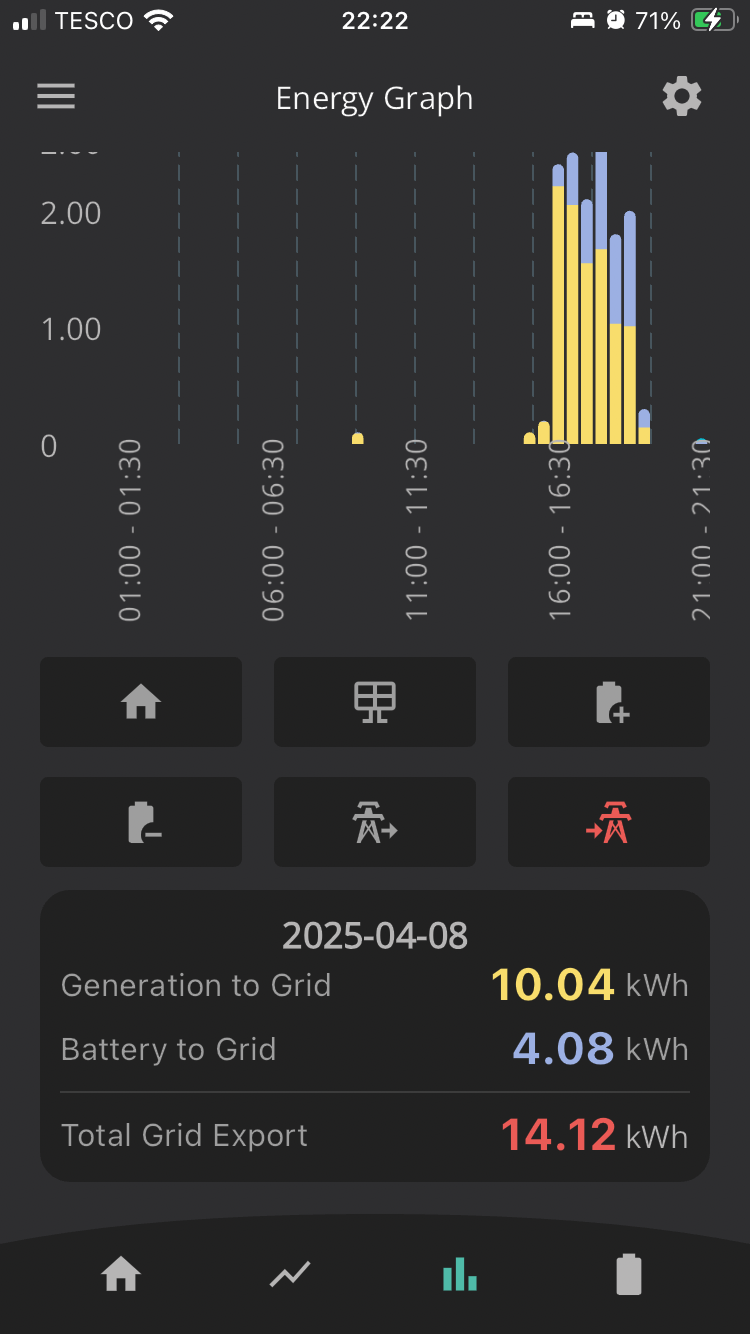
I noticed about 2weeks ago on the web portal and then last night my app went the same way, that when my battery was on a timed export to the grid The battery output was suddenly being logged as battery to home, and unexplained amount exported to the grid. On the page for export to the grid, I suddenly have a huge amount of solar being exported between 4pm and 7pm and then the same token amount is also reported in the battery output to the grid. Neither of them add up to make any sense.
The thing is to maximise my export during peak time I actually disconnect my house to avoid drawing any power from the inverter during export and I supply my house from a separate battery system. So I know there is physically nothing going to the house.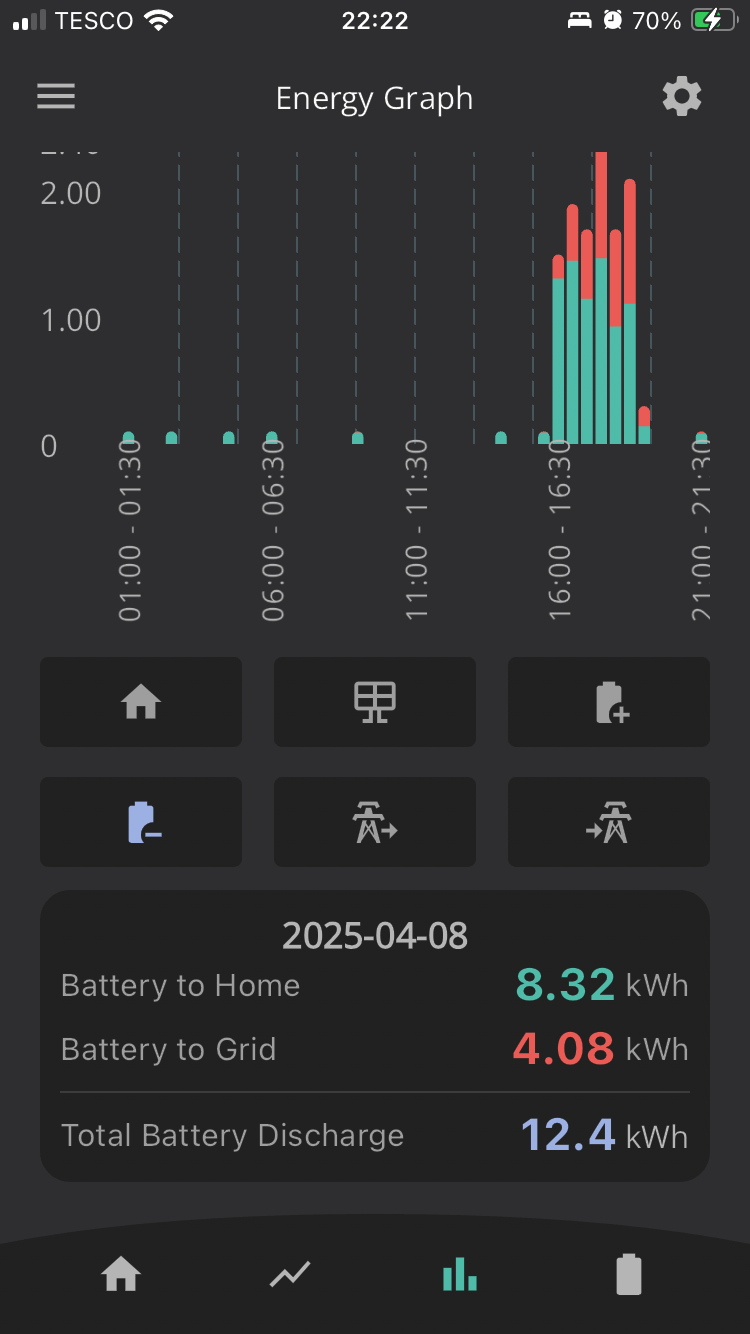
Mine seems to show very patchy data for home consumption e.g. about a third of the half hours are showing zero which I am sure is wrong.
Solar also looks wrong but only by about 1kWh per day bizarrely. Had this before any by the time support had looked at it the problem had gone away.
I'm just about to raise a ticket wuth support to see what they say!
Sadly Broke I have that about once a month it fails to record the data and I have one or two 1/2 hr gaps, but not up to a third of data.
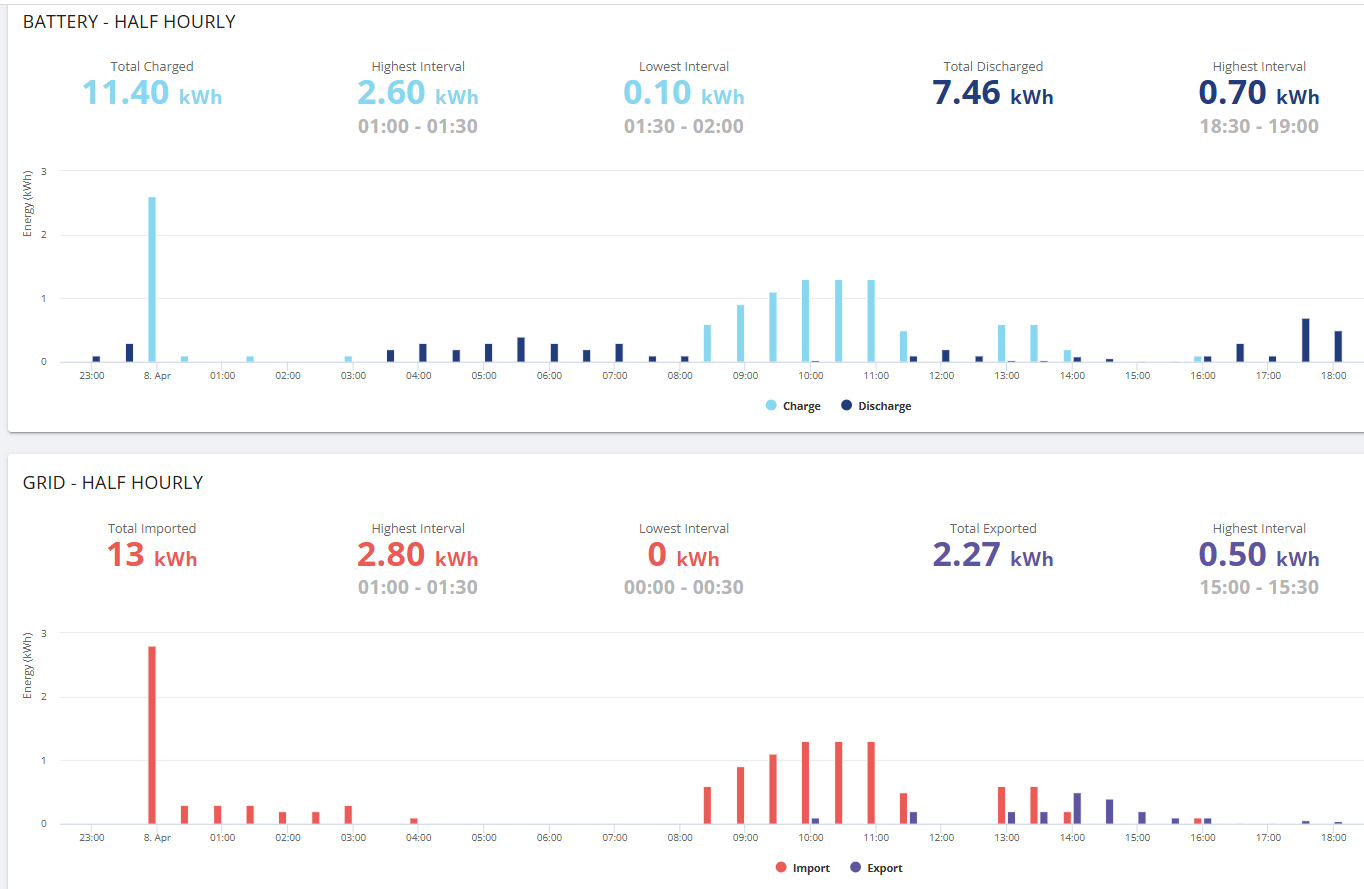
We're seeing weird results in the Daily Reports. We only charge our battery from the grid overnight (cheap rate), yet the report shows we're charging it during the day. I would assume it's somehow confusing PV solar generation with grid import.
I'm fairly sure this used to work fine, and seems to have been a recently-introduced issue.
Same here, exported 7kWh in 30 minutes randomly from my battery which is still 100% full.
Same here, exported 7kWh in 30 minutes randomly from my battery which is still 100% full.
Am seeing the same as @Ann_Hudson above - today we've apparently imported 12 kWh from the Grid to our Battery ... which has a capacity of about 4.2 kWh 😉. It does seem like it's somehow mixing up Generation with Grid import. I'm sure the issue has only come up in the last few days.
Has anyone else raised a ticket with GivEnergy? Else I'll raise one describing my symptoms.
Just had this today exported over 3kwh to grid in 30 minutes. Just not possible.
Never seen that glitch before and I check daily..
Yep deffo broken.
Shows a big grid to home import during the day, but home assistant doesn't show any import during the day!
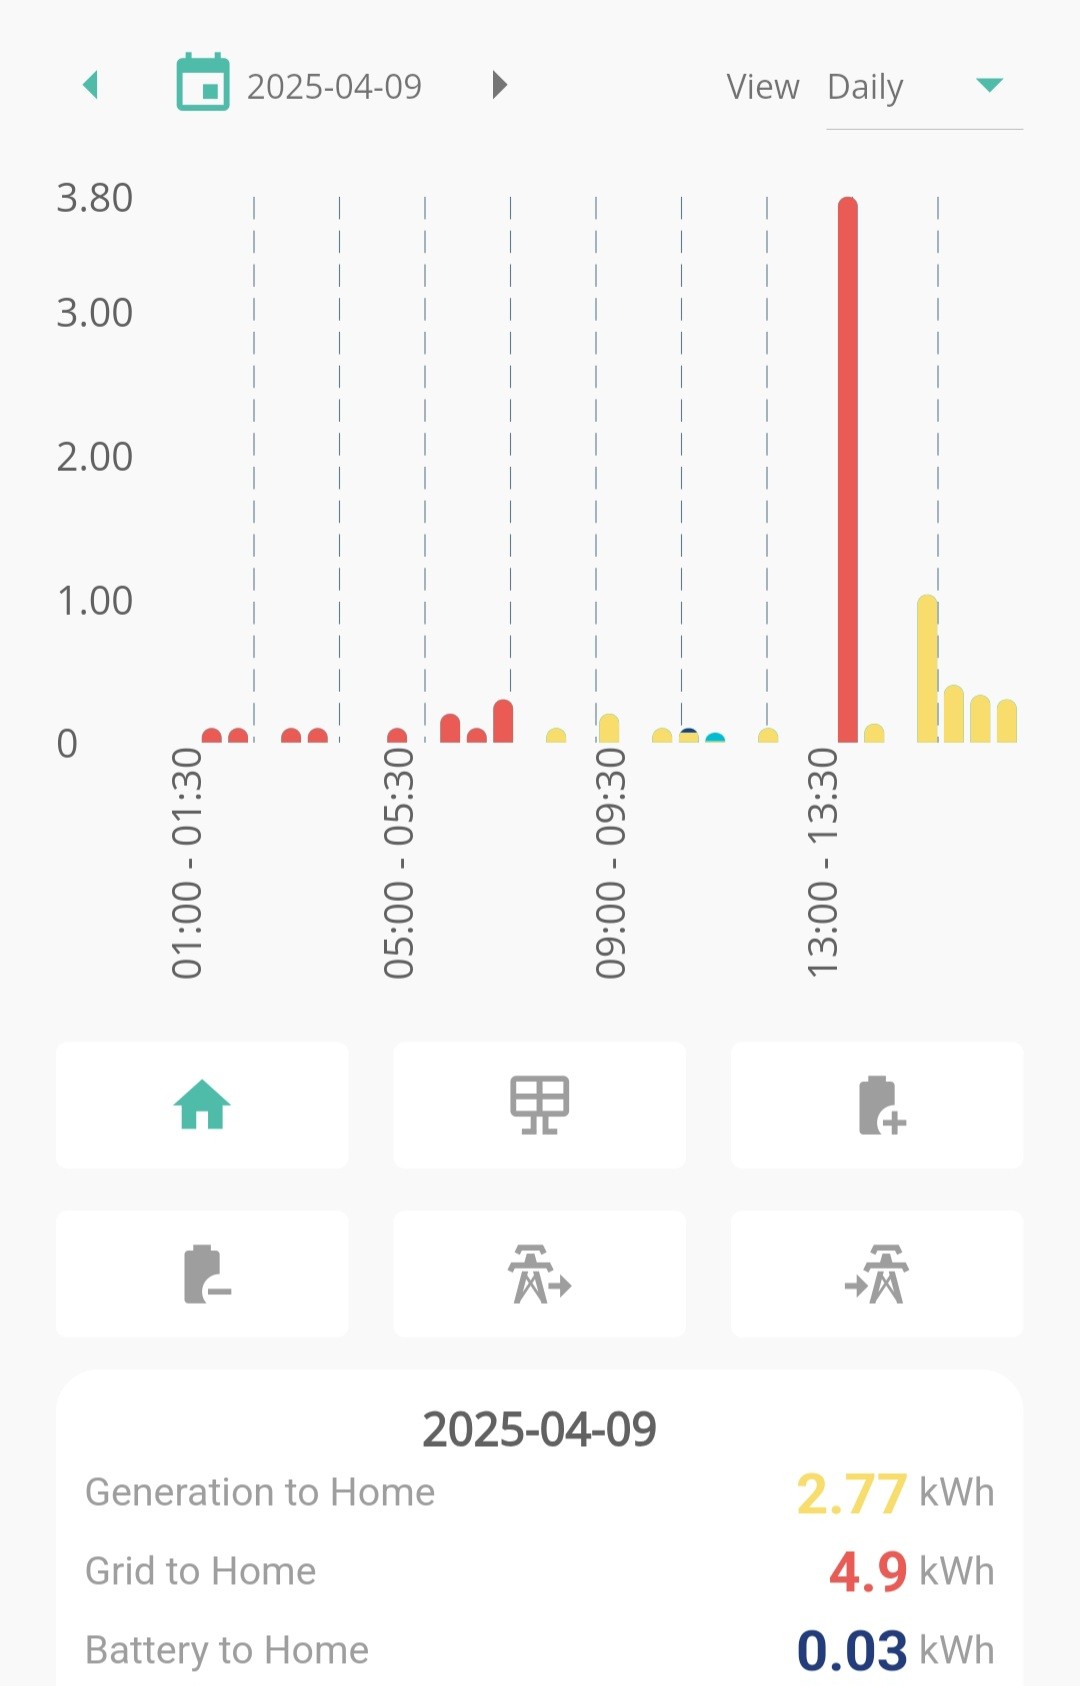
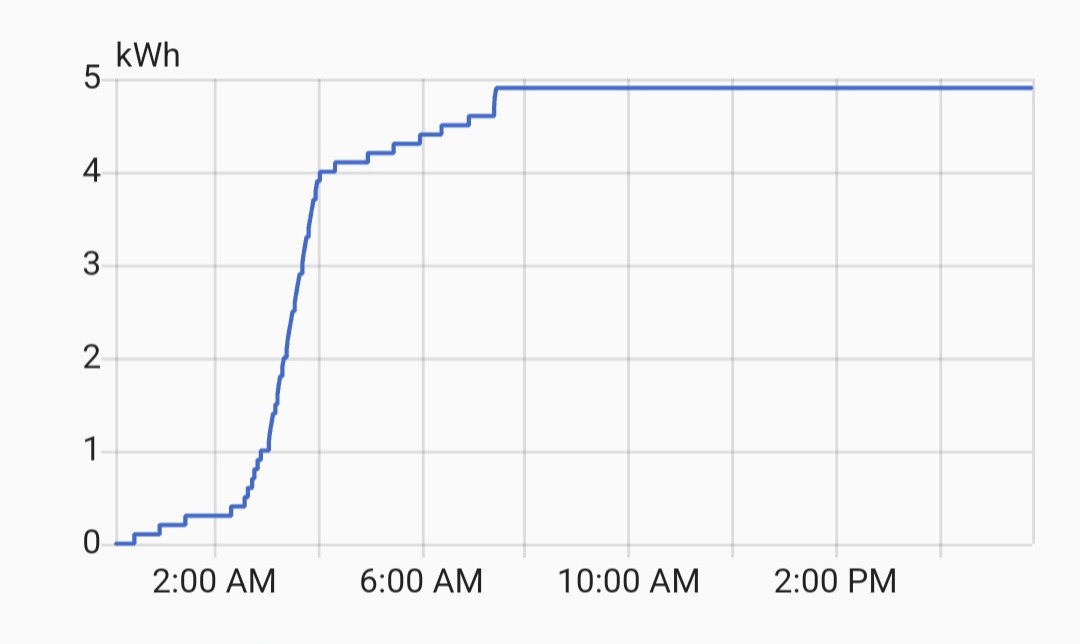
I was about to raise an issue in this forum, am seeing excessive "Solar to Home" figures today:
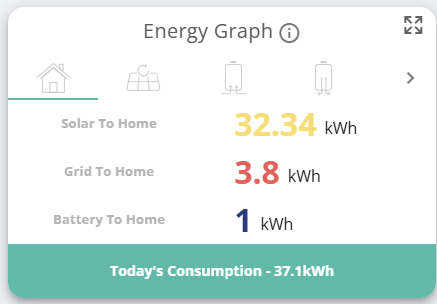
For comparison from app on yesterday's date (08/04/2025):
Generation to home: 4.46kWh
Generation to battery: 0.3kWh
Generation to Grid: 13.84kWh
Total Generation: 18.6kWH
Today is showing in app (at 6:20pm)
Generation to home: 32.33kWh
Generation to battery: 7.0kWh
Generation to Grid: 14.95kWh
Total Generation: 54.28kWH
I am seeing something similar. Although the Power graph shows something different although more in line with actual. The app is also showing that my battery sent nearly 15kwh to the grid today which is impossible as it hasn't charged all day and the battery isn't that big
Ha, our Generation to Home figures are nonsense too. It looks like the app has failed to record any generation for today at all, but has now logged a large chunk of it (almost 14 kWh !) in the half hour period ending 16:30.
I raised a bug through the app about nonsense Grid to Battery figures - which I assume are a symptom of this failure to report intraday Generation data correctly.
We have with the same issue here. Seems to be any of the functions relying on reporting/ aggregation such as in the app report or the dashboard are random-number-generators. ie anything as a Bar graph. The actuals in the inverter, and what my HomeAssistant collected from the inverter also, match what was actually generated (SolarEdge) - the line/ area graphs all appear correct.
ie 44.68kWh generated today according to the summary, 28.4kWh according to the inverter which is more accurate.
Ditto. Big spike here today in solar and grid to home at about half one today, when nothing was going on here! (This thing won't let me upload pictures again today Grrr)
Today's consumption showing as at 36.58 kWh when average daily recently for us is about 16 kWh!
Phew,
It’s not just me with this problem then looks like everybody is in the same boat, hopefully GE Will get this resolved ASAP. I have just rebooted my inverter to see if it helps.
I've for the same issue 😫numbers all over the place today 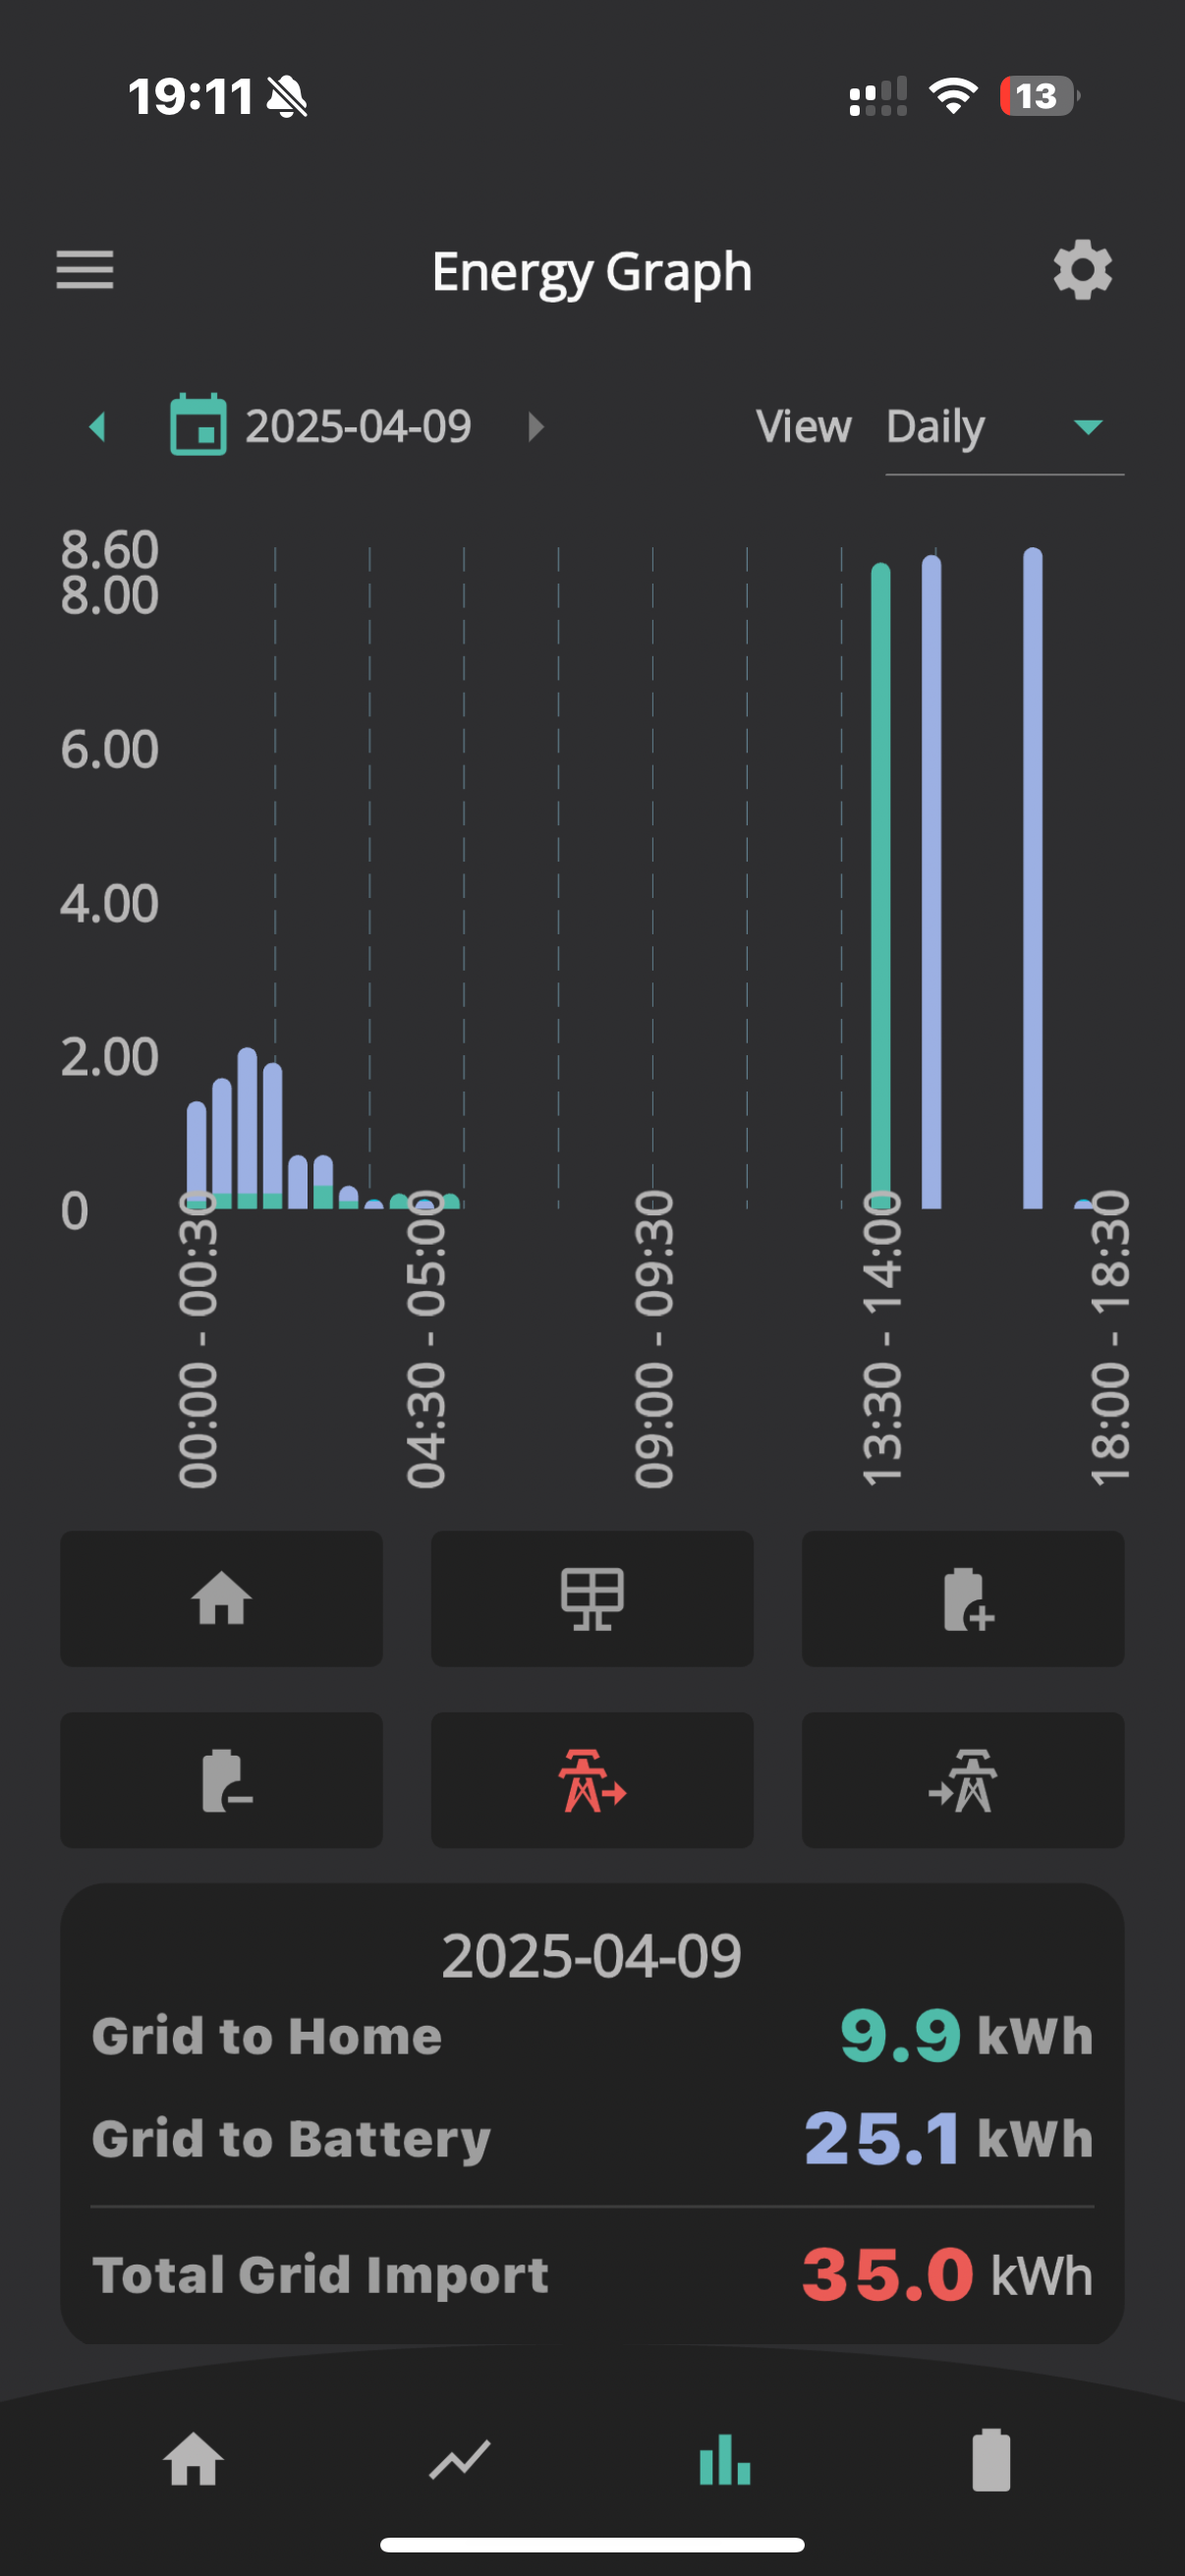
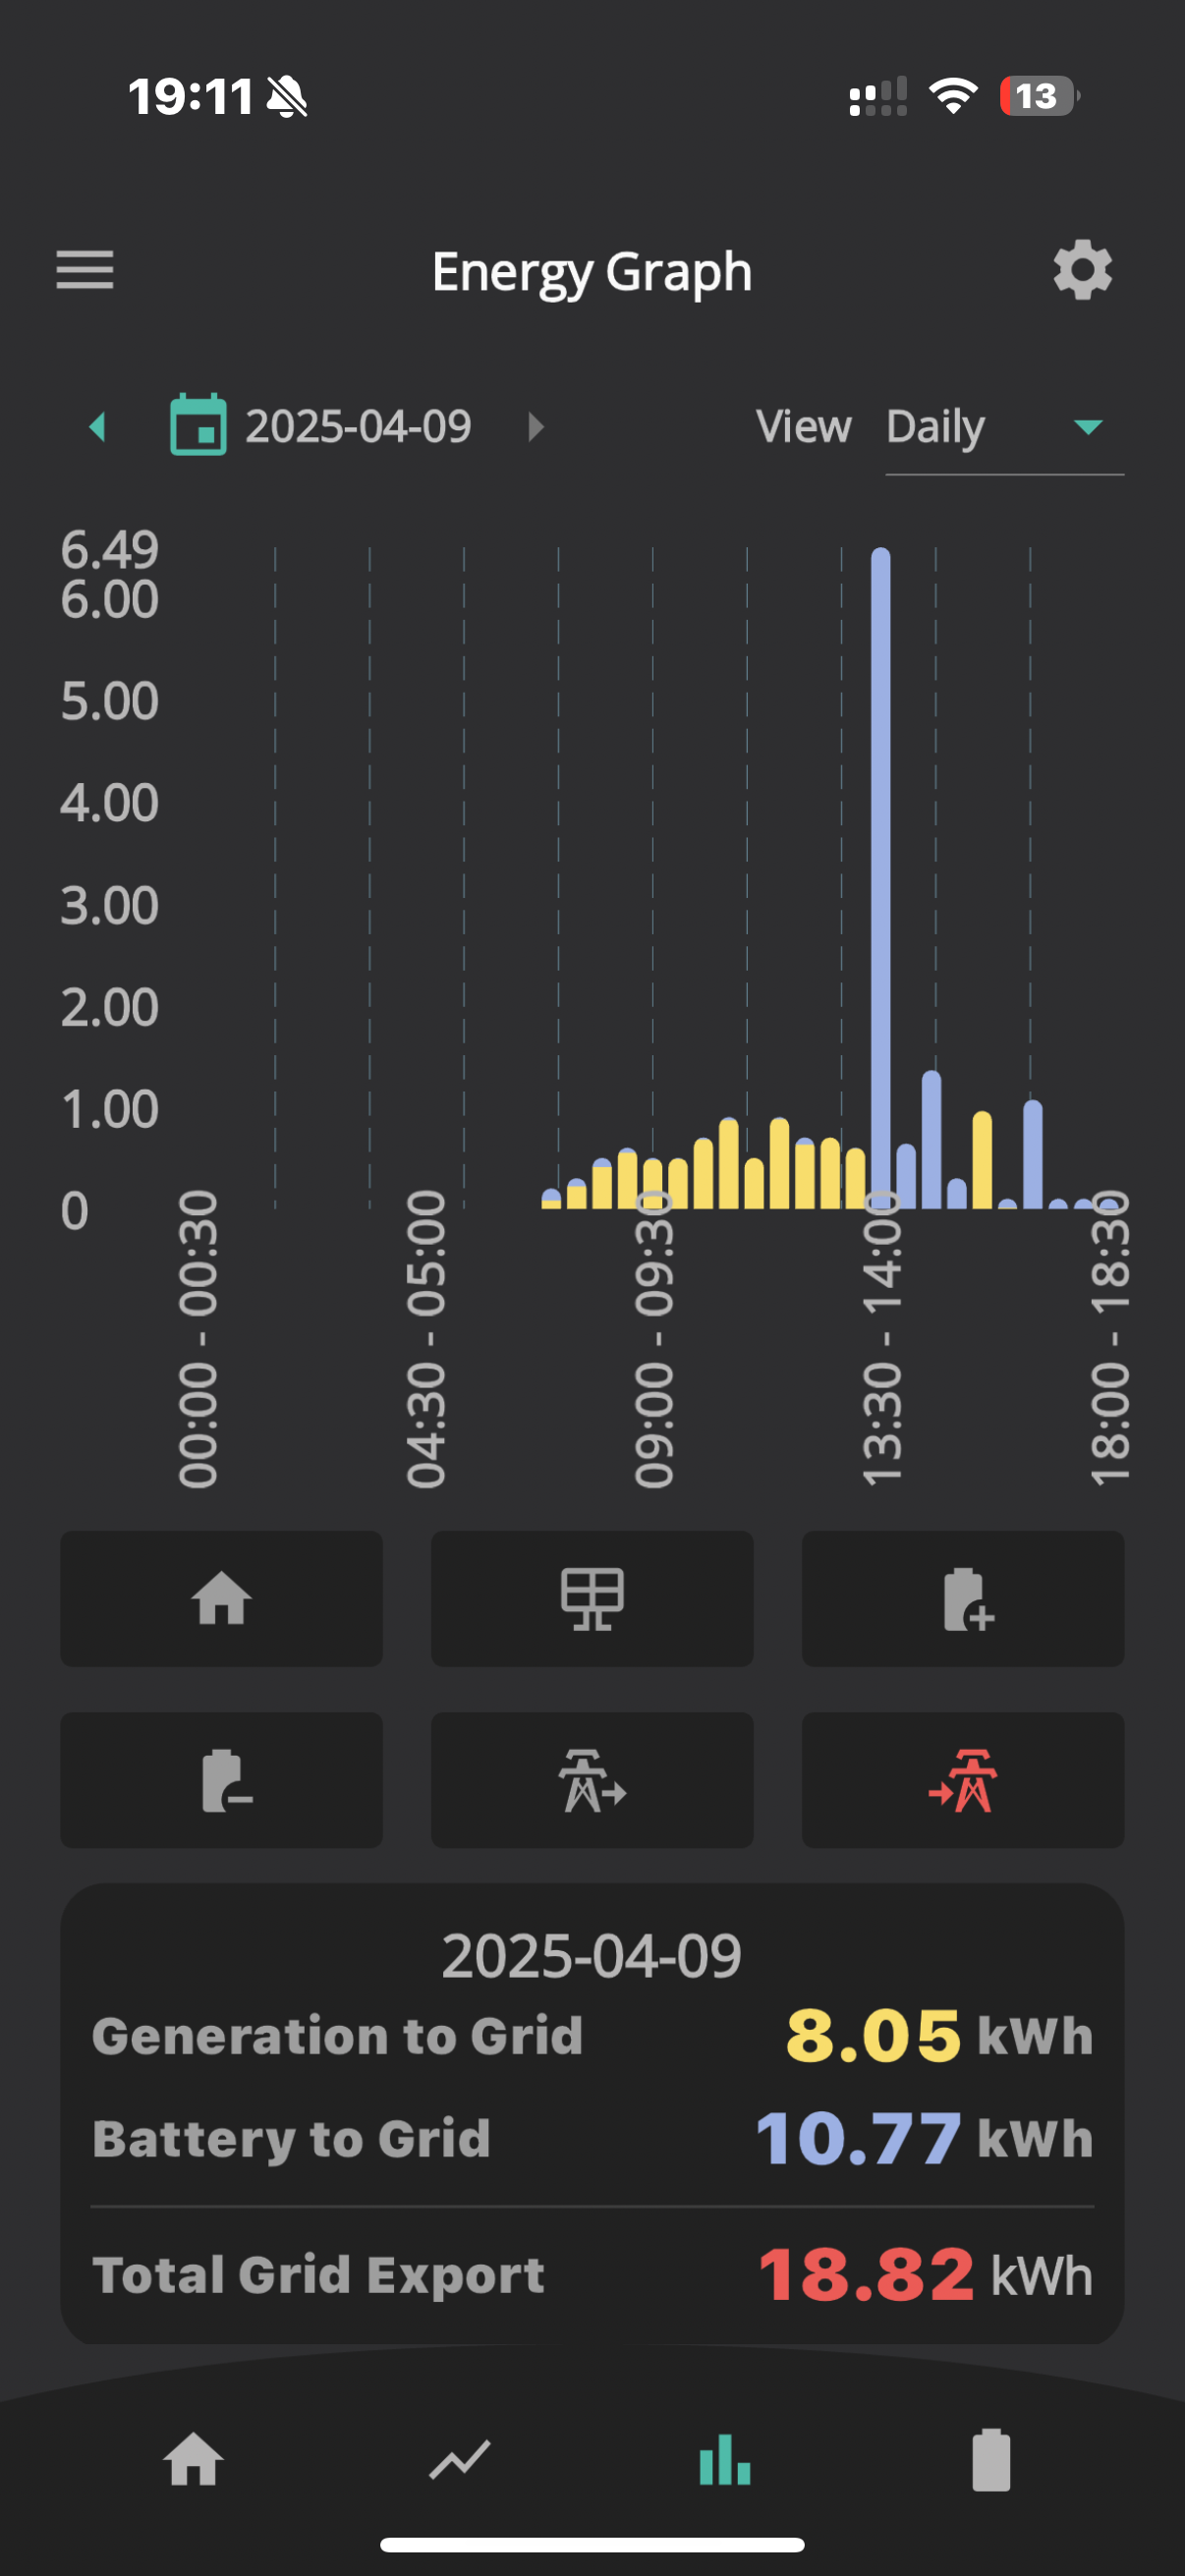
Yep - big spike today at 14:00 - had me worried - app and cloud data - First time for me - is it a know issue?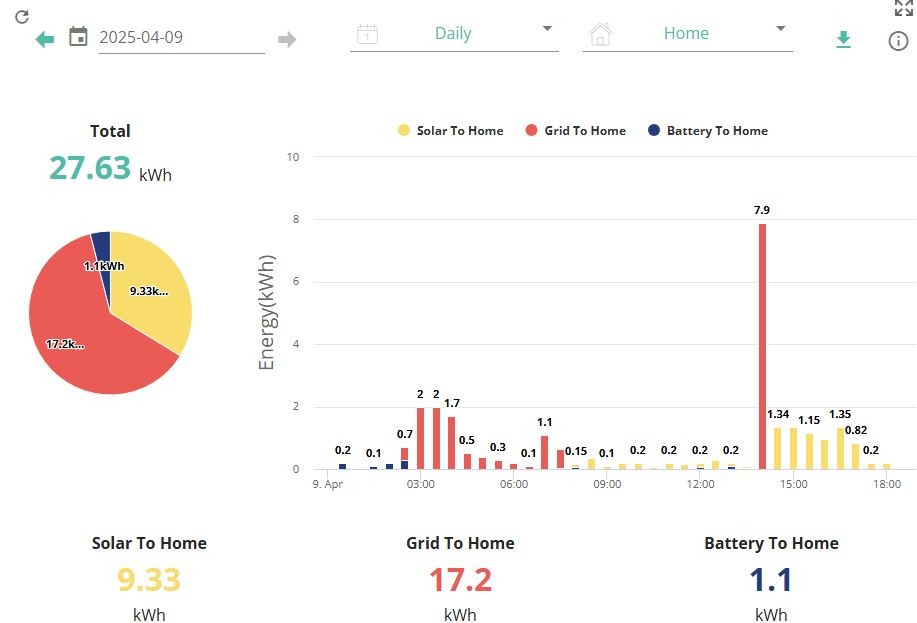
I'd guess a portal outage. The inverter sent what data it had when it could. There's no history on the inverter, it just sends the latest totals.
TX200 Thanks for the response - seems to have affected many!
+1
I have imported 3 kWh from grid and my solar generation is 3kwh above the best it's ever been.
Sort it GE
Mine has gone wrong as well but cloud seems to be accurate as far as I can tell.
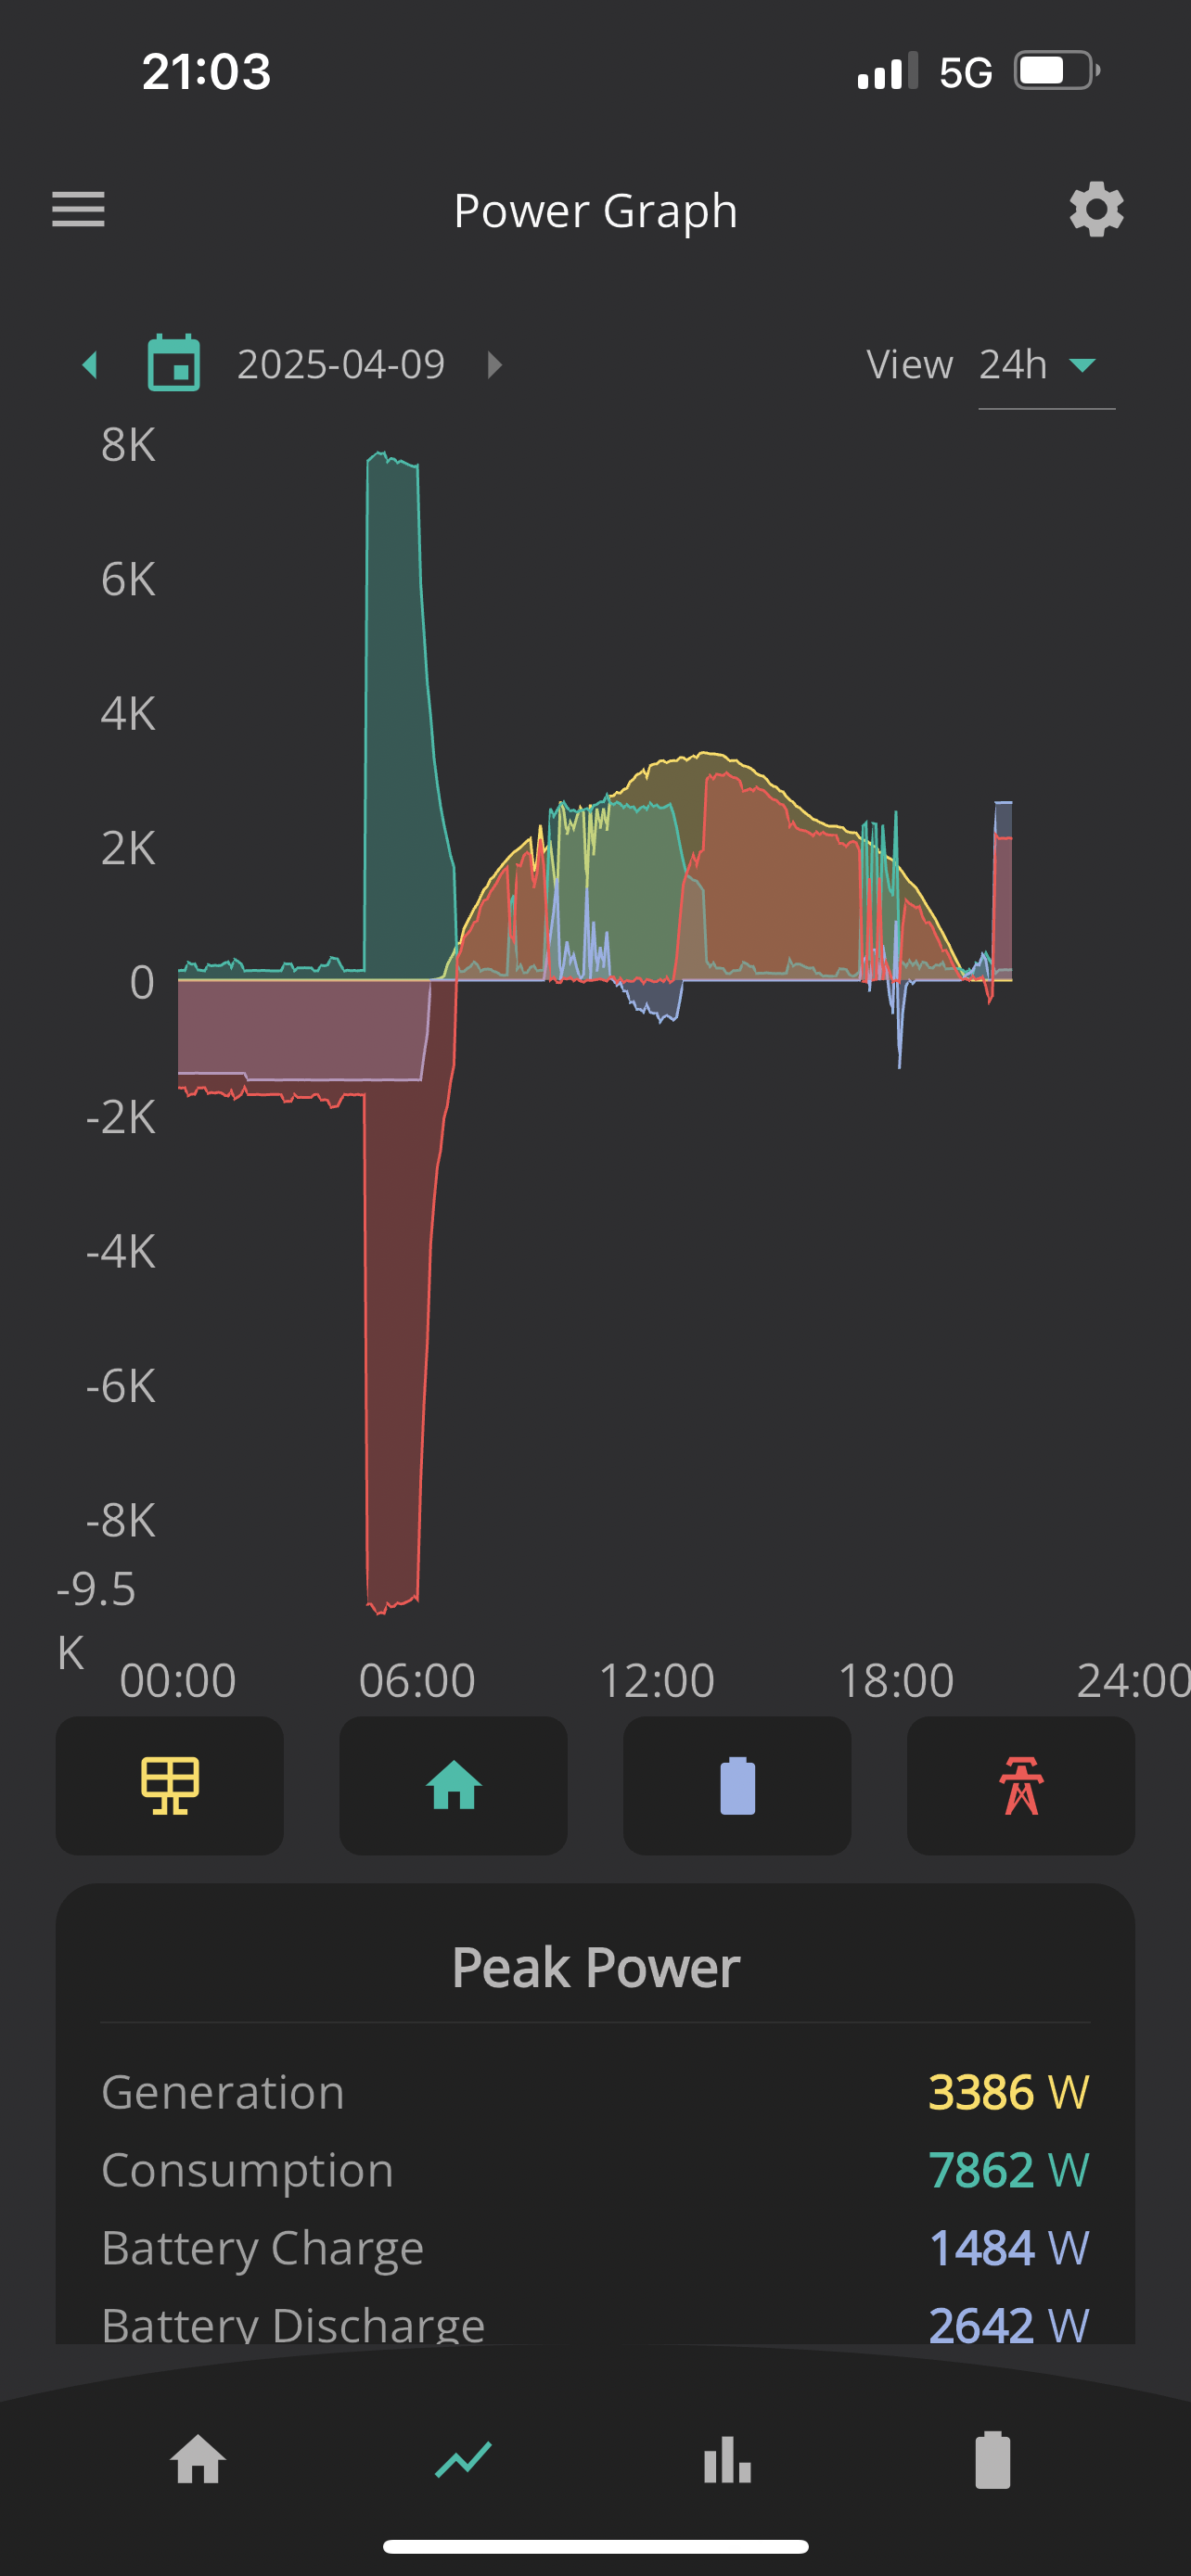
It seems strange that the paragraph is accurate, but the energy graph is all over the place
LMA I seem to have a similar problem today, very frustrating.
The portal seems to be giving the correct data but the android app is giving ridiculous import figures. It was last showing 58kw import when it's usually around 12Kw. The power graph seems normal.
Yes, we have anomalies today. 12kwh home consumption, while at the same time exporting the same to the grid. It's like the solar power export is routing through the battery!
Same here and noticed over the weekend; notably in my case Solar to Battery is being miss reported as from Grid.
Energy Graph in (iOS) App is completely wrong since 7 May. Similar for the web portal; with the "new" Energy Graph is completely wrong for all dates, the Energy Graph (Legacy) appears correct with the Grid In/Out matching my smart meter readings.
Power Graph seems to be sane in all cases; looks like whatever has been changed in the Energy Graph aggregation logic has gone very wrong. Glad to see it's not just me.
Same here. Hopefully GE can get the app and figures back to normal,
Same here. Hopefully GE can get the app and figures back to normal,
I've noticed impossible figures today. Will this be logged against my energy bill? Import and export all over the place!
Dandre in a word no. As your smart meter will still be working perfectly fine
I found the same and was concerned it was a fault with my system, especially as this is a reasonably new installation. It is saying I'm exporting lots from the grid to my battery when its full and suddenly massive spikes in solar generation and energy usage that just aren't happening. Thanks all for sharing already as good to be aware its not just me. Hope it gets fixed soon.
andypendle Ditto. Glad I found this thread. I thought I was going mad. The high bars on this chart do not match reality.
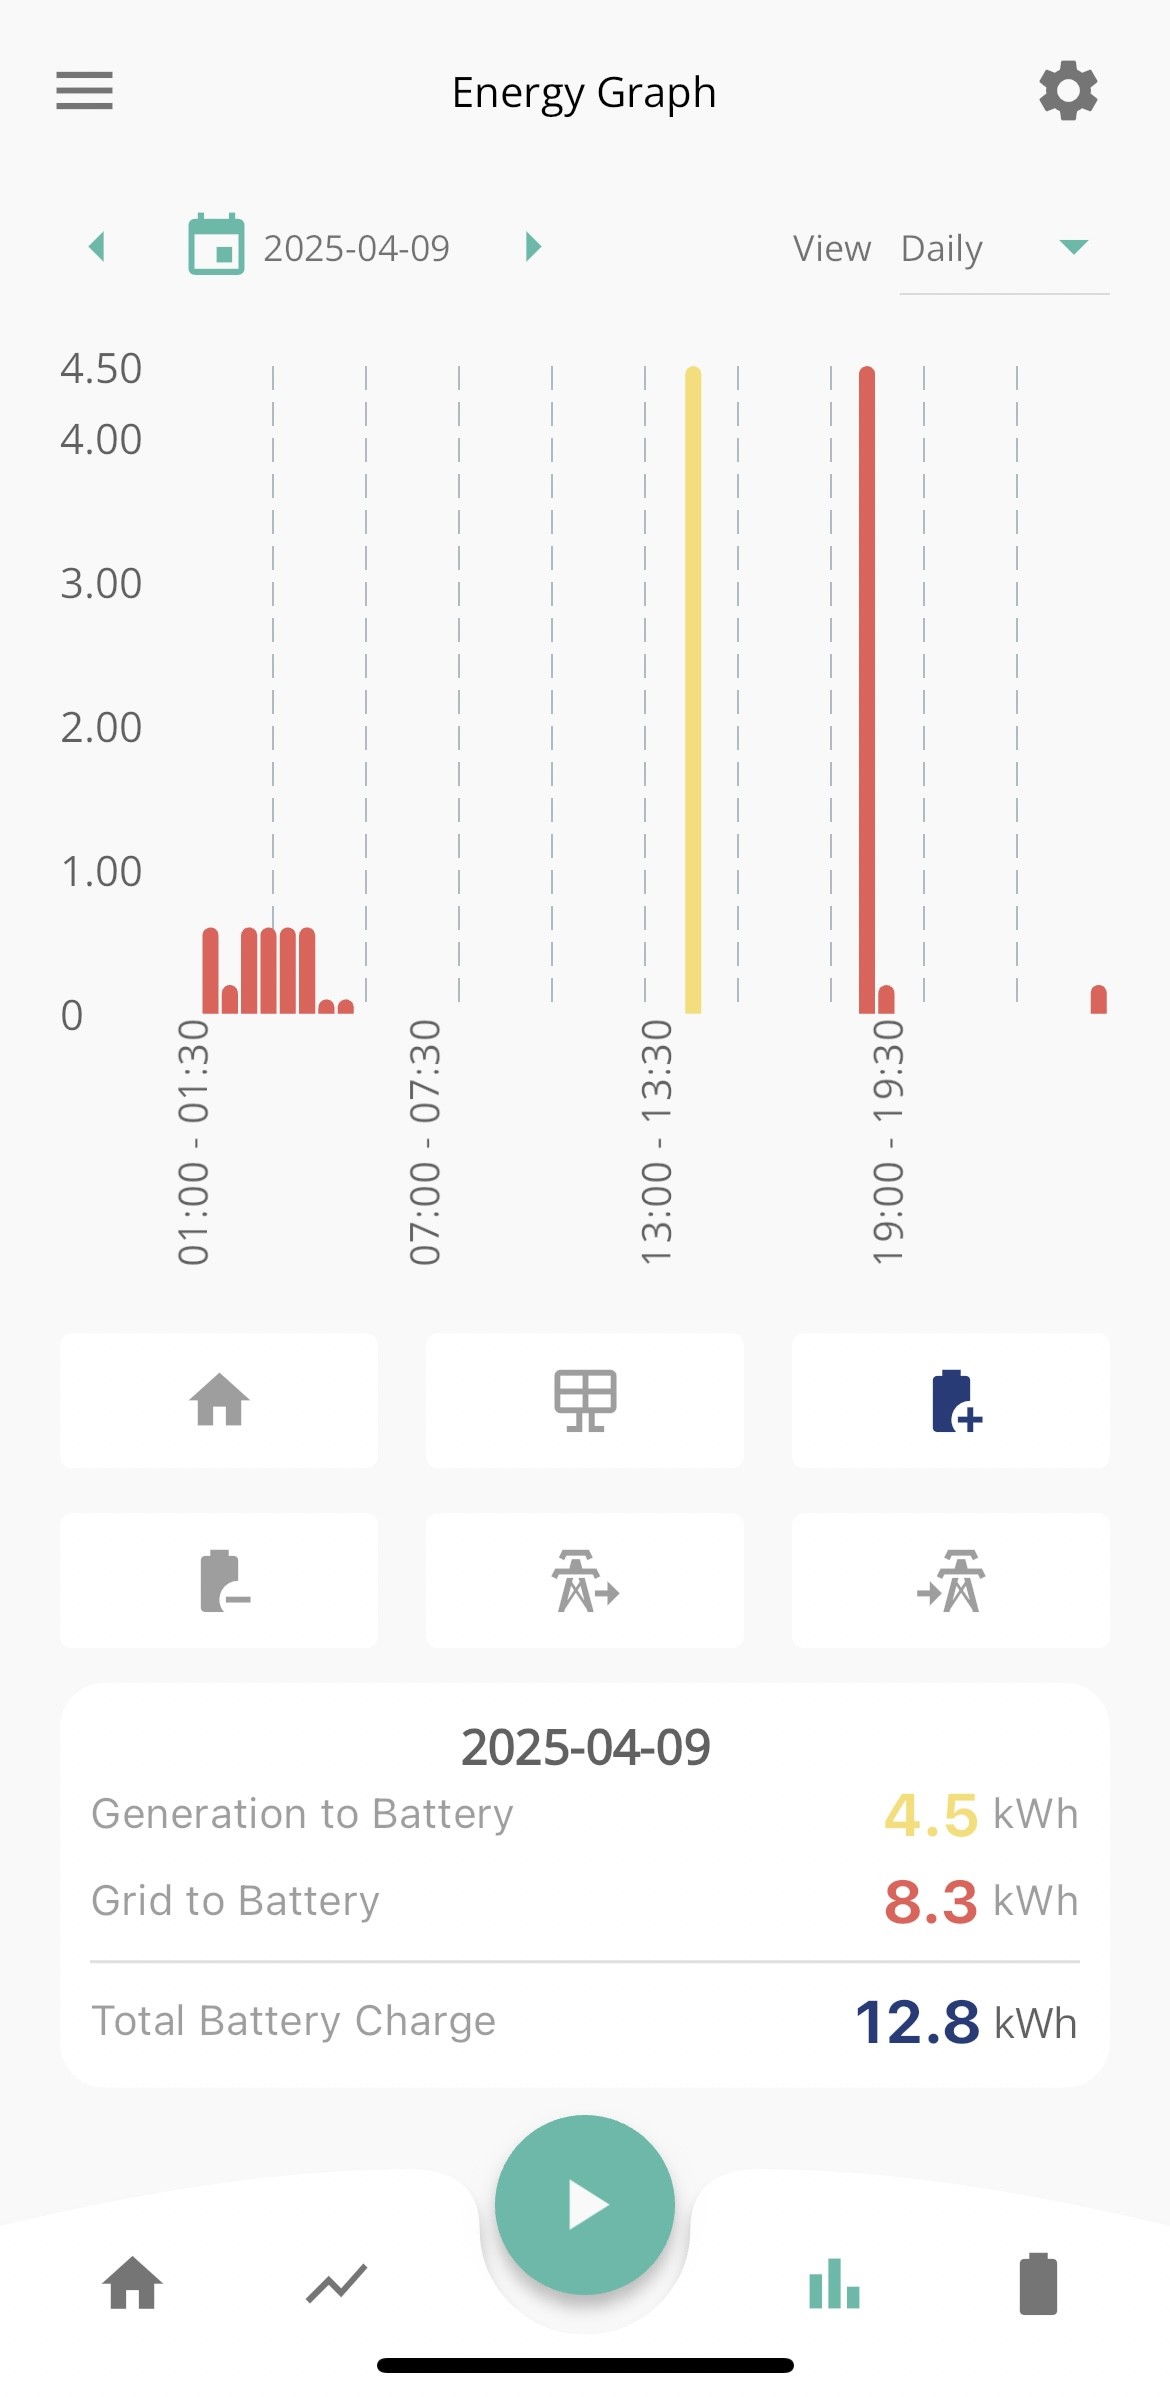
Just noticed same here this morning. I have my battery set to charge during low tariff hours, but app and cloud saying home also consumed 6kw at the same time... seems that it is doubling up? Anyone know if GE are doing anything to fix?
I too had similar problems yesterday. Showed a discharge of the battery to the grid and at the same time an equal import from the grid yet battery was full. Also a sudden spike of 10kw generation at 8pm in the evening. I've noticed recently that data in the app isn't close to real time, it takes an hour or more to show.
I too had similar problems yesterday. Showed a discharge of the battery to the grid and at the same time an equal import from the grid yet battery was full. Also a sudden spike of 10kw generation at 8pm in the evening. I've noticed recently that data in the app isn't close to real time, it takes an hour or more to show.

Same here. Yesterdays Energy Graphs have these errors:
Timeline:
13:30 - Battery to Grid 20kWh
13:30 - grid to home 14kWh
14:30 - generation to home 14.37kWh
14:30 - generation to battery 14.37kWh
15:00 - grid to battery 14.2kWh
16:00 - generation to home 15.75kWh
16:00 - generation to battery 14.3kWh
16:30 - grid to battery 14.37kWh
The Power Graph on the App doesn't show these spikes, and the Octopus app confirms there were no imports/exports matching these figures/times.
Having had a poke around the graphs it looks like there have been some errors appearing elsewhere but it's dependent on which view I'm using.
Setting the Energy Graph to 'Yearly' It reports for February:
Battery to home 4687kWh
Grid to battery 3137kWh
Setting the graph to 'Monthly' It reports for February:
Battery to home 386kWh
Grid to battery 424.5kWh
And, if I switch the Energy Graph to 'Total' I have an extra January!
So I'm not the only one! Phew!
Weird energy histograms started on 7/4/2025, showing enormous generation peaks just before midnight. This all happened after I updated the inverter on the 4th, and corrected the time (for some reason it was set at UTC+2) on the 5th.
I have browsed the inverter data (PV and Meter) and it all looks normal, as do the power charts.
Strangely, the corruption began on 7 April on my iMac and iPhone, but on 8 April on my Samsung tablet.
I hope that GE can sort this out, and retrospectively if poss.
I've raised a complaint with GE on these wildly inaccurate figures. I'll let you know when and if I get a response.
My Power graph looks normal for yesterday but the Energy bar chart is nonsense. Strange, impossible peek between 16.00 and 16.30 Gen 21kWh, Home use 21kWh and my 8.2
kWh battery managed to discharge 26.45 kWh in that half hr.
This is GE's reply to me reporting the issue.
"We are aware of an issue with the GivEnergy app at the moment but please do not be concerned as this is only for reporting data.
Your system will still continue to work as expected, however the data may look unusual while we are working on this issue.
Thank you for your understanding and patience while we work to resolve this."
I find the portal Energy graph (Legacy) is fine, its just the new reporting that was wrong as far as I could tell
Ah good, not just me then! Mine is claiming a massive 9kWh spike of solar between 1800-1830 last night.
If you go to the top-left menu in the App, and select ‘Help’ you’ll see that GivEnergy have now logged this as a ‘Known Issue’
Yes, something odd going on.
Showing high battery export in the middle of the day which is not see in the Power Graph display !!!
"Chatted" to GIvenergy today and they said there is a known issue with the App
Yes same for me actors all areas, consumption, import, export etc
It's listed as a known issue also
This morning the figures look like they are back to normal, fingers crossed.
I have been experiencing very similar issues for the past few days, although the Android App seems to be in sync with the portal. There have been periods with several hours of no activity at all, yesterday 08.30 - 12.30 and periods of frantic import, again yesterday, 8.7Kwh in the Flux early period.
I am pleased to hear that the problem has been acknowledged.
Ortwin looks like they’ve sorted it. Let’s hope they can fix the historical data as well
Interesting - ours isn’t fixed (in the iOS app) … today’s data still shows some gaps (eg. no data at all for some half hour periods) and we still apparently put more kWh into our battery in the last half hour than it has capacity for.
Did your problem just fix itself, or did you uninstall/reinstall the app etc?
Mine looks ok on iOS. Didn’t do anything.
It looks to me like the root of the problem lies in the API call GetEnergyFlowData (energy-flows).
I can retrieve this using either my python or powershell api scripts.
The data retrieved for this for the last few days shows the same nonsense that shows up in both the app and the energy graph in the portal. So I guess this is the call they use when displaying the energy graph in the app and portal.
The other api calls seem to work sensibly.
Today's solar generation is about double what it should be reading. Peak power values look normal but total generation is double for my 3kwh array.
Well it looks like the gremlins have struck again but this time my export readings are a third of the android app values(yes I know there is a lag between what the app says and the portal)
I noticed that my android phone has a different app version than my tablet.
Phone version 3.4.10.5638
Android tablet is 3.4.9.5636
No new app updates available.
There also seems to be a much longer lag in data appearing on the app. At 7:41 today I have no data reported.
Makes the app worse than useless.
An update from GE would be appreciated.
My system shows zero import when the portal is saying I have had 12.1 KW. I shall email GE support and wait for their response (yet again)
No data available for me. Was lagging a few hours behind yesterday and now nothing today.
I'm seeing a difference between app and portal data: portal shows my grid, battery and solar activity but the the app shows nothing for today, other than what's currently happening. I deleted and reinstalled the app but no change
Having the same problems can’t find any reply from Givenergy or a solution.
There’s an issue that GivEnergy are on with. If you look at known issues it it explains it in there
Frustration is creeping in! How long is this going to take? Five days since the last update on 'Known Issues'.
The API energy-flows call was the root of the problem. This had been changed on Apr 9. On Apr 13 they reverted to a previous version and that fixed the energy graph issue for me.
There was a further API update on Apr 15. I'm not sure what that did but the energy graph was still OK for me after that.
Again it says the latest API is now Apr 17. Energy graph still OK for me.
Note that these changes have not been reflected in the known issues comment or in the API change log.
Thanks for that explanation which, sadly, means very little to me. I have absolutely no idea what an API is in this or any other context. What I see is that the detail on the energy graphs firstly, just doesn't look right with 2 to 3 hour time periods with no activity whatsoever, which almost certainly can't be the case (and has not been the case over the last 3 years) and secondly, does not coincide with my meter readings. I have abandoned my analysis for this month, which ends today. I will recommence the data capture into my spreadsheet tomorrow. See where we go.
Thanks for that explanation which, sadly, means very little to me. I have absolutely no idea what an API is in this or any other context. What I see is that the detail on the energy graphs firstly, just doesn't look right with 2 to 3 hour time periods with no activity whatsoever, which almost certainly can't be the case (and has not been the case over the last 3 years) and secondly, does not coincide with my meter readings. I have abandoned my analysis for this month, which ends today. I will recommence the data capture into my spreadsheet tomorrow. See where we go.
The Application Programming interface (API) is the definition of calls that an application cam make to a server.
In this case the application is either the GivEnergy App or the web portal. The calls can either to be to perform some function or to retrieve data.
The issue I was referring to was one of the calls (energy-flows) to retrieve a particular summary of data that was used by the application to display the energy graph.
The fault is probably not related to the big gaps in the data that you describe. It is possible these may be caused by unreliability in the connection from the GivEnergy Inverter back to the GivEnergy server (in the cloud). If your inverter and its wifi dongle is a distance from your wifi router then you may need to improve the wifi signal.
For reference the API is detailed at https://givenergy.cloud/docs/api/v1
Other applications may also use this. I use it download data onto spreadsheets so I can get better summaries of system performance.
This has started happening again for me from yesterday. Anyone else affected?
[unknown]
Yep yesterday...
The API says it was updated June 2. so it is possible that something got screwed up.
I'm not seeing a problem at the moment, but we are under heavy cloud here at the moment so generation is miserable anyway.
I'll try out the API call GetEnergyFlowData which was the previous culprit.
Hmm. Starting at about 18:00 yesterday some of the data fields in the GetEnergyFlowData call are just returning 0 which does look suspicious.
[unknown] what do you mean Suspicious?
There are 7 data fields returned by this call at 30 minute intervals.
PV To Home
PV to Battery
PV To Grid
Grid To Home
Grid to Battery
Battery To Home
Battery To Grid
While it is quite normal for some of these to be zero, there seemed to be some unexpected zero values.
It looks like the API was updated again yesterday, and the values look more consistent.
The data on my App is not back to normal.
I guess I might need to update it, but no update available, it was last updated 4 days ago.
I have some odd data in my monthly report for May (generally a very sunny month for me) Is this part of the same issue you are discussing, or something else ?
(I have GivBat 8.2 battery and a 2.8kW peak-rated solar array, and relatively little domestic use; typically I export half of what I generate over the year. It is very rare for me to draw more than 3kW, and only briefly, though I run an electric oven, hob, and immersion heater. The immersion heater is set up on an Immersun device that gives it a pre-dawn "boost" regardless of whether it comes from battery or mains (Economy7 tariff), and also diverts power to the HW tank any time it detects "export" occurring - could this be confusing the Givenergy data logging ?).
My issue is with the "Grid - Daily" bar chart which says that in MayI have imported 65.4 kWh & exported 193 kWh. My actual metered (and billed) consumption totalled only 10 kWh between 25/4 & 27/5, leaving me with a "gap" of ca 55 kWh to explain. Any comments or suggestions ? Thanks Nick
I have some odd data in my monthly report for May (generally a very sunny month for me) Is this part of the same issue you are discussing, or something else ?
(I have GivBat 8.2 battery and a 2.8kW peak-rated solar array, and relatively little domestic use; typically I export half of what I generate over the year. It is very rare for me to draw more than 3kW, and only briefly, though I run an electric oven, hob, and immersion heater. The immersion heater is set up on an Immersun device that gives it a pre-dawn "boost" regardless of whether it comes from battery or mains (Economy7 tariff), and also diverts power to the HW tank any time it detects "export" occurring - could this be confusing the Givenergy data logging ?).
My issue is with the "Grid - Daily" bar chart which says that in MayI have imported 65.4 kWh & exported 193 kWh. My actual metered (and billed) consumption totalled only 10 kWh between 25/4 & 27/5, leaving me with a "gap" of ca 55 kWh to explain. Any comments or suggestions ? Thanks Nick
NickT To get the Grid Import for May, go to the portal and select "My Inverter". Go along to the "Meter Data" tab. Change the date at the top to 31/5. Note down the value for "Grid Import Total". Change the date to 30/4. Again note down "Grid Import Total". Subtract one from the other.
Is that a better value?