R
#1 Roxy
Is there any way I can extract/see data on consumption between time zones over time periods, e.g. between 2300 and 0700hrs for, say, February?

Is there any way I can extract/see data on consumption between time zones over time periods, e.g. between 2300 and 0700hrs for, say, February?
From the web portal Inverter Tab, Inverter data you can download each days worth of data. There is no easy way of getting a longer period. The only other way is to download your smart meter data from DCC (Data Communications Company) via Bright or N3rgy online.

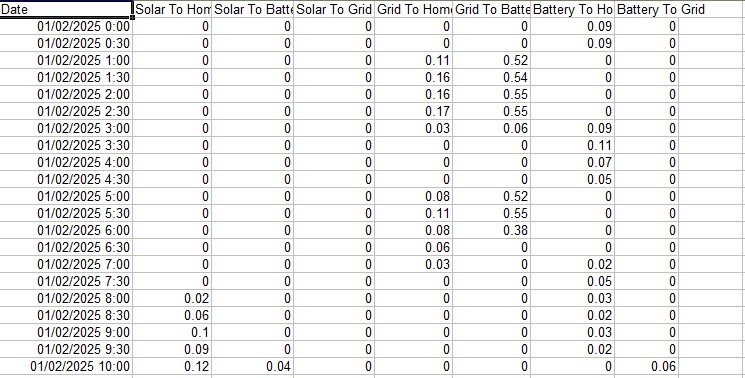
Or use the web portal Energy Graph (Legacy) and the 'monthly' tab . The Download button on that will export energy flows data into a .csv file, openable in Excel or similar, and then you can filter out the required time range. Data is in columns - solar generation x 3; grid import x 2; battery input x 2. For total consumption just add solar/home, grid/home & battery/home. HTH