Battery Cell Performance Monitoring

112 comments started 2025-07-26 last 2026-07-09
GivEnergy ProductsBattery
R
#1 Rubikcube

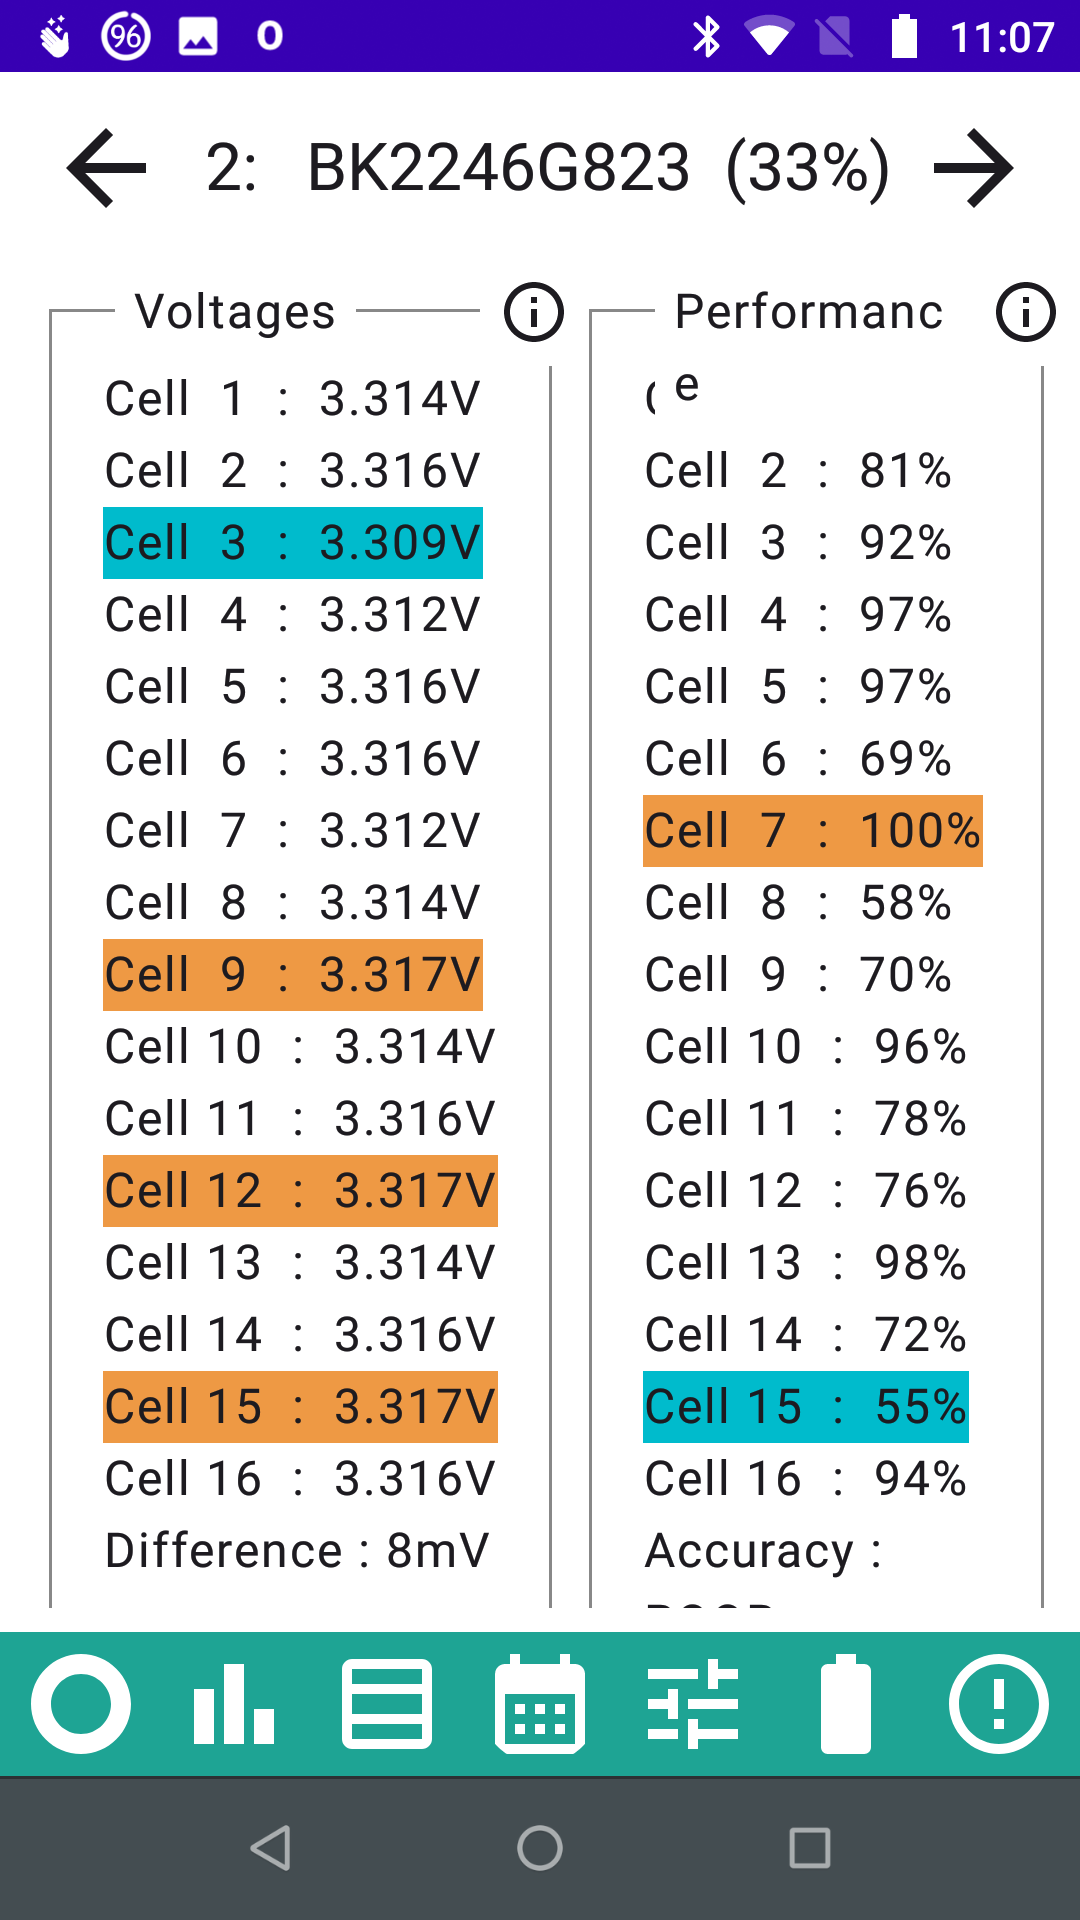
In any battery where cells are connected in series, the overall performance of the battery is limited by the performance of the weakest cell. GivEnergy batteries have a BMS with active balancing, which keeps the cells in step, but can't perform miracles. When one cell fails, the whole battery will fail.

By my understanding, GE have been selling batteries with a 10-year warranty since 2018, so all batteries are currently covered by warranty until at least 2028. After the warranty expires I guess we will be on our own.

When a battery eventually fails, the only choices are to replace the entire battery (or the entire system) or just replace one cell that has failed. Replacing a cell is a specialist job, but it is likely that repair businesses will offer this service once a demand exists.

It is therefore useful to know if one cell is underperforming prior to the battery failing.

All GE systems send cell voltage data to the portal every 5 minutes. Unfortunately GE only make this data accessible to their support staff, it is not accessible by customers. Customers can use GivTCP to record cell voltage history data, but analysing it is not so simple. Plotting a short history can yield a pretty rainbow, but doesn't tell the whole story because the rainbow changes from cycle to cycle. Plotting a long history typically results in an unintelligible mess.

It is worth noting too that the cell voltage readings have the (lack of) accuracy similar to other GivEnergy figures. The reading can change even when the cell voltage doesn't. This "noise" in the readings needs to be filtered out.

So I started recording a history of the cell voltages from my own battery, and trying to find a good algorithm to analyse them. The algorithm I settled on just reads through the history comparing numbers and doing some adding and subtracting, eventually coming to a "kind of total" for each cell. This led me to realise there is no reason to record the history, the "totals" can simply be accumulated in real time.

I have now incorporated this algorithm into my android app, converting the final "totals" into percentages for a more readable result. I don't really know how well it works, and it is likely going to need some improvements.

This is the thread where you can post your results (particularly interested if you have an older battery), and provide feedback that I can use to improve the algorithm.

R
#2 Rubikcube

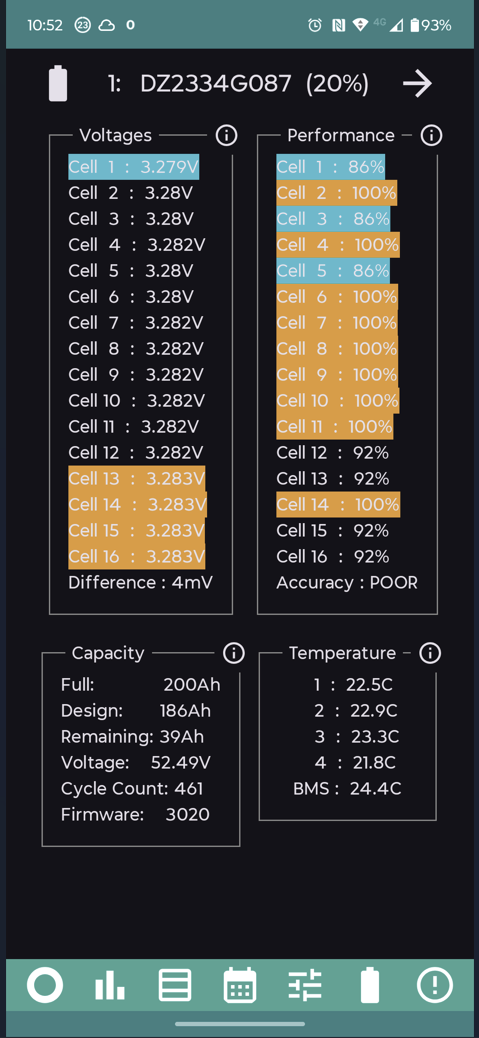
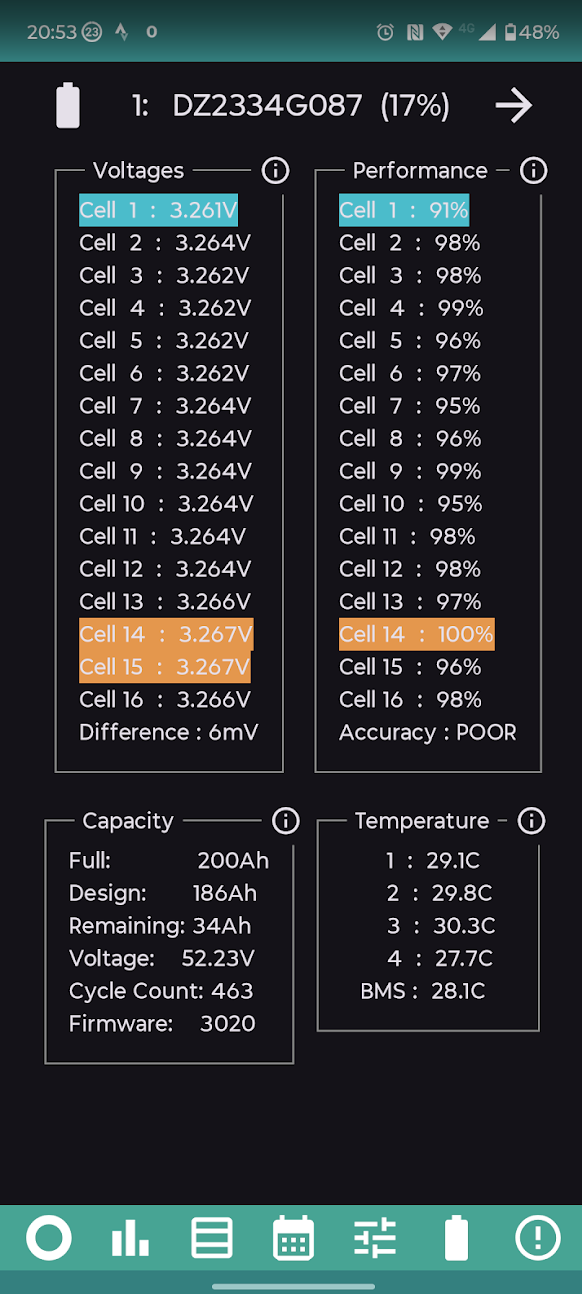
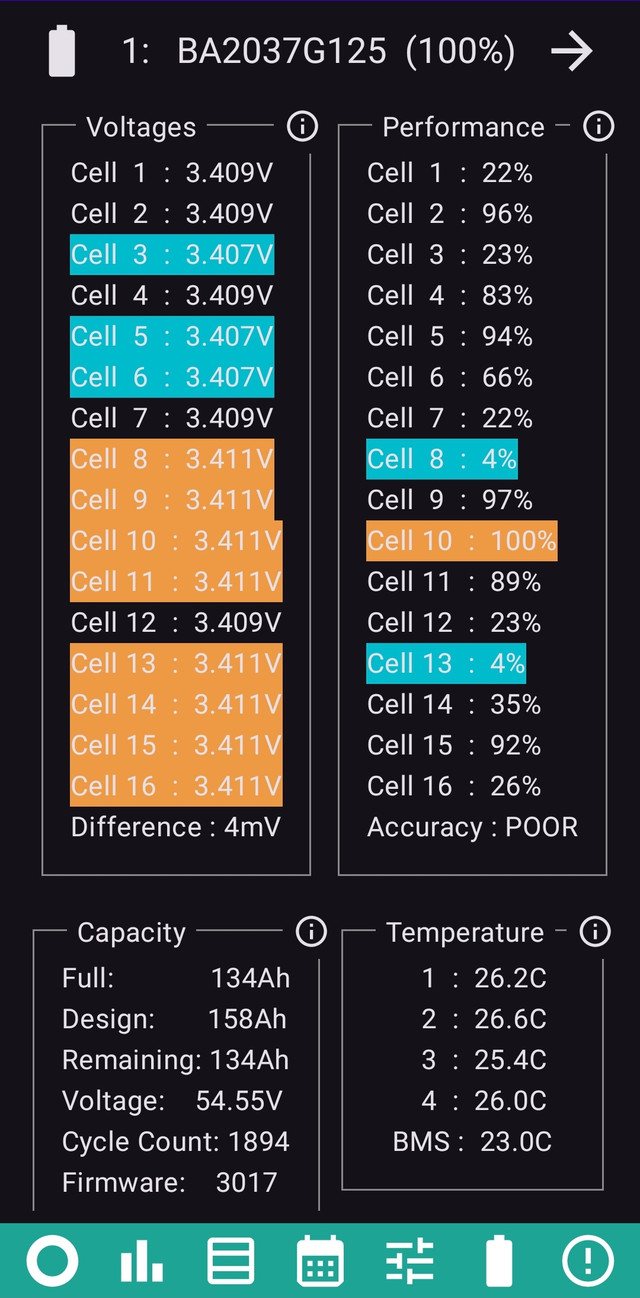
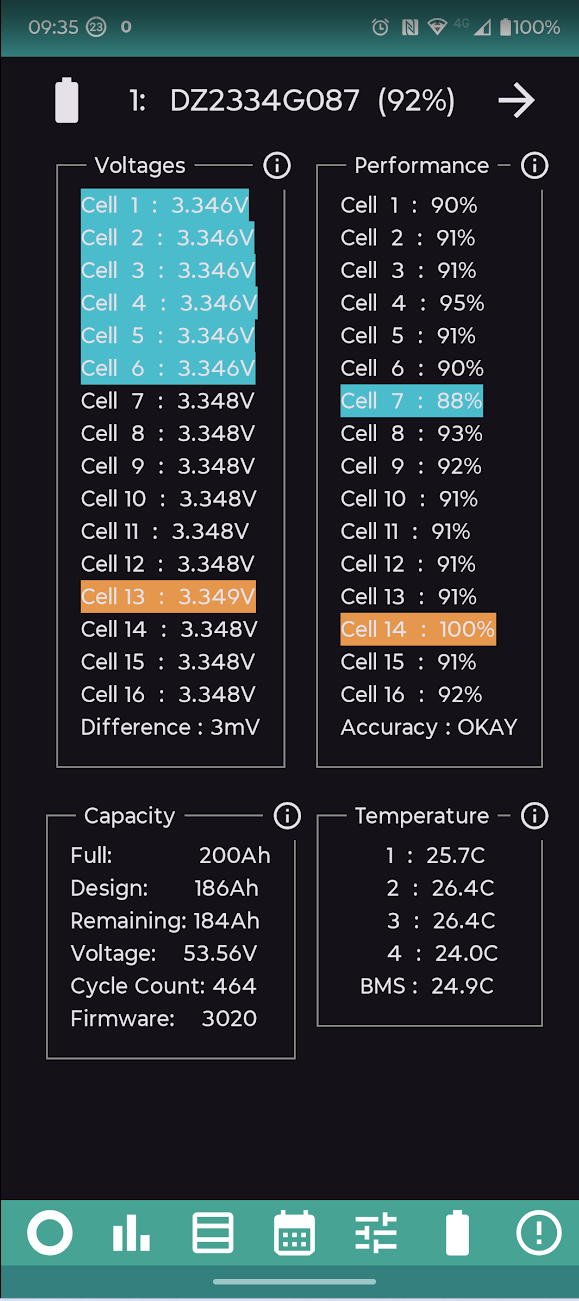
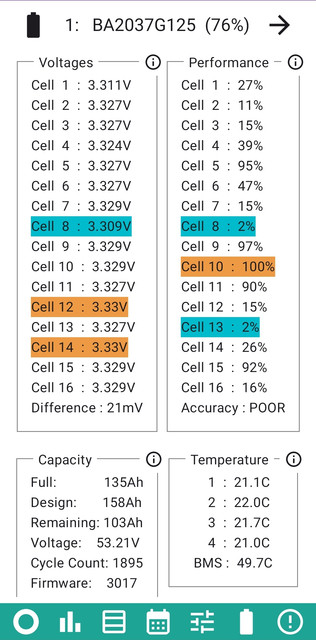
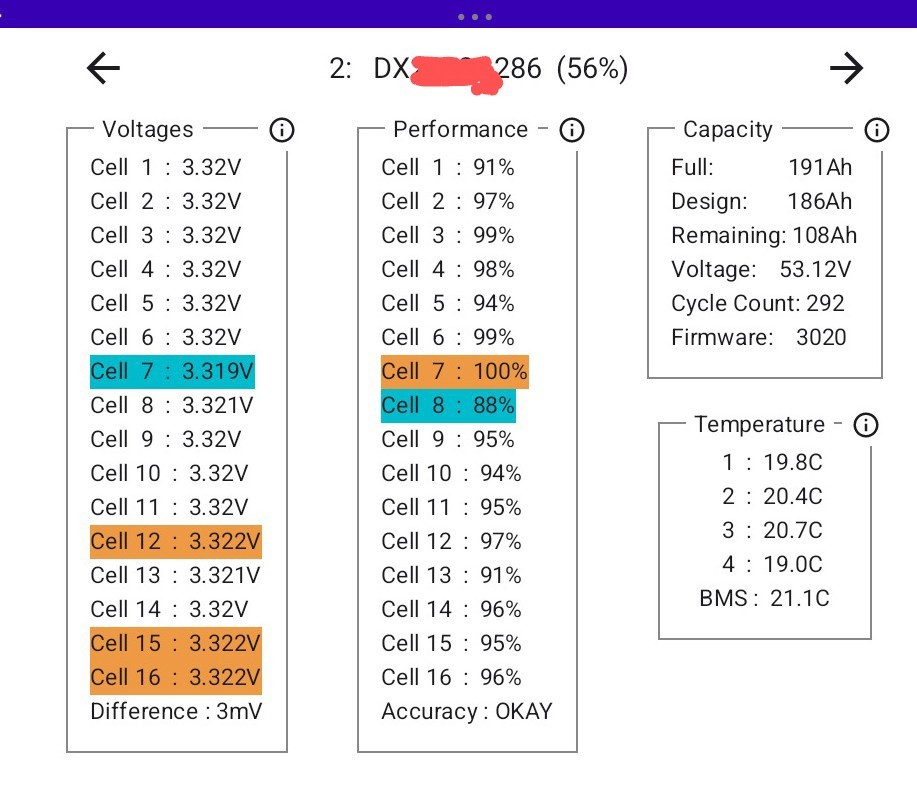
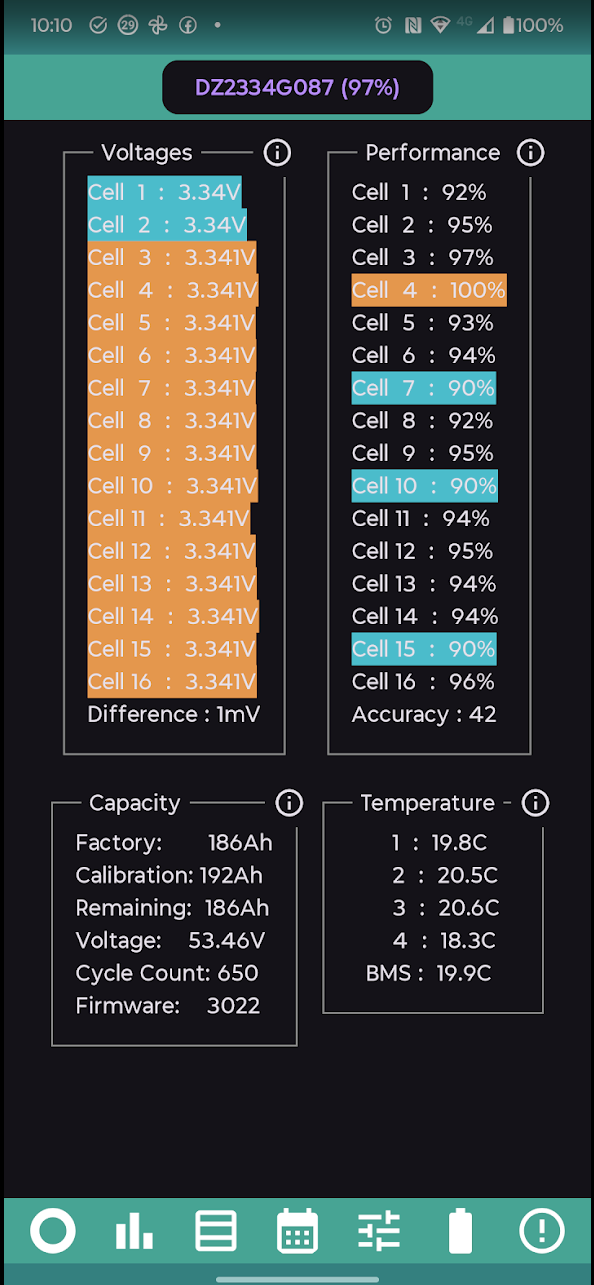
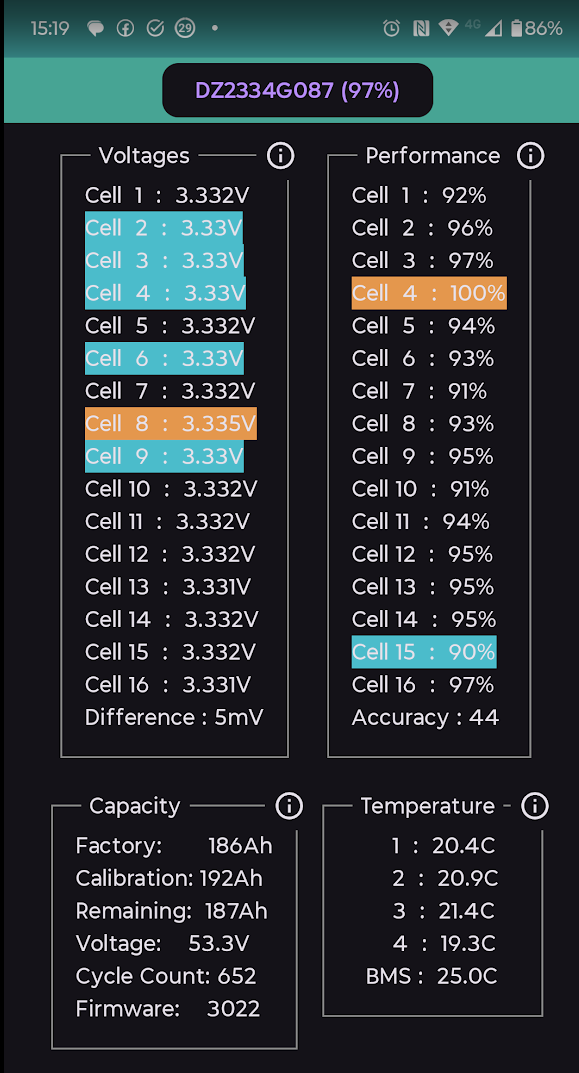
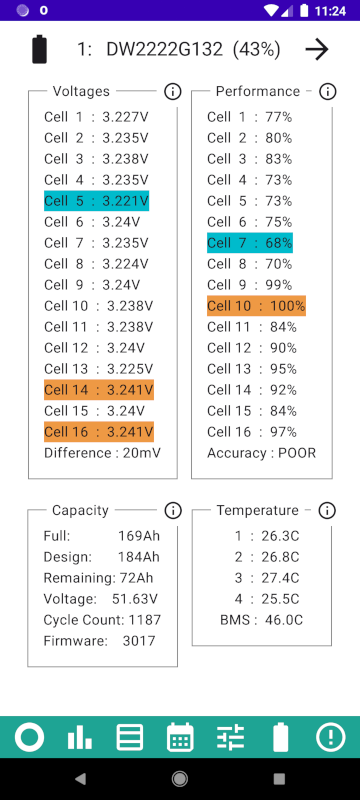
To start things off here is an early result from my battery. Note the highs and lows are now highlighted, and the performance of cells bears no relation to the cell voltages.

#3 hoggy

Mines currently gathering data but as its probably one of the older, more abused examples it might be useful to you.
Any merit in adding a rudimentary SOH value? (Full/Design x 100) - for those lucky enough to be >design it would need to limit to 100%.
Currently at 83% SOH.

M
#4 M_J

I am travelling at the moment but during August I will get the data as I have an early battery and have had a few issues so it will be interesting to see if we can glean anything.

More in August

W
#5 wrighar

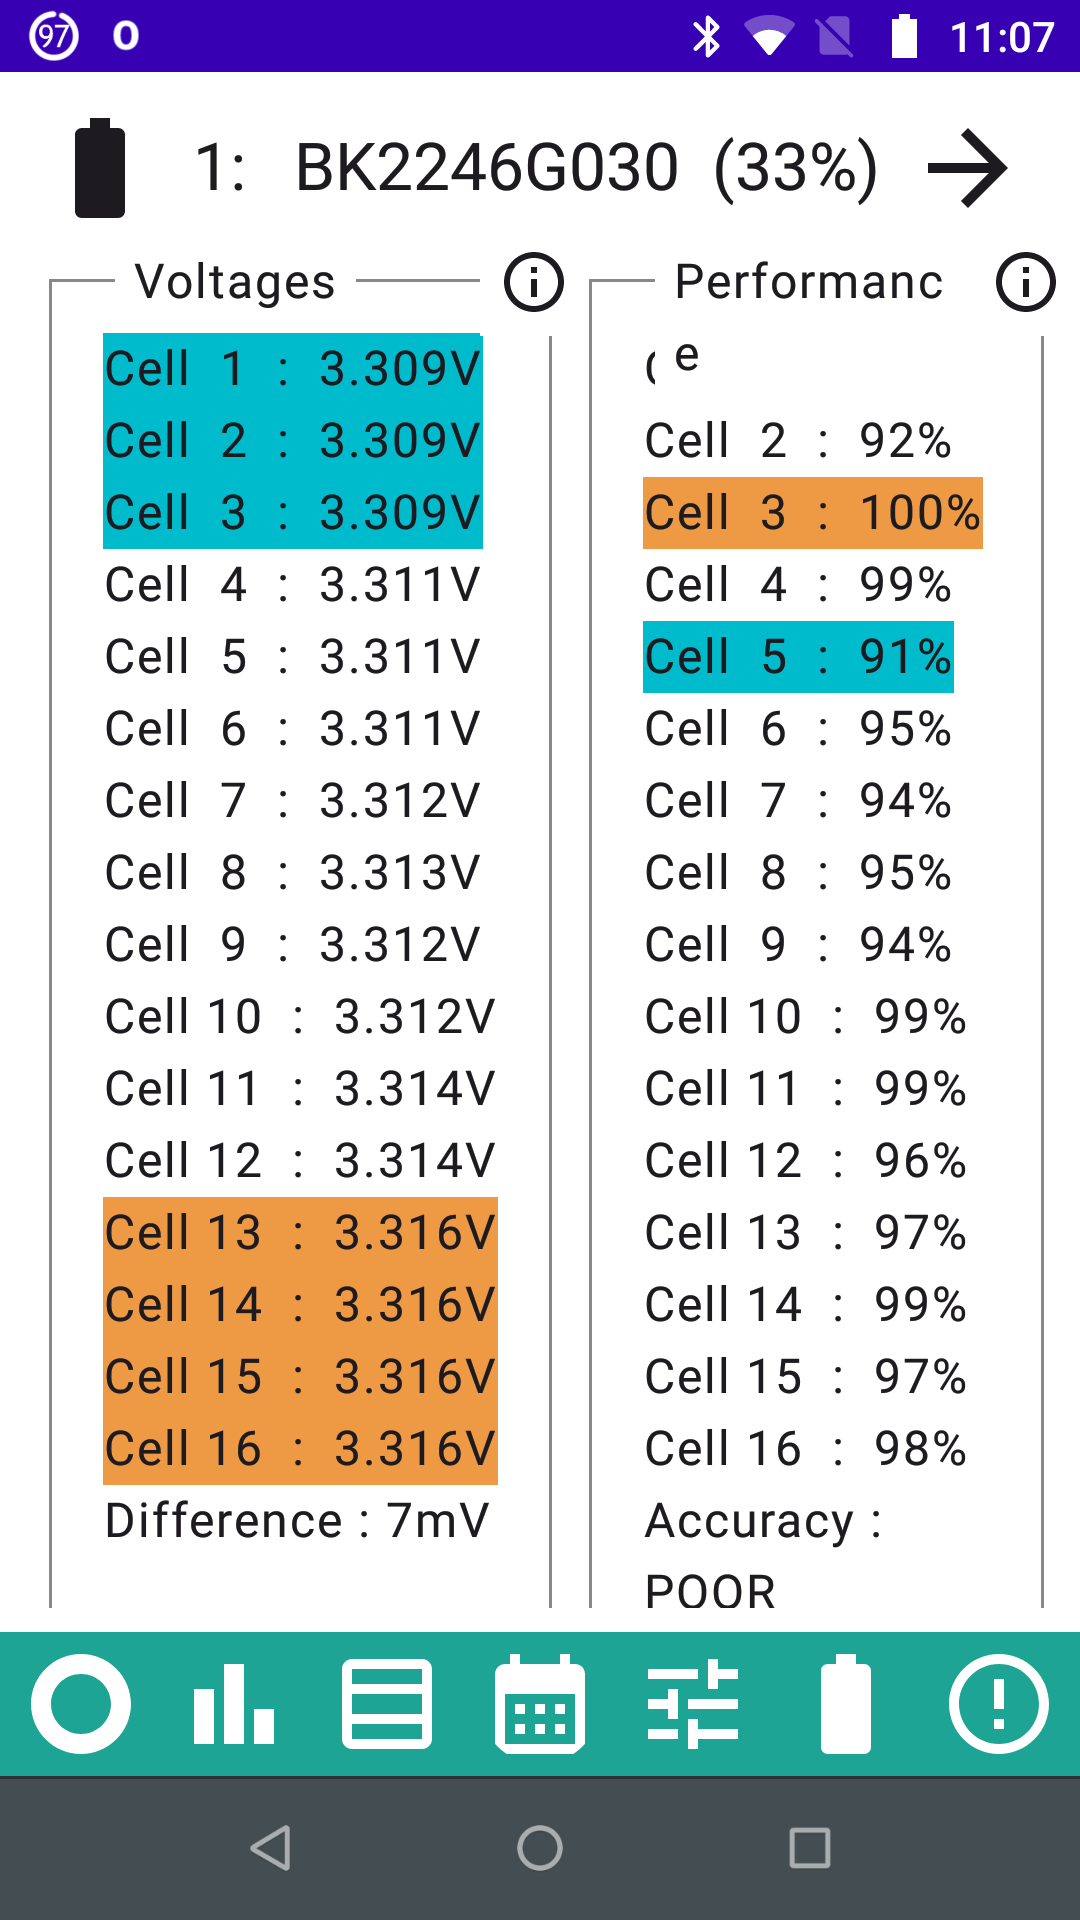
15 months old 9.5 battery:
prior to any charge/discharges, just 12 hrs capture
I'll add another this evening after a battery cycle.

R
#6 Rubikcube

wrighar No rush. Give it a few days and the accuracy will improve. Those percentages are pretty rubbish, but I think it's better to show something rather than a message saying wait 3 days to see the results.

Great that it is even working!

R
#7 Robgy

Rubikcube Great addition to your app, I'm gathering stats now. 🙂

R
#8 Robgy

My first results for the cell performance

R
#9 Robgy

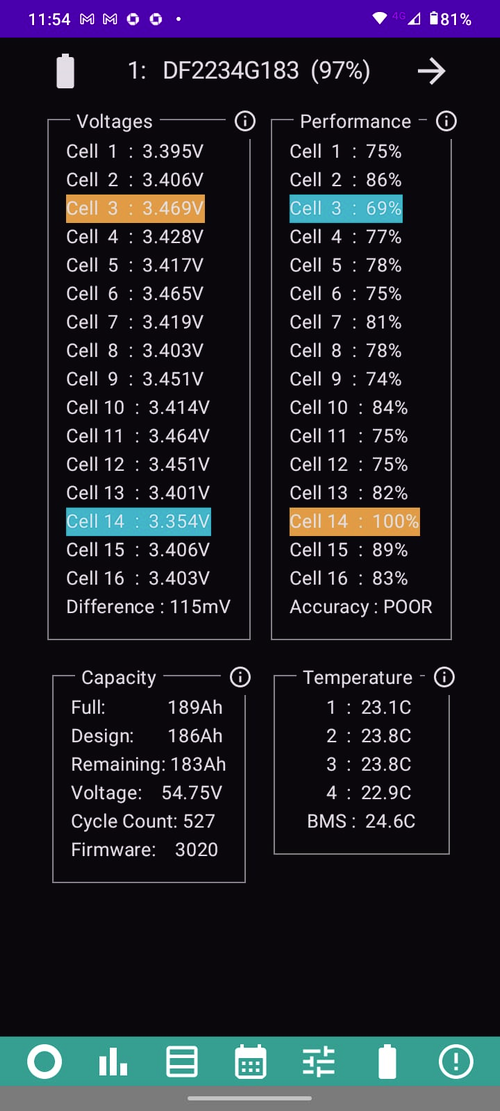
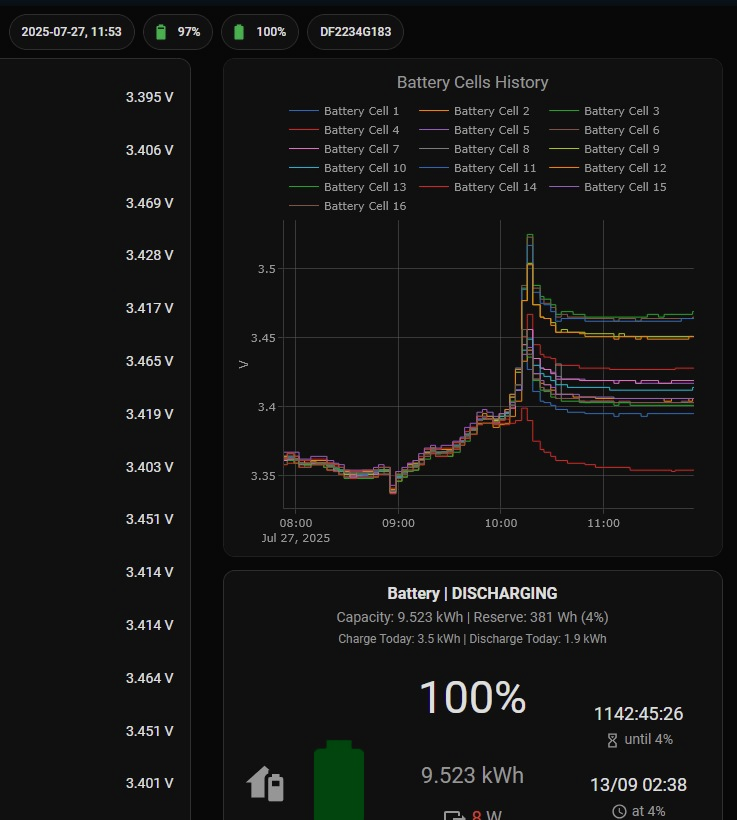
The same cells look worse to me in a graph via home assistant but I really don't know what to think.
The gap only opens when the battery is almost full or on full discharge for more than 30 mins

W
#10 wrighar

Now had one full charge/discharge cycles logge
d:

R
#11 Robgy

wrighar SNAP !!!
Yours and my cell 14 both 100%

S
#12 SimonClarke

Doesn’t seem to be working for me just saying wait until tomorrow but it’s been saying that since the beginning

S
#14 SteveCook

Hi. What is the app called please? Is it on play store?

#15 hoggy

Looks bad but suspect it's because cells are well aligned so the slightest difference swings the needle massively.
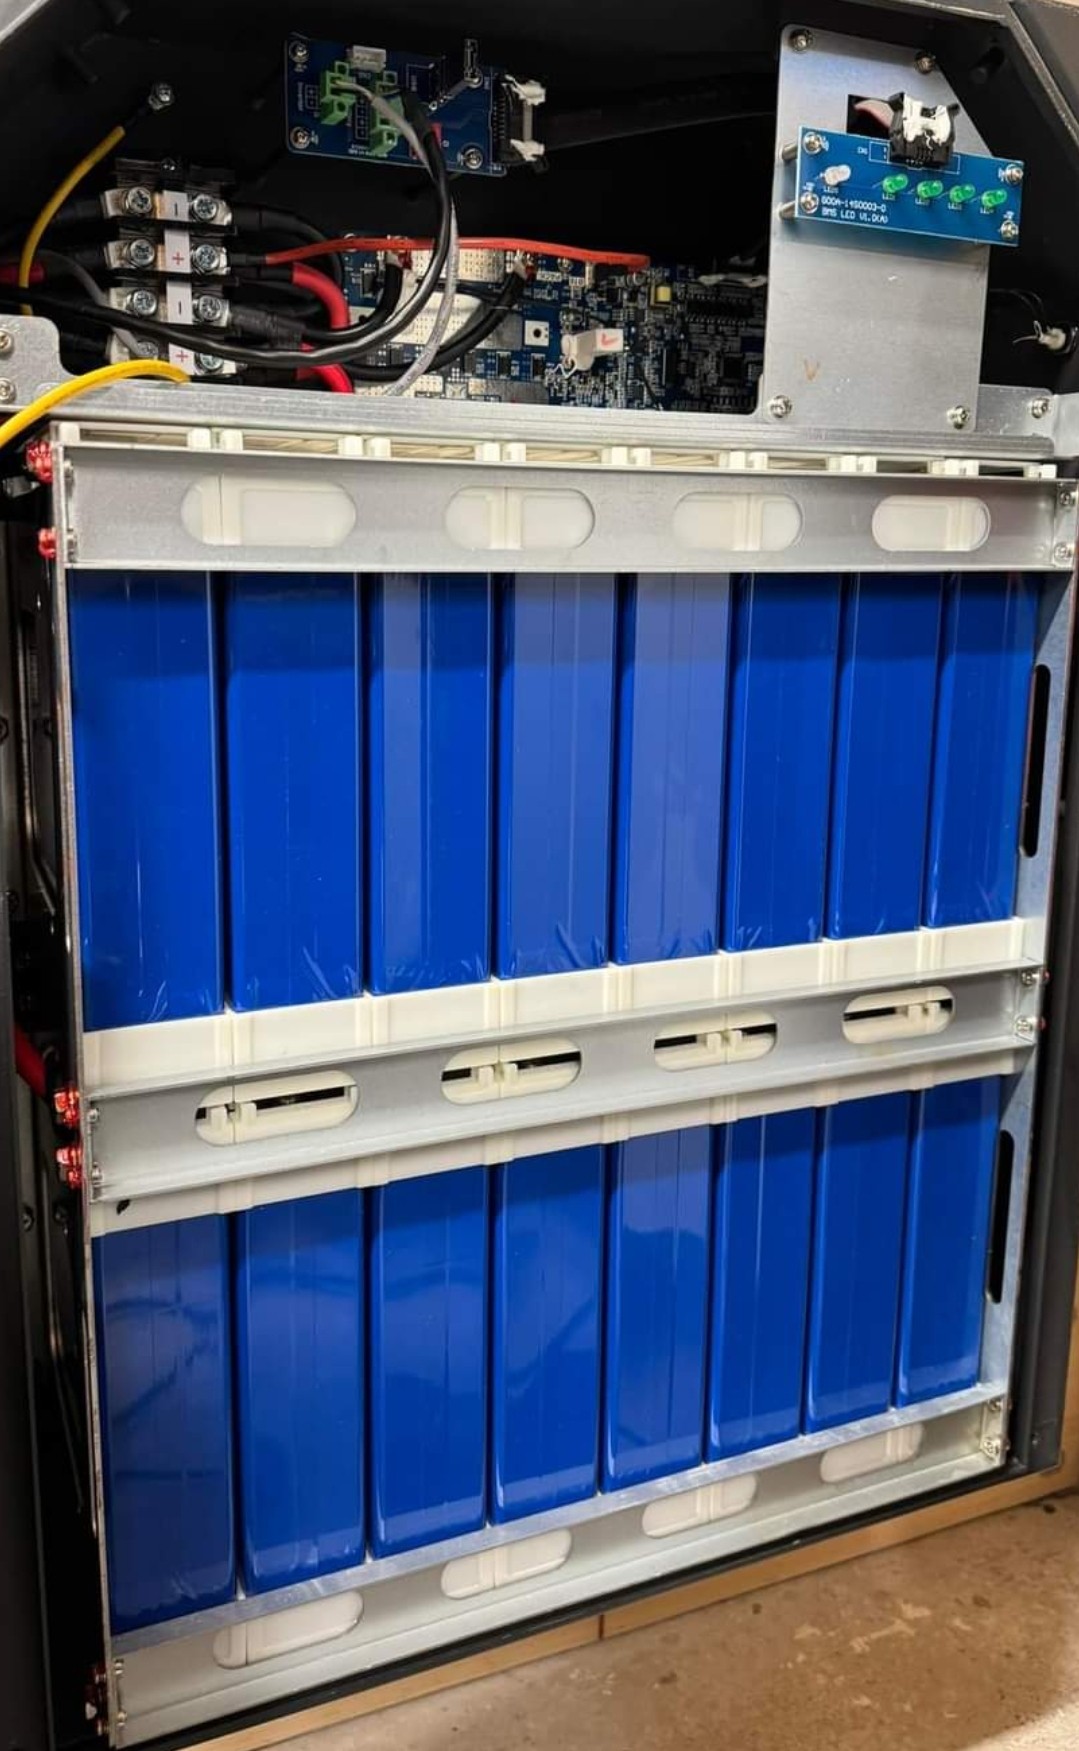
During discharge it does favour cell 8 as the worst still, but seeing as that is the start of the second bank of 8 cells in my pack that would make sense as it has the highest resistance with a wire link from bank 1 to bank 2 - all the rest are short busbar links.

2 rows of 8 cells.

M
#17 M_J

The paid version is well worth it imo as it gives you a way to set up schedules and if GE servers go down you still have control.

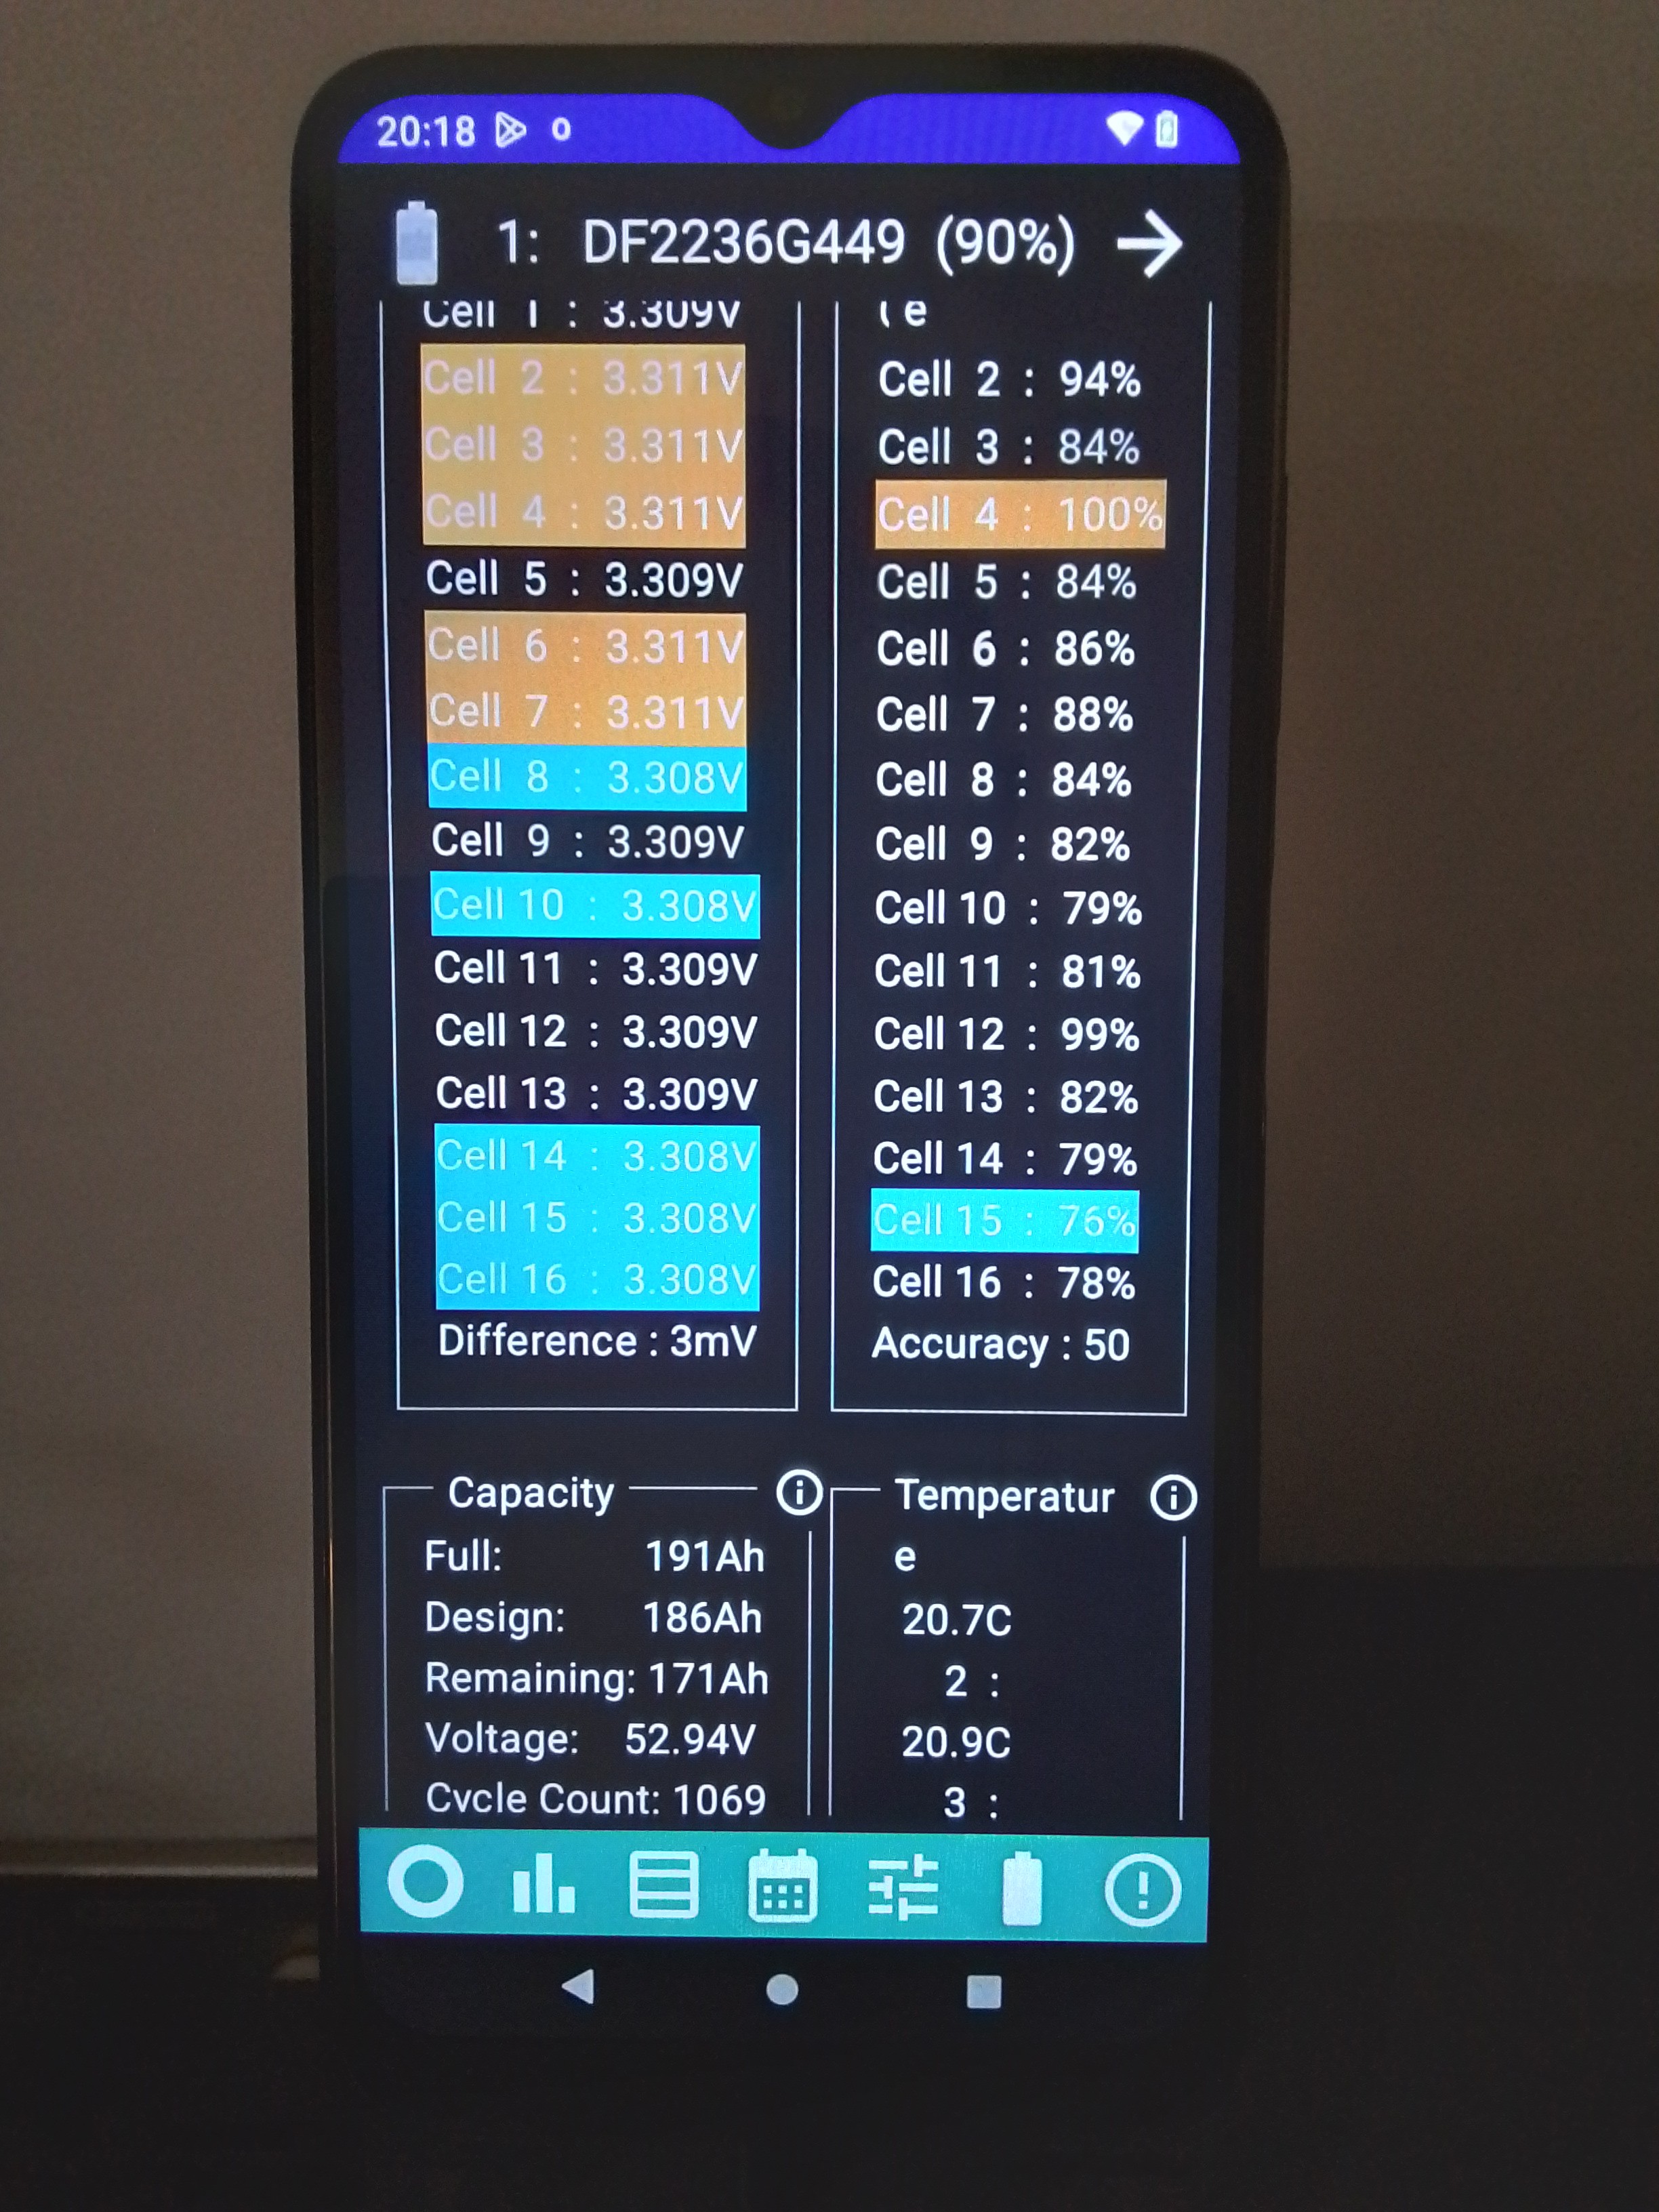
Bargain for the £...

R
#19 Rubikcube

hoggy SOH is a good suggestion, but I would be concerned it might cause confusion. Owners might expect calibration to make their battery "better" and be surprised that the SOH gets worse. Easy enough to calculate manually for the more knowledgable.

R
#20 Rubikcube

hoggy Wow, I wasn't really expecting to see percentages below 50%, let alone single figures! If you can keep it running for a few days, the percentages might look better.

You are quite correct that battery layout may impact the results. If others (with 8.2 batteries) post their results we should be able to see if this is an issue.

S
#21 SimonClarke

Mine has been running for several days but still says try tomorrow

B
#22 BobB


Great addition to your fabulous app, Rubikcube.
Here's my data from a 2.5yr old 8.2kWh battery. I'll leave it running and post again when the performance accuracy improves.
Is it my imagination, or is it the case that the low voltage cells are usually from the 1-8 bank and most high voltages are from the 9-16 bank? Why would that be? I appreciate your note in the app about measurement accuracy of +/-5mV, but I would expect measurement accuracy to skew numbers both sides of the mean.

R
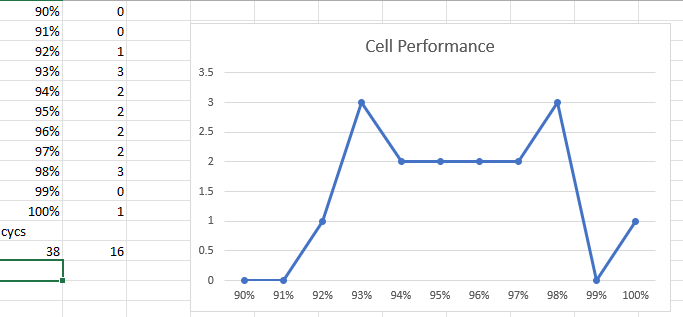
#23 Rubikcube

SimonClarke Thank you for reporting that you are having a problem. You should definitely have some results to see after 48 hours. There are almost certainly bugs in my programming.

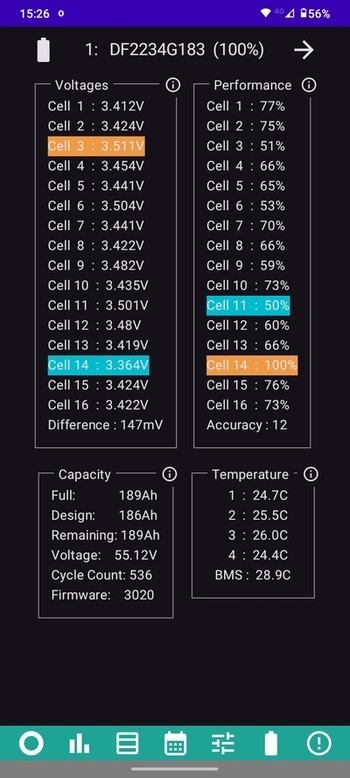
The fact that you are seeing the try again tomorrow message means that you have the right version of the app.

Can you think of anything that might be different about your setup? Is your android device running continuously and plugged into a charger?

S
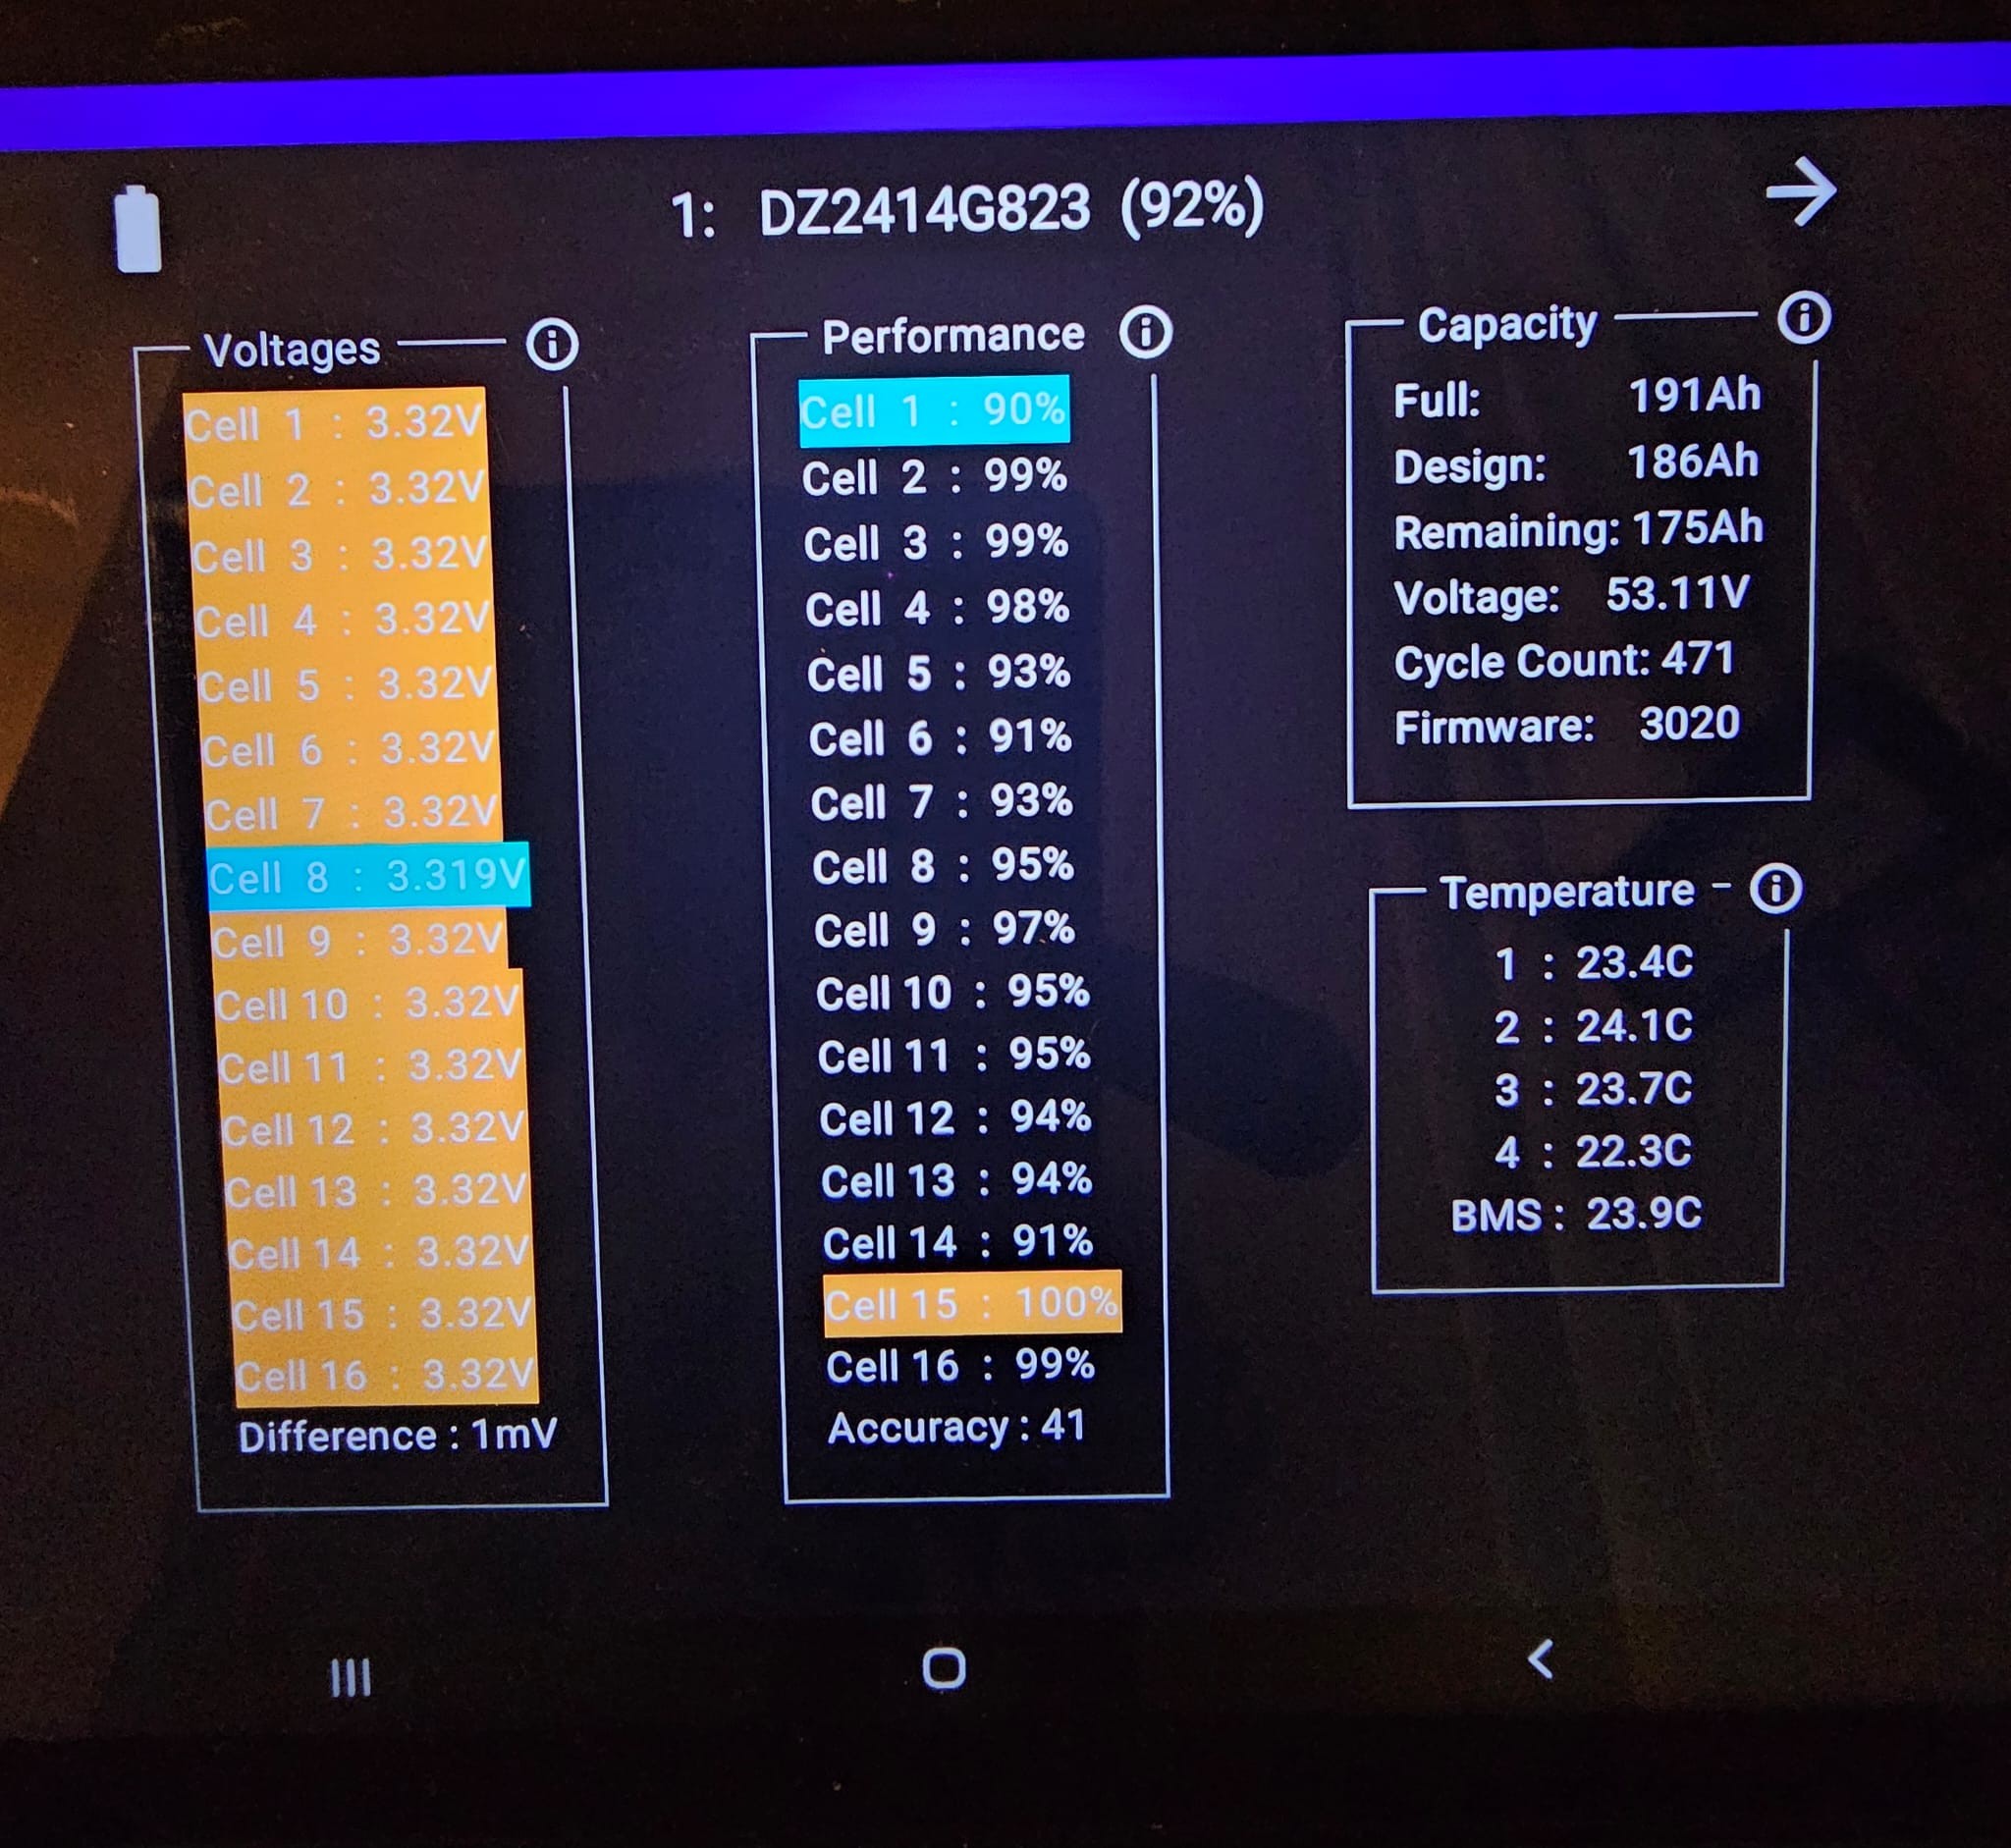
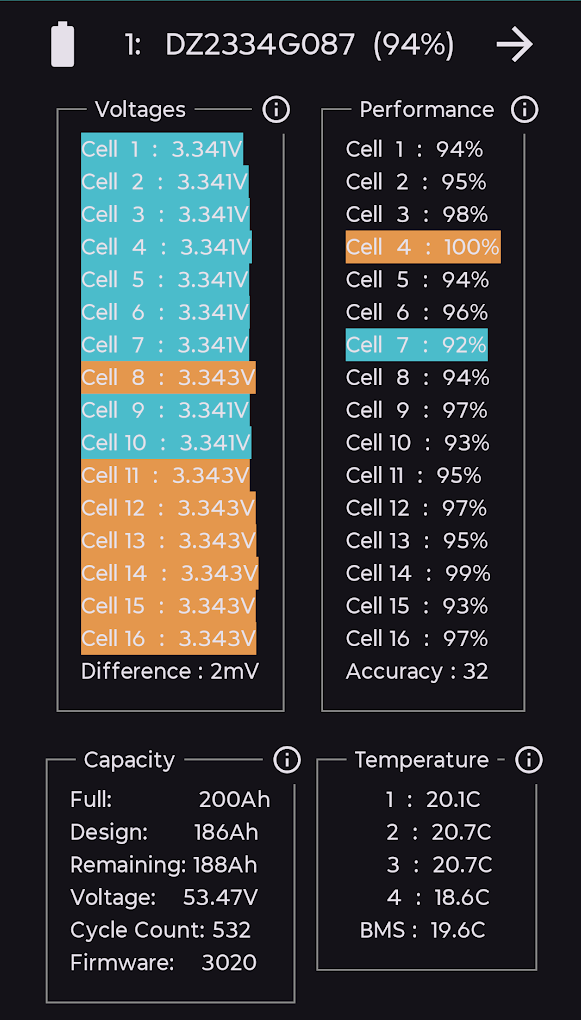
#24 SimonClarke

Rubikcube its a Redmi Note 13 Pro 5g fully up to date, not plugged in and I’m not sure what you mean re running continuously? It’s my phone and I don’t turn it off normally. I just tried to post a picture but once again it failed to upload.

#25 Windy Miller

Here are my 2 5.2kWh batteries...

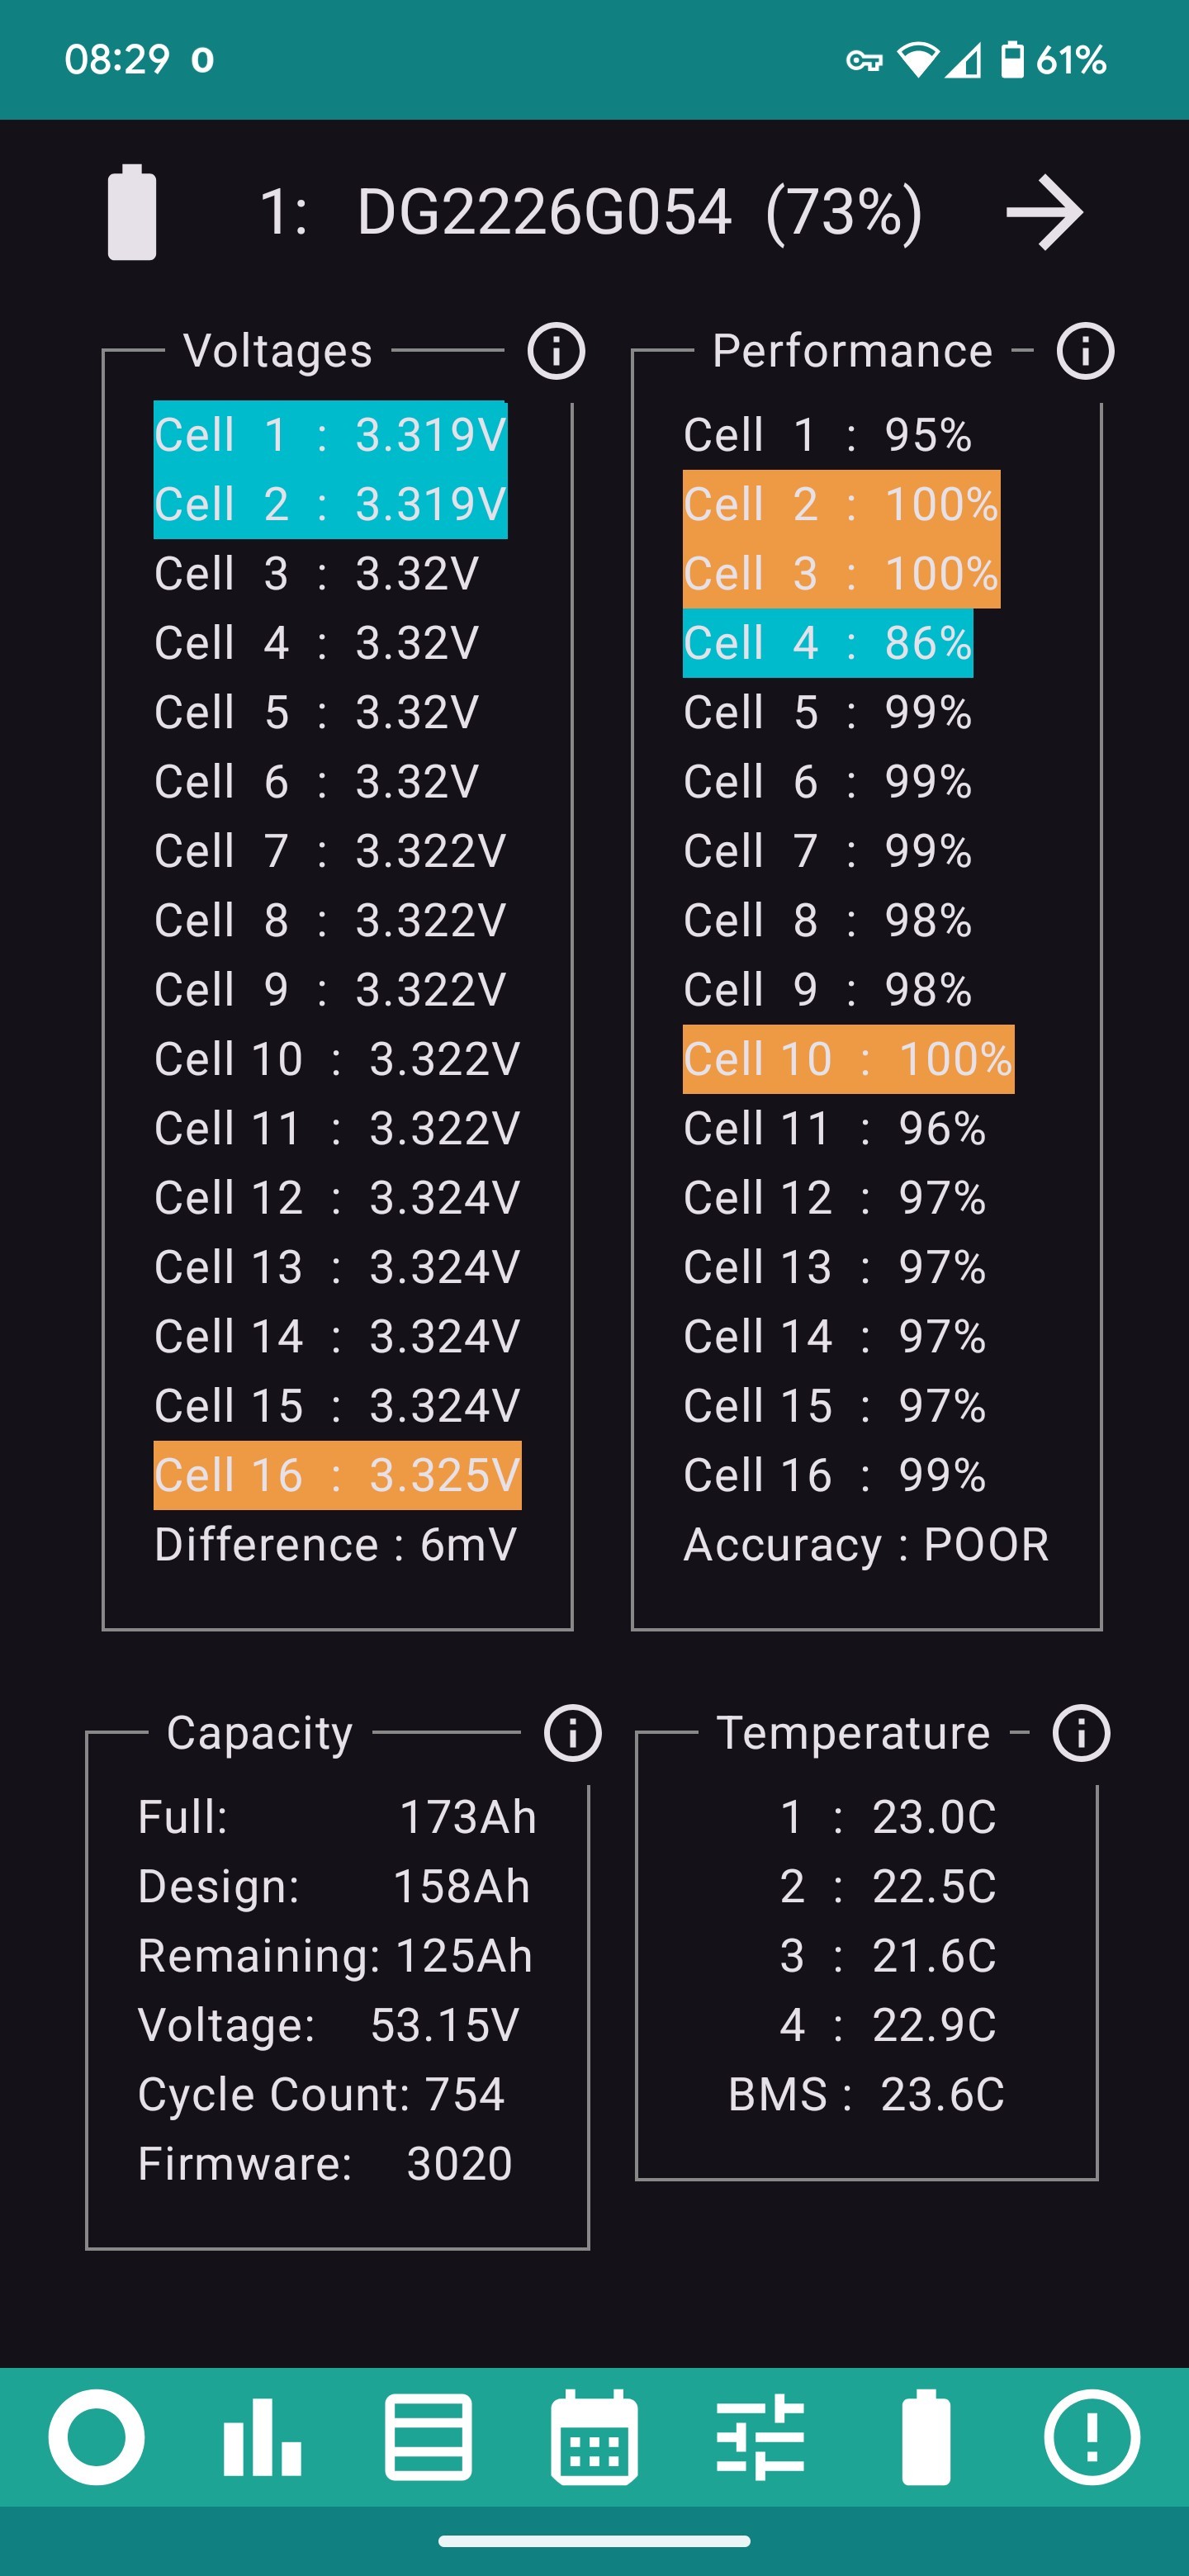
First battery is a picture of health

Second battery not so good

Still early days.

PS Slightly smaller text size might fit the screen better.

W
#26 wrighar

Still collecting, a couple of recorded cycles now, but missed 2 discharges as I was at work.

S
#27 SteveCook

Hi. I cannot see any info about my cells. Am i missing something?
Have I downloaded the wrong Android Inverter Monitor app?

#28 Windy Miller

SteveCook Tap the battery bar at the bottom of that screen. Make sure collect stats is on in the settings.

M
#29 M_J

[unknown]

Yep this I found after a while of using the App...

Not obvious but once you know it's there something I check frequently...

S
#30 SteveCook

[unknown]
Doh! Thankyou very much

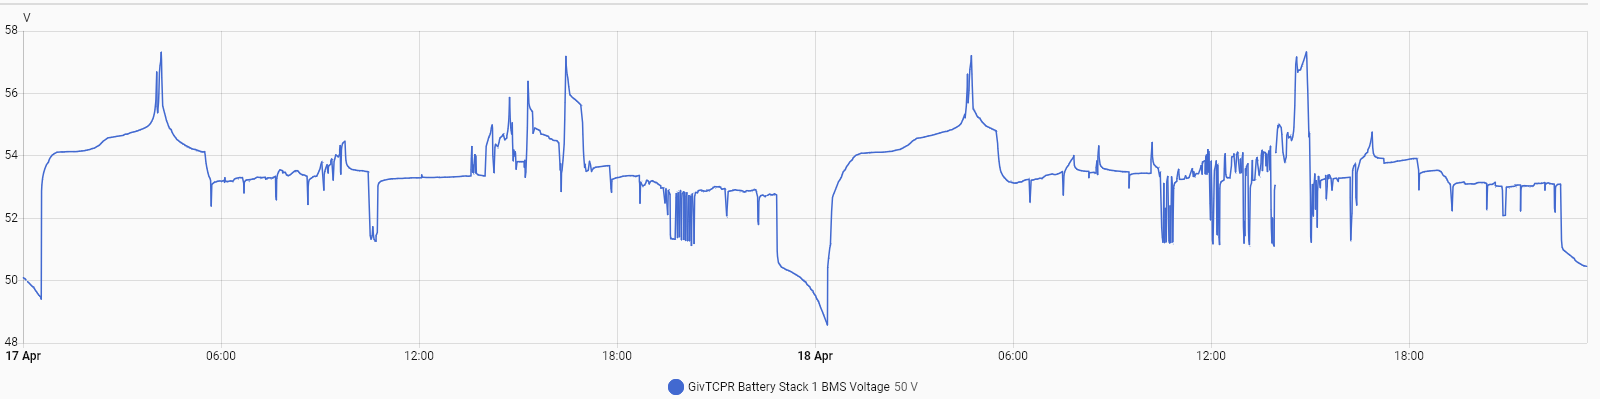
#31 hoggy

@Rubikcube I'm aiming for 0%. What do I win?
The pack is well used but it's not shot, it does 5.8kWh down from 6.5kWh from new. I'll send you a few csv of the cell voltages over time to debug.
Intriguingly I've noticed my Full capacity AH has increased since my last post even without running a calibration of any sort, wasn't aware it did that but learn something new.

R
#33 Rubikcube

Windy Miller You can adjust the text size in the android settings. This affects all apps not just mine, but if you have a small phone it may make everything better. Settings / Display & touch /Display size and text / Font size (for Android 16).

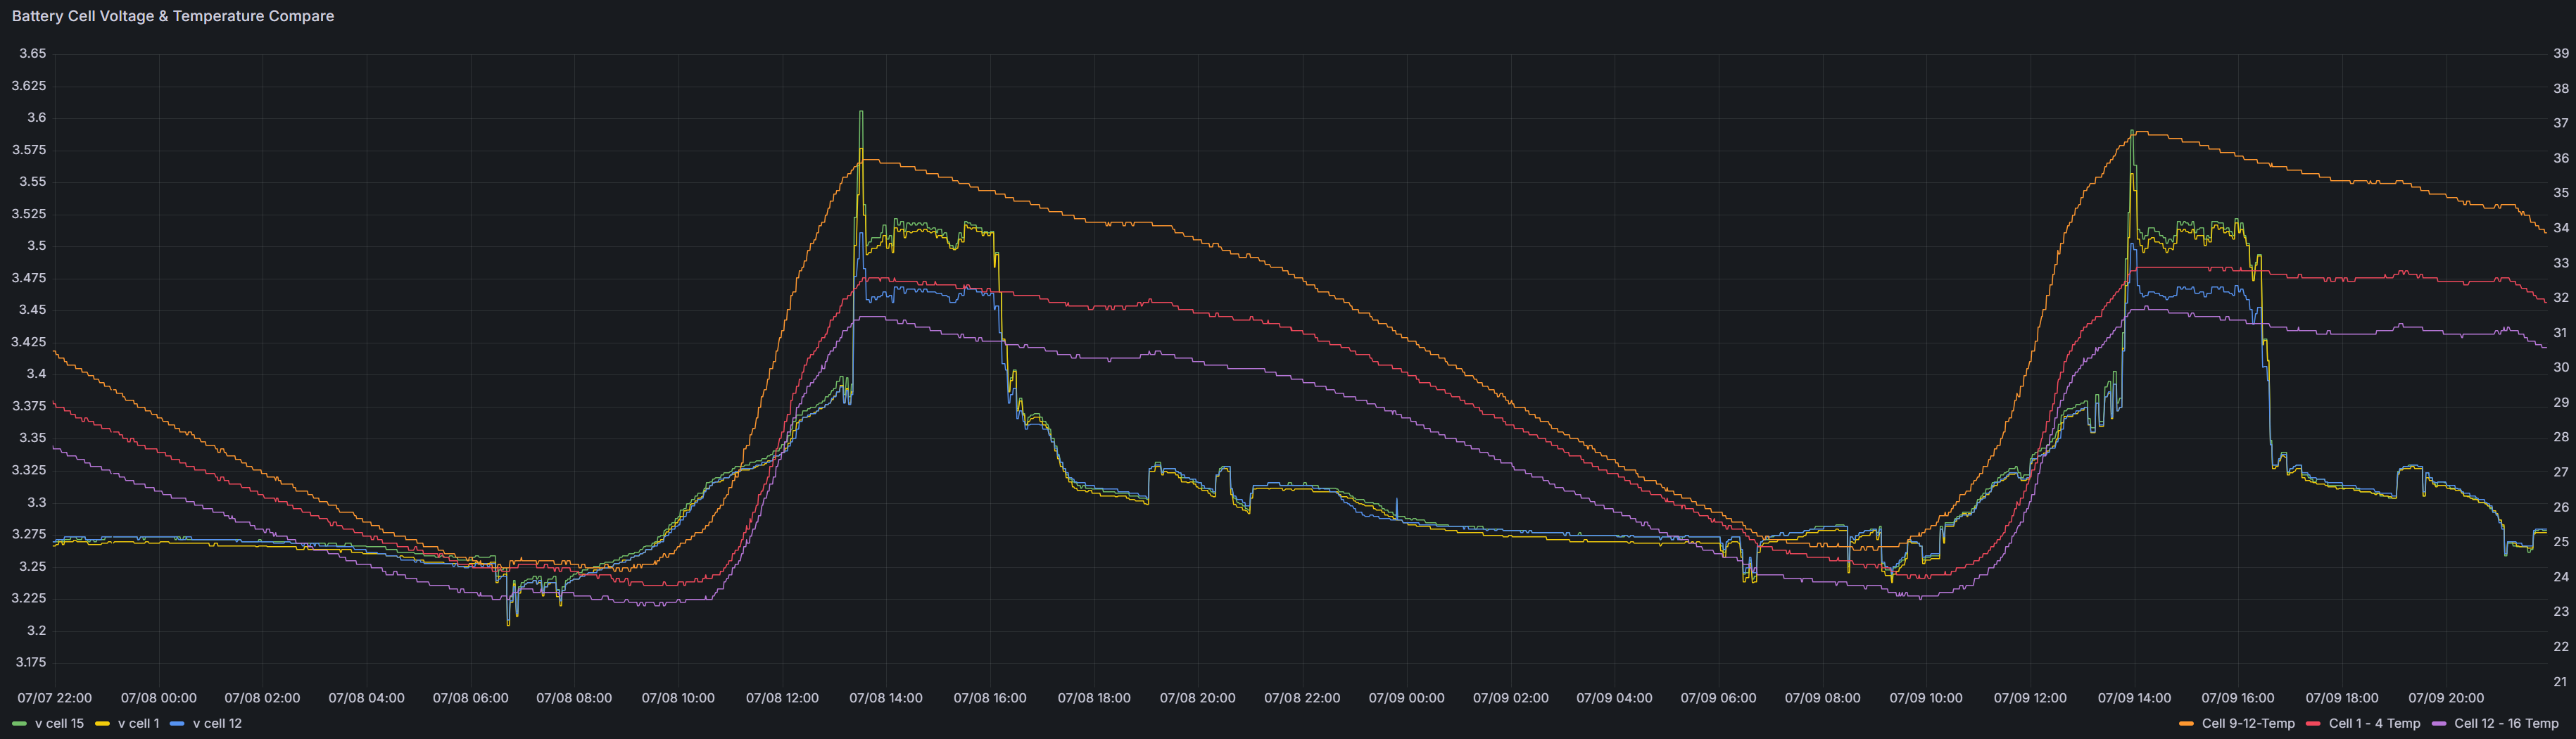
Interesting results for two batteries the same age.

R
#34 Rubikcube

hoggy Typical ! I just wrote the help text that says the Full capacity only changes with a recalibration and apparently that may not be true. Very odd that your full capacity changed itself from 134Ah to 135Ah. I wonder if it's a rounding thing; the BMS stores 2 decimal places, and my app just integer divides by 100. You should be able to see the actual value with the decimal places in GivTCP.

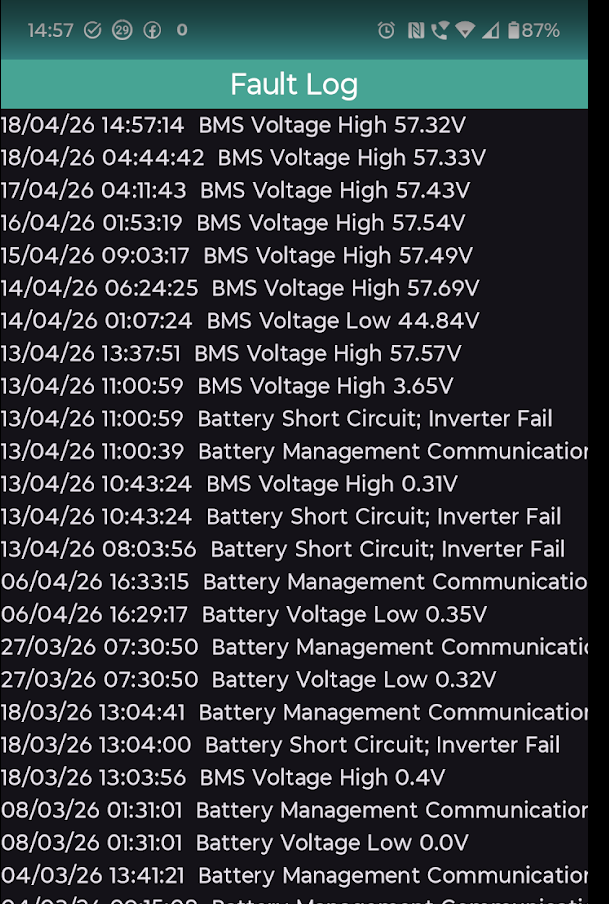
In the fault log (circle with ! icon bottom right) are there any BMS Voltage errors, or any faults of interest?

S
#35 SimonClarke

Rubikcube working now! Still can’t post a picture. At 99% charge it shows voltages ranging from 3.34 to 3.364 difference 24mv and 47 - 100% performance accuracy poor. If I am understanding correctly that’s ok?

#36 Windy Miller

Rubikcube Thanks for your reply. I've always suspected the 2nd battery is degrading faster than the first. The capacity of the 2nd is 86Ah compared to 96Ah for the 1st. As the batteries are kept in step more or less my total capacity is paced by the 2nd battery. Once your app has reached good accuracy I might contact GE to see if anything can be done (other than continually trying re-calibration).

R
#37 Rubikcube

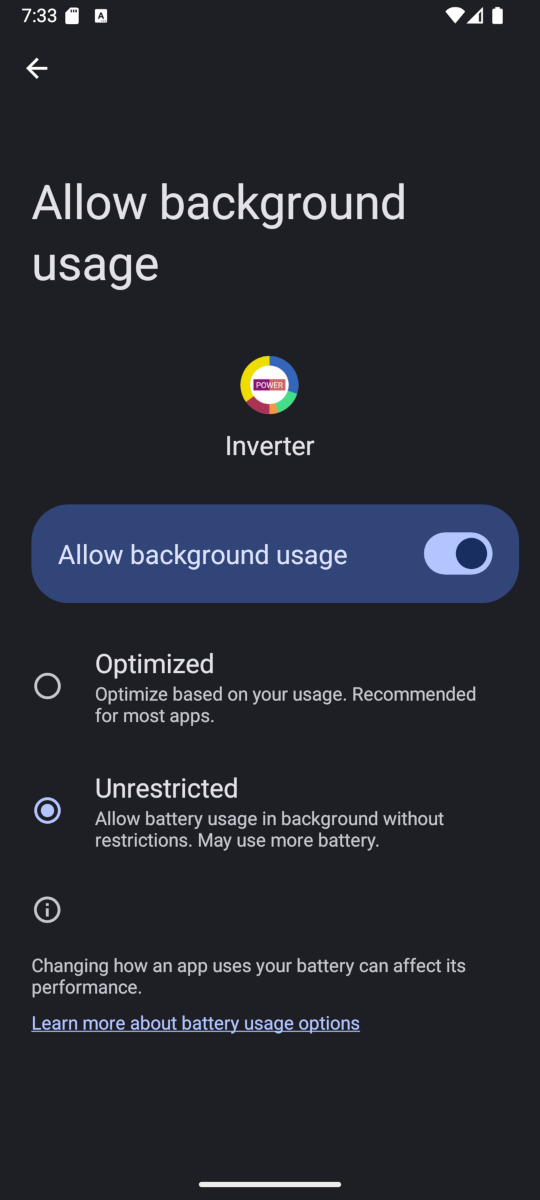
SimonClarke Great that you have it working. If you run on battery, the android operating system will stop background processes after a while to conserve battery power. This is the default behaviour, but you can change it in settings. To check in my app, in settings press the question mark next to collect stats, and if the help dialogue says Background usage is RESTRICTED, then you need to change the setting. In the android settings, it's a screen like this ...

A
#38 alan_johnston

I have the app running 24/7 as an IHD. Will see if I can get the battery thing going.
I notice that it it requries peristant mode - will this potentially block commands from WonderWatt?

R
#39 Rubikcube

alan_johnston Persistent mode works fine with Wonder Watt, GivTCP, the portal and the GE app. Persistent mode is now recommended. Nobody has reported any issues with it in the latest versions.

R
#40 Robgy

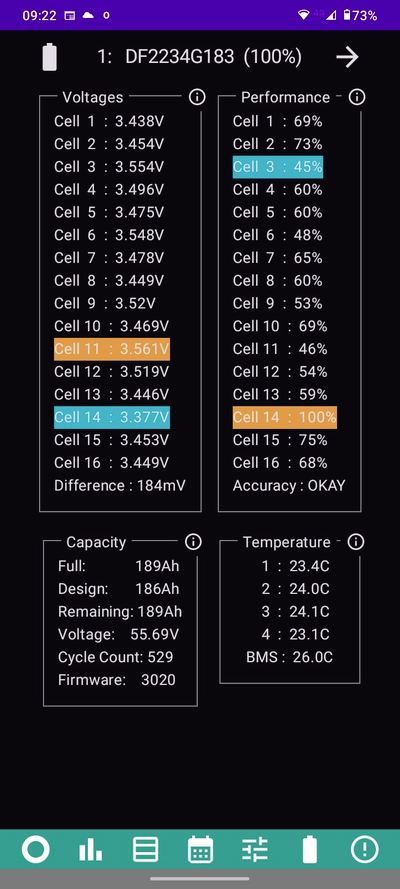
Performance Accuracy Okay for me now, is that good or bad?
Capacity looks good I think but the performance % is all over the place and the cell difference of 184mV is that OK?

I wish I understood a little more what the results really mean

A
#41 alan_johnston

Have fired up collect stats and persistent mode. Will report back tomorrow.

#42 hoggy

Rubikcube Ah I can see I had a spontaneous crash to the battery LV trigger point Sunday night (must have missed that) - that will be why Full capacity changed as although the inverter didn't actual do a calibration (nor was it a spurious one from the modbus side of things) all the BMS knows is that it was sent down to the LV alarm and then charged up (eventually) over the next day - hence the new found capacity in AH.
So yes I think you are safe with your comment that the capacity shouldn't change unless a calibration is run.

Also, if it helps your cause, heres some traces of cell voltages vs SOC from my pack: https://terravolt.co.uk/Downloads/Misc/history.csv

S
#43 SteveCook

Thanks for the app. Working exactly as shown.
How do I now stop my paranoia as I have two cells on 1%, one on 100% and Accuracy😛oor.
Is there anything I should be worried about?
Should I be reporting this to Givenergy now (9.5 installed 2.5 years ago)
Should I run a calibration or let the app run a few more days?
Thanks for advice

R
#44 Robgy

[unknown] my accuracy changed from poor to okay after 3 days so I would hang on for that.
As for what it all really means I really don't know if it's good bad or just something else to look at and ponder!

#46 hoggy

I think until the author has had chance to review the feedback & tweak the algorithm then its just a Number. Its not meaningless but equally Givenergy are already struggling with support so I doubt they'd be ecstatic about what are potentially 'nothing' tickets adding to their already overflowing pot.

As you've seen mine has a lot of cells that are apparently at deaths door at 2% but the pack is running no different to how it always has (with degradation incurred anyway) so I'd not panic just yet - I think a lot more in the wild data is needed.

(Remeber Giv have been playing whack a mole for years with SOC accuracy, all from similar voltage data so I don't doubt that this is going to take a lot of samples to make sense of what it's telling you)

S
#47 SimonClarke

Gave up trying on my phone and put it on an old Alcatel pad running android 6. Seems ok. As usual can’t upload a picture. Currently showing 100% and idle but on the battery page it says 97% with design 186, full 179 and remaining 173ah. This is what it always says. Voltages 3.548 to 3.361 difference 187mv which is more than usual. Performance 60-100% accuracy poor.

#48 Windy Miller

My 2 batteries each with 16 cells show close balance in the middle of the SOC range (generally within 10mV) but drift apart at the 4% and 100% SOC points. This, I believe, is to be expected as at these extremes the differences between the individual cells become apparent. One cell will always lead the way (reaching full charge early) with another lagging behind (still with some capacity) which is why the cell voltages separate at the extremes. The voltages in the middle of the range show how well the inverter cell balancing is working and at the extremes highlights the strongest and weakest cells. Hopefully, given time and many samples, which are the weakest cells will become apparent with a possible indication of whether it is worth swapping out a poor cell. Of course none of us would do this in the warranty period :-)

R
#49 Robgy

So I don't need to print a battery return label just yet! ,😂

#50 hoggy

Im not sure how far the rabbit hole Rubicube has gone but the chip in the BMS is a Lapis ML5238 so ideally all the accuracy values of its measurement capabilities needs to be factored in.

S
#51 SteveCook

All my cells are now orange and all exactly the same at 3.274v, yet 2 cells at 1%, and one at 100% with Accuracy = Poor

M
#52 M_J

[unknown]

Let it run a week...

R
#54 Rubikcube

hoggy Thank you for the trace from GivTCP. I have copied it to a csv file, so you can take it down from Terravolt if you want. It has given me some useful insights. You can see the infamous "drop to zero" in the trace

sensor.battery_charge,14,2025-07-27T17:38:51.028Z
sensor.battery_charge,0,2025-07-27T17:41:32.044Z
sensor.battery_charge,1,2025-07-27T17:49:38.051Z
sensor.battery_charge,3,2025-07-27T17:52:21.027Z

The fault log in my app should pick these up reliably (and so should GivTCP). The portal can miss them (because of the 5 minute interval), and anyway the BMS high voltage faults have been suppressed in the portal.

R
#55 Rubikcube

Thank you to everyone that posted (or described) their results so far. The reliability of this forum is infuriating. There is no need for anyone to panic or contact GE. If you have results, it means your battery is working!

The variation in results surprised me, but there are many reasons. We use our batteries differently, I'm on Octopus Go, so mine has a fairly fixed daily cycle of charging/discharging. Those on Agile (with Predbat) will have a more dynamic cycle. GivTCP can affect the results; my app doesn't request the cell voltages for this function, it captures the "echo" of the portal transmission, but this can be affected by GivTCP because that does request cell voltages and in the process generates another "echo". And all our batteries are different ages. And we know that GE built batteries at different times using cells from different manufacturers.

This is just a first attempt. All the results are valid and are picking out the best and worse cells. The thing to look for is an OUTLIER. If there is just one cell way different from the others. Only @"Robgy" seems to have an outlier in that cell 14 is working exceptionally well. I don't think this is a problem, but I'm no expert here either.

This is breaking new ground. If we are really honest, nobody (not even the manufacturers) knows how these batteries perform over time outside the lab. Nobody else seems to be doing this sort of analysis, so nobody knows what the results really mean.

R
#56 Rubikcube

SteveCook Should I run a calibration or let the app run a few more days?

You should definitely let the app run for longer if you can. Check the fault log in my app for BMS voltage faults. An odd one isn't a big deal but when you are seeing BMS voltage faults, it's time to calibrate which should make them go away.

R
#57 Roberto

Did a calibration on my pair of 9.5s yesterday, so will now monitor to see what happens.

I guess the exam question with this app and the data it provides is " so what?". Its great to monitor stuff but at what point do we call Giv and talk about our 10 year warrenty and the need to make a claim.
This is a great app i have been using, and paid for now for a couple of years. I do wonder if Giv have something themselves that they use to monitor each of our batteries performance ( i hope so).

R
#58 Roberto

Did a calibration on my pair of 9.5s yesterday, so will now monitor to see what happens.

I guess the exam question with this app and the data it provides is " so what?". Its great to monitor stuff but at what point do we call Giv and talk about our 10 year warrenty and the need to make a claim.
This is a great app i have been using, and paid for now for a couple of years. I do wonder if Giv have something themselves that they use to monitor each of our batteries performance ( i hope so).

A
#59 alan_johnston

Mine is still collecting stats. Will see what the results are next week after a few days.

M
#60 M_J

[unknown] Its great to monitor stuff but at what point do we call Giv and talk about our 10 year warrenty and the need to make a claim.

When your batteries fail and I wouldn't hold out too much hope on the warranty claim process.

I see this more as an educational process than a way to make a warranty claim. We are at the bleeding edge of home battery tech so expect mistakes and lessons to be learnt.

That's just my 2p on the value of this reporting tool. It helps educate...

M
#61 M_J

OK finally got time on my PC and here are the readings from my two batteries. Android 8 has a poor way of taking screen shots so it was a paff trying to take a print. I will switch my main monitoring device to an old tablet soon.

Can't seem to get image to upload, so links I hope will work?

The oldest battery might be showing more wear...

https://photos.app.goo.gl/MJutFMGE1XqCq45N7

https://photos.app.goo.gl/okXs1ZVR4f4npadM9

#62 Windy Miller

M_J Are your two batteries the same age and do they show the same full capacity? Are they daisy-chained or on separate inverters? Trying to compare to mine that are daisy-chained on one inverter (AC3.0). One of my batteries is 94% of design capacity, the other is 84% yet they are both the same age (year 22 week 46).

M
#63 M_J

[unknown]

Hi Daisy chained. AC3 The smaller 2.6 is a new addition built in 2022 week 48.

Nov 23 installed roughly a year after my original 5.2 was installed in 2022.

I have over voltage issues when the sun tops up the battery and I guess I could do with another re calibration, but I was holding off on that to tie in with the software update. I have held off on the update after I saw @[deleted] mention getting his battery dropped back a version as it was degrading fast.

I have mitigated the OV overnight by only charging to 90% but that doesn't apply if you set battery in eco mode during the day with solar topping it up.

Just got a home assistant box but not had time to get PredBat set up. Too much travel abroad and other jobs to do...

R
#64 Rubikcube

M_J Thanks for posting your results. I think it is normal that the percentages will spread out with age, so everything looks as I would expect.

A calibration usually makes over voltage errors go away. [That is just a statement, the decision to calibrate or not is up to you].

W
#65 wrighar

Rolled enough data/cycles to move to Good accuracy now:

Cell 14 (like some other peoples) is antisocially happy at 100%.

Wondering what my %ages would be if an high outlier was normalised to the 2nd highest.
@Rubikcube Any chance of having an option to exclude the highest %age cell?

T
#66 TimHutchings

Here's mine - new in Nov 22. Now getting a Good reading!

T
#67 TimHutchings

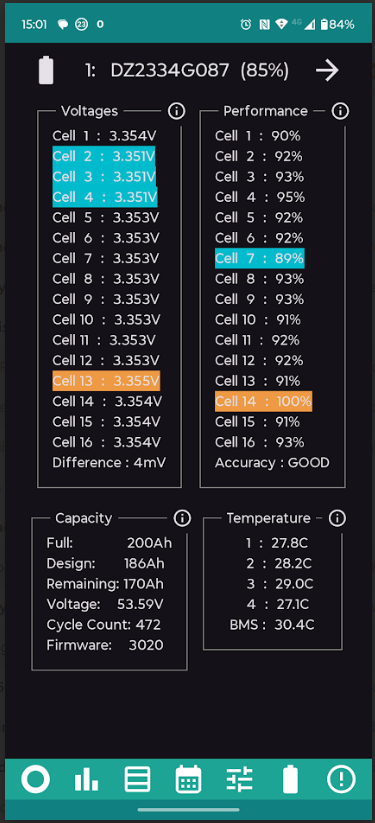
Here's mine - new in Nov 22. Now getting a Good reading! Been on Good for a couple of days. Cell 4 seems pretty solid, but 14 and 15 are a bit weaker than the others.

I did a normal recalibration 3 months ago after moving to 3020, and my full capacity reading of 195Ah dropped to 187Ah. A few weeks later I did another recalibration at around 350 watts (overnight and followed by clear blue skys fortunately), and got the full capacity back to 191Ahs. Allowed me to get in a further 4Ah daily using IOG overnight.

At the other end, the battery stops discharging these days at 5% - never get to the 4% anymore, unless it's stopped discharging for around a half hour, then it ticks down to 4%.

T
#68 TimHutchings

Here's the other end of the scale!

T
#69 TimHutchings

Here's the other end of the scale!

W
#70 wrighar

Another day and cell 7 is better at 90% now
Mostly and 90-94% spread with 1 96% then cell14 at 100%

R
#71 Rubikcube

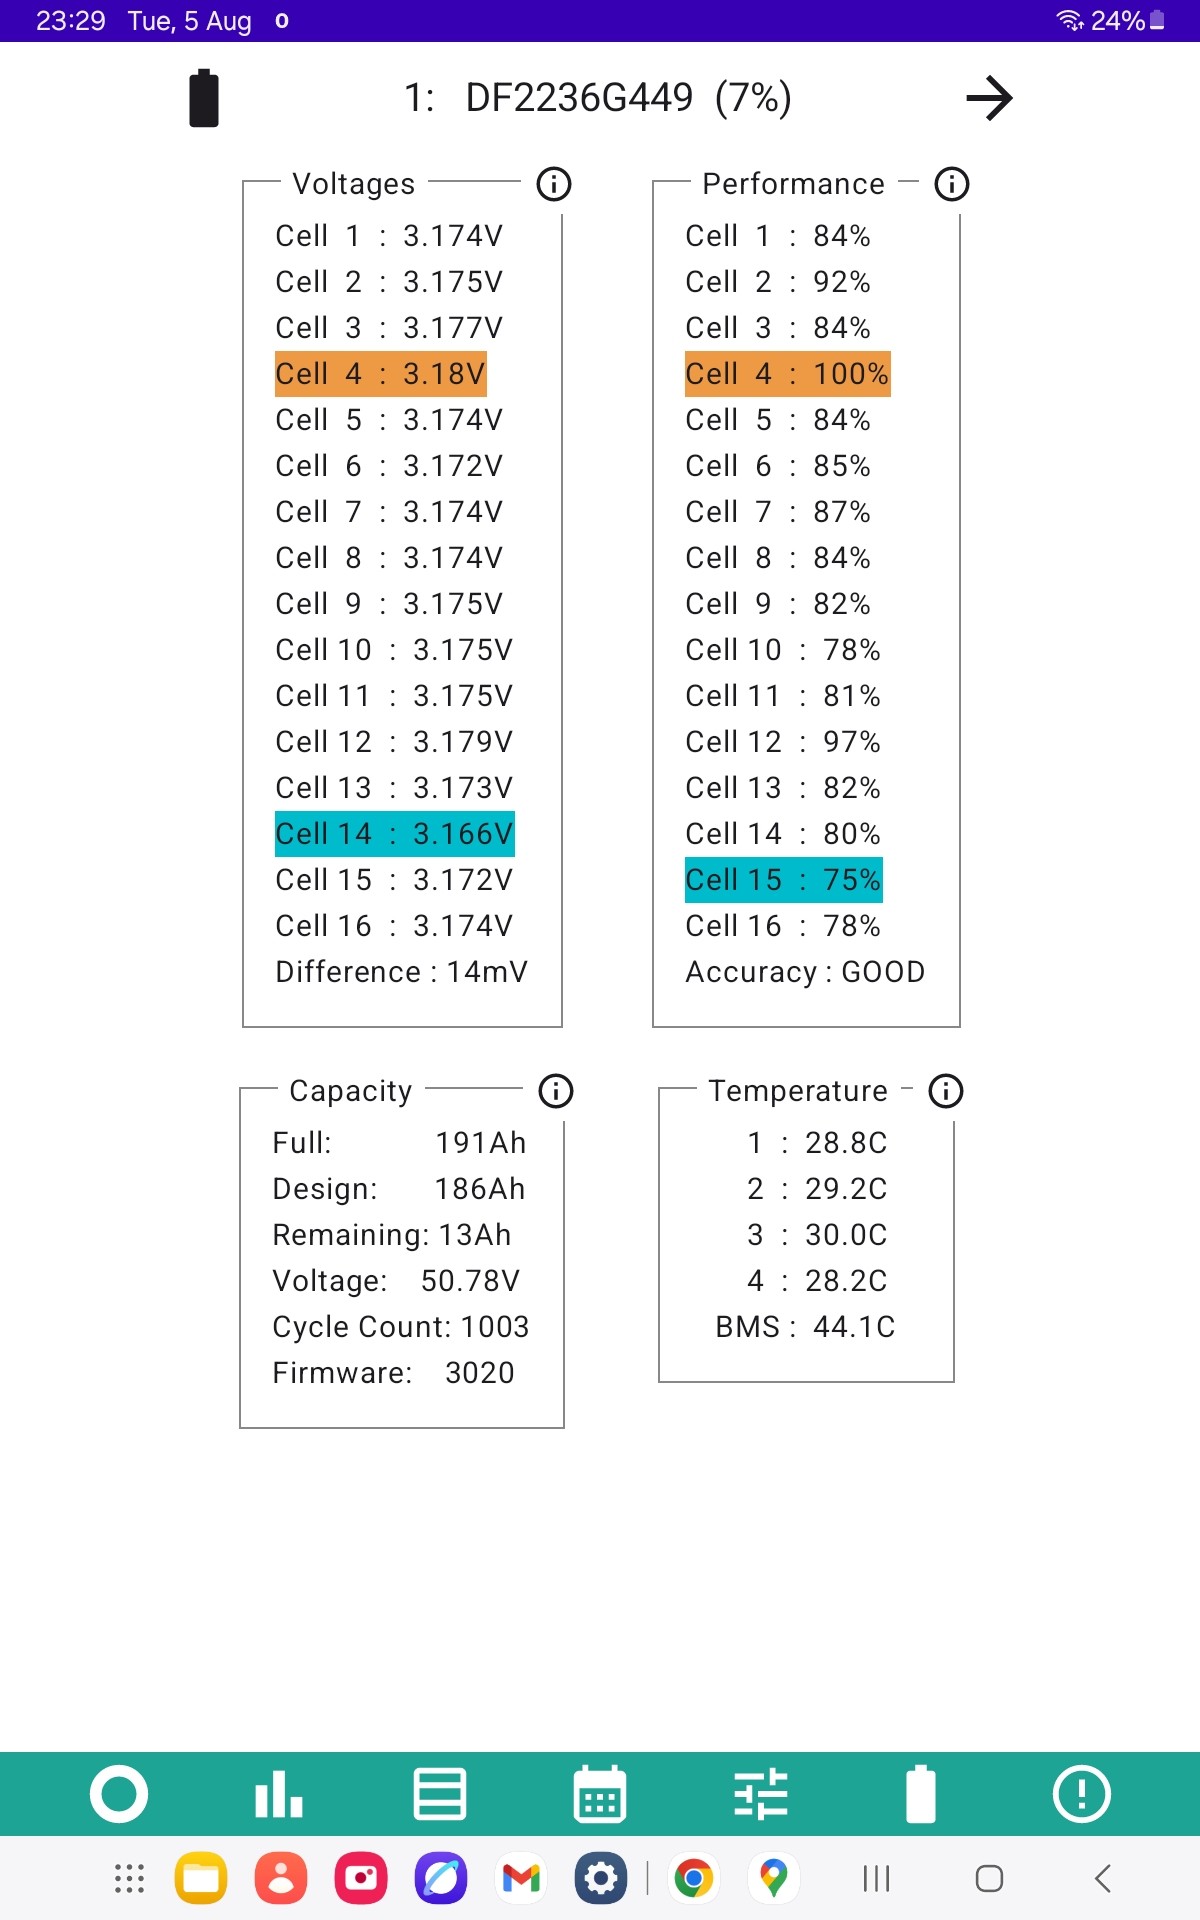
Interesting see to some GOOD results. I would expect the percentages to "tighten up" a bit with more data, that's just what happens mathematically when averaging removes the randomness. It takes about a week of data to reach "GOOD" and I would expect little change with more data once GOOD is reached. Further changes will occur over months and years.

An update on the results from my battery.

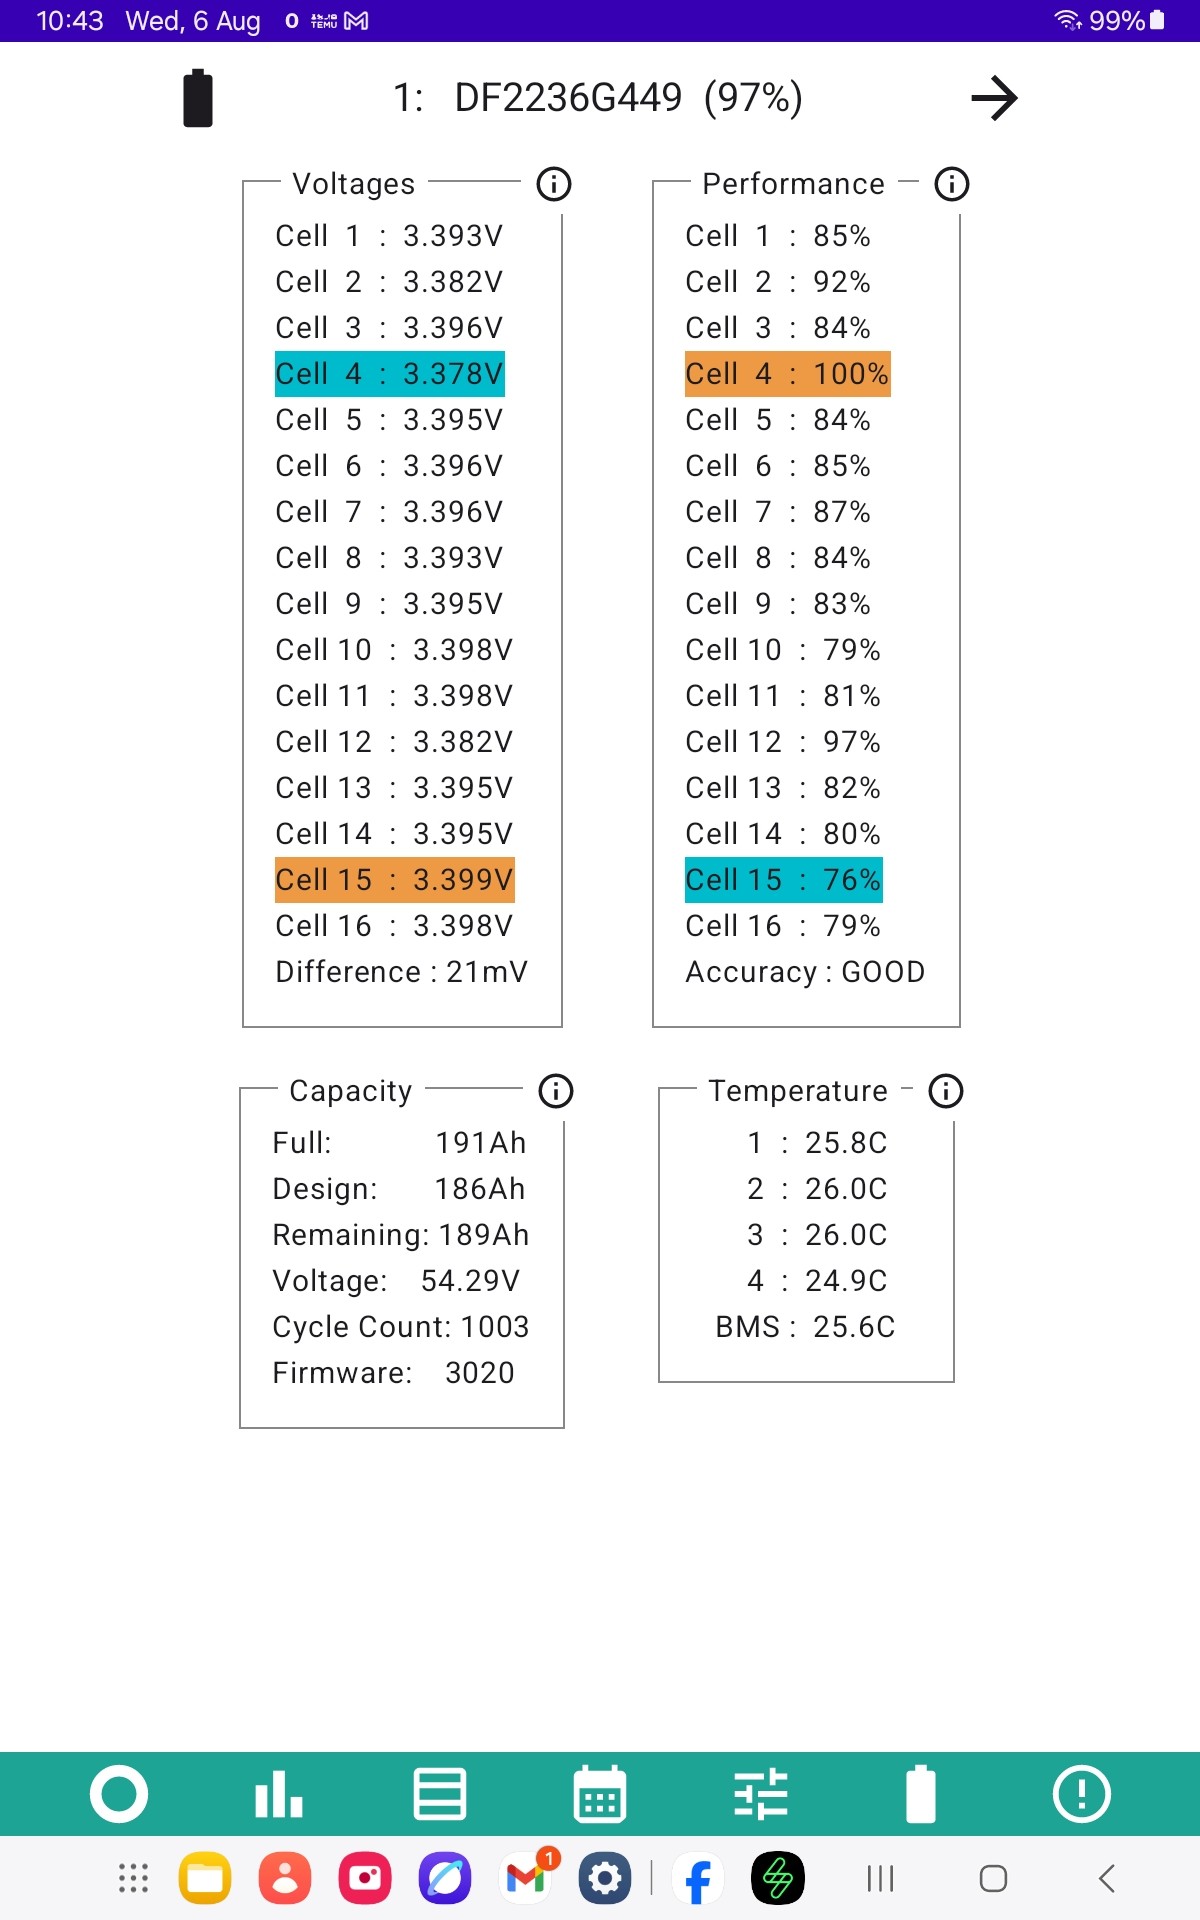
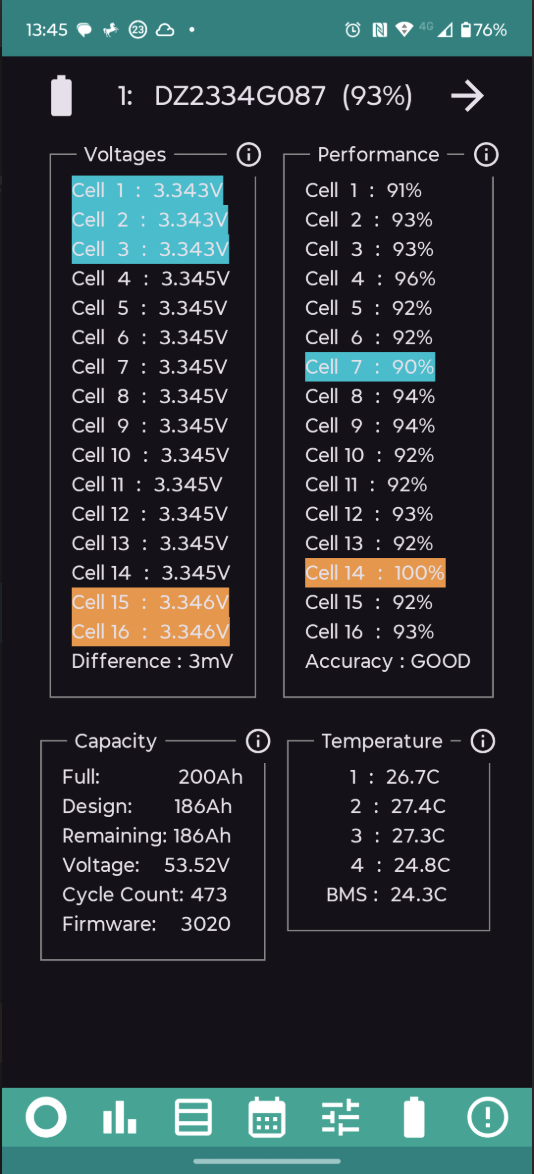
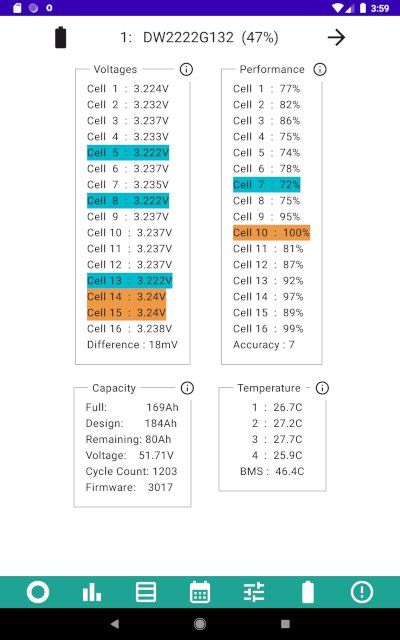
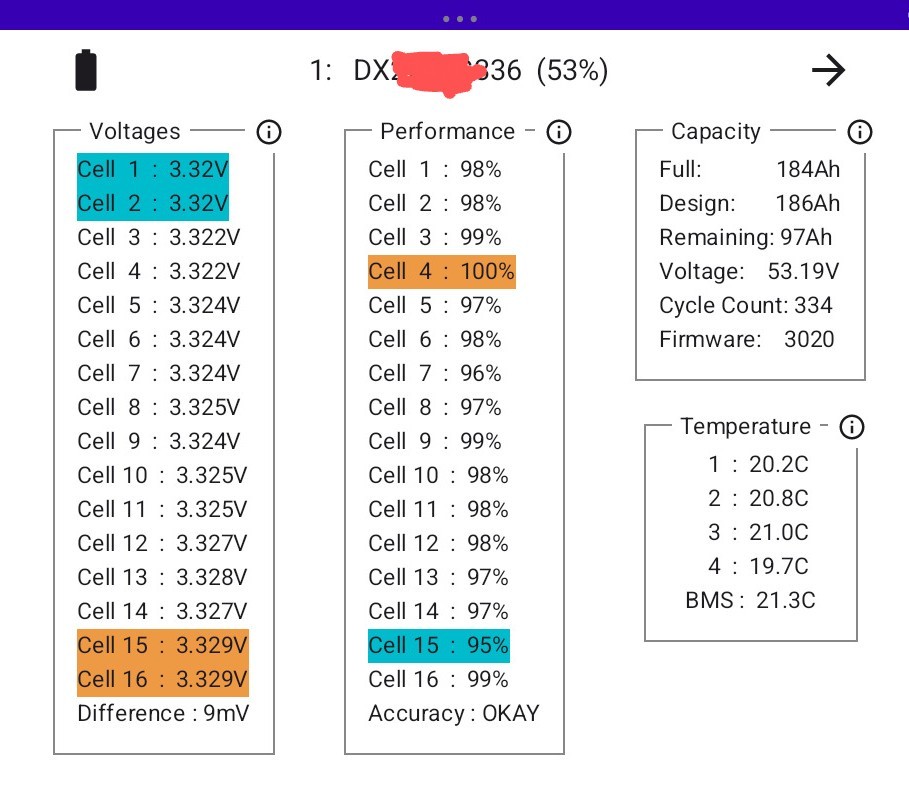
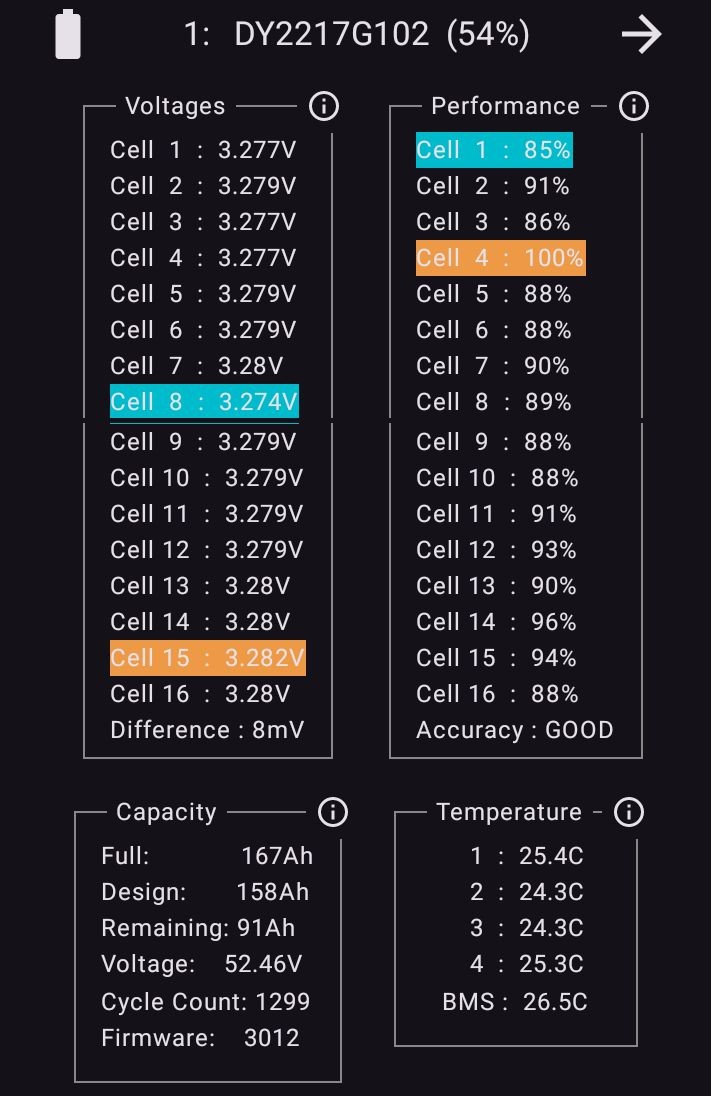
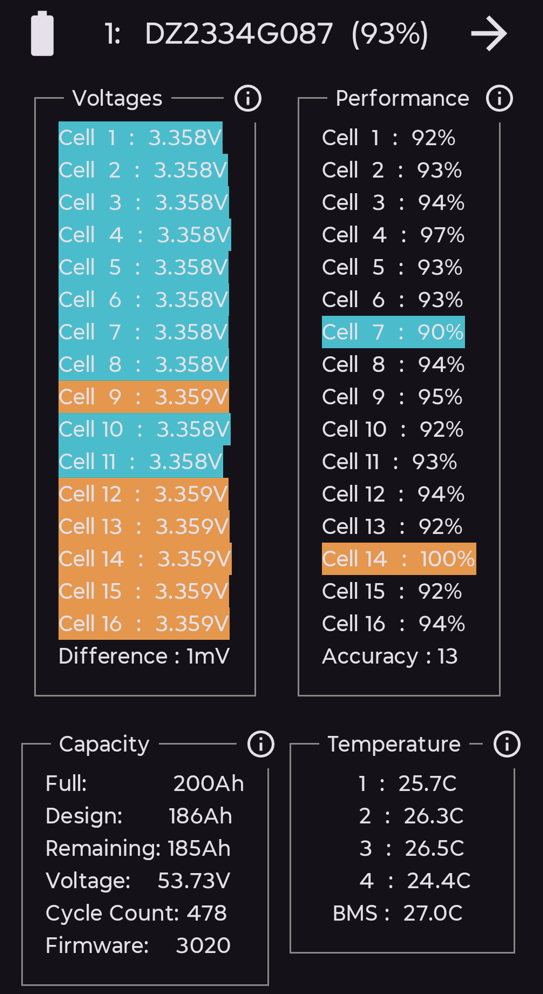
This is a test of the latest algorithm. I have changed the calculation from a time basis to a cycles basis, which makes little difference for me because my battery does about one cycle per day. I am also displaying the accuracy as a number ( 7 is equivalent to just reaching GOOD ).
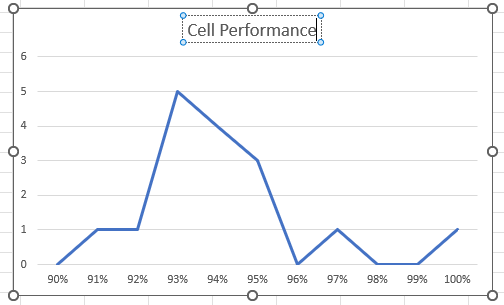
Looking at the low percentage against the cycle count we have:

473 cycles 90%
1003 cycles 76%
1203 cycles 72%

It might be tempting to extrapolate this and conclude that 0% is between 4000 and 5000 cycles, but this technology is unlikely to be so predictable, only future years will tell.

R
#72 Rubikcube

I have tweaked the calculation a bit in the new version of the app (v.7.3.1) which will be in the Play Store soon. It now works on battery cycles. Within each cycle the app accumulates data in memory only. When the battery cycle count changes, provided the collected data passes some checks, the percentages are updated and the accuracy goes up by one. If the collected data fails the checks, then it is not incorporated into the percentages and hence bad data doesn't (in theory) mess up the results. In the (unlikely) event of 3 cycles failing the check, the accuracy will go down by one. Accuracy is now shown as a number in the range 0 to 50.

O
#73 Ortwin

This is my two 9.5Kw batteries. The primary is just over two years old and the secondary 18 months old.

A
#75 alan_johnston

shot of my results

W
#76 wrighar

I've been on the newer 'numbers' version for a couple of days now (although was away for the weekend so I'm down to 13 now from 15.

Nice tight call grouping!
Would still like to be able to remove the highest call and %age grade from the 2nd down.

B
#77 Bob_Bobbings

🙁

R
#78 Robgy

Comparing other peoples screenshots, my system appears to be very poorly.
Both performance and cell voltage difference and yet capacity looks right.
I'm confused, it it good or bad?

D
#79 DD

[unknown] Perhaps cell #14 is particularly strong - the others are ranked relative to it, and there's a large gap from that to the next one down. Not necessarily a problem, though I did read on here that cell balancing may only start when all cells are above 3.4V, and cell #14 may never get that high (before the weaker ones get to 3.65V and force charging to stop).

My system is similar, though not as extreme: cell #6 is 100%, then there's a gap to 90% for the next couple. Good while since it's calibrated - no idea if it would rebalance things.

R
#80 Robgy

DD thank you for the reply, I think I understand your explanation about the significance of the cell voltage now.
Mine has only been calibrated once about this time last year.

Y
#81 yandards

Nice, just downloaded and logging data, got an early 100% DoD battery that is misbehaving so this will be far easier than digging through HA data plots.

W
#82 wrighar

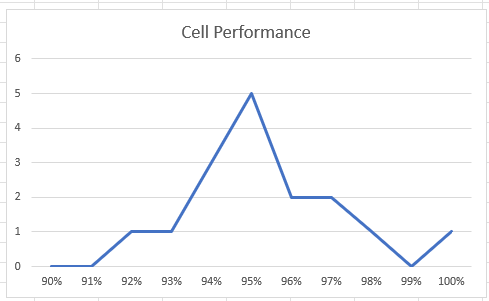
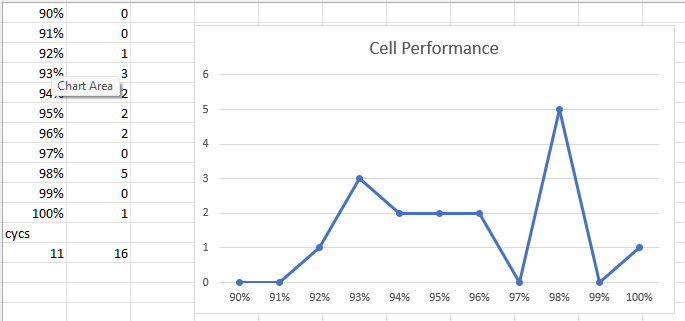
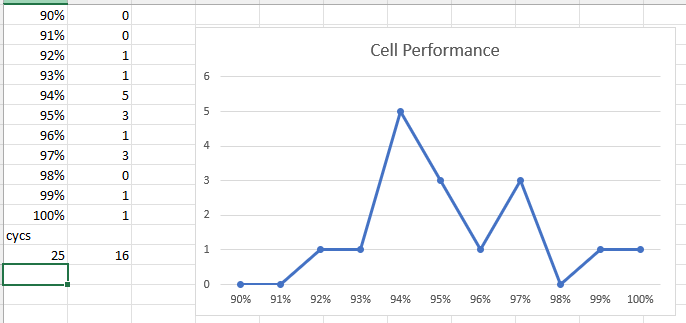
My cell performance counts:

W
#83 wrighar

Another 4 days and the numbers are going up:

R
#84 Robgy

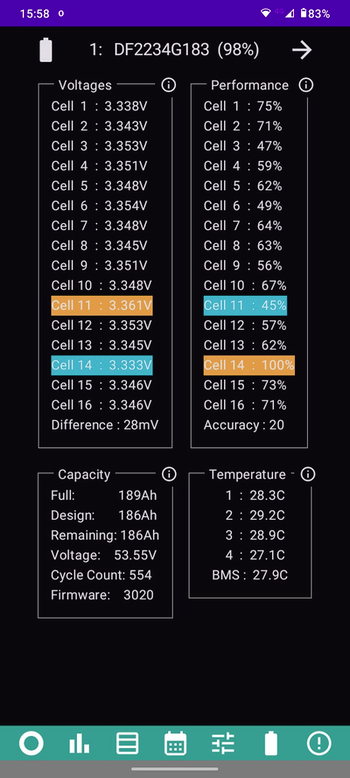
Thought it was perhaps time for an update now that the accuracy has increased to 20
It looks like my cells 11 and 3 are still poorly but the battery capacity appears to be fine.

W
#85 wrighar

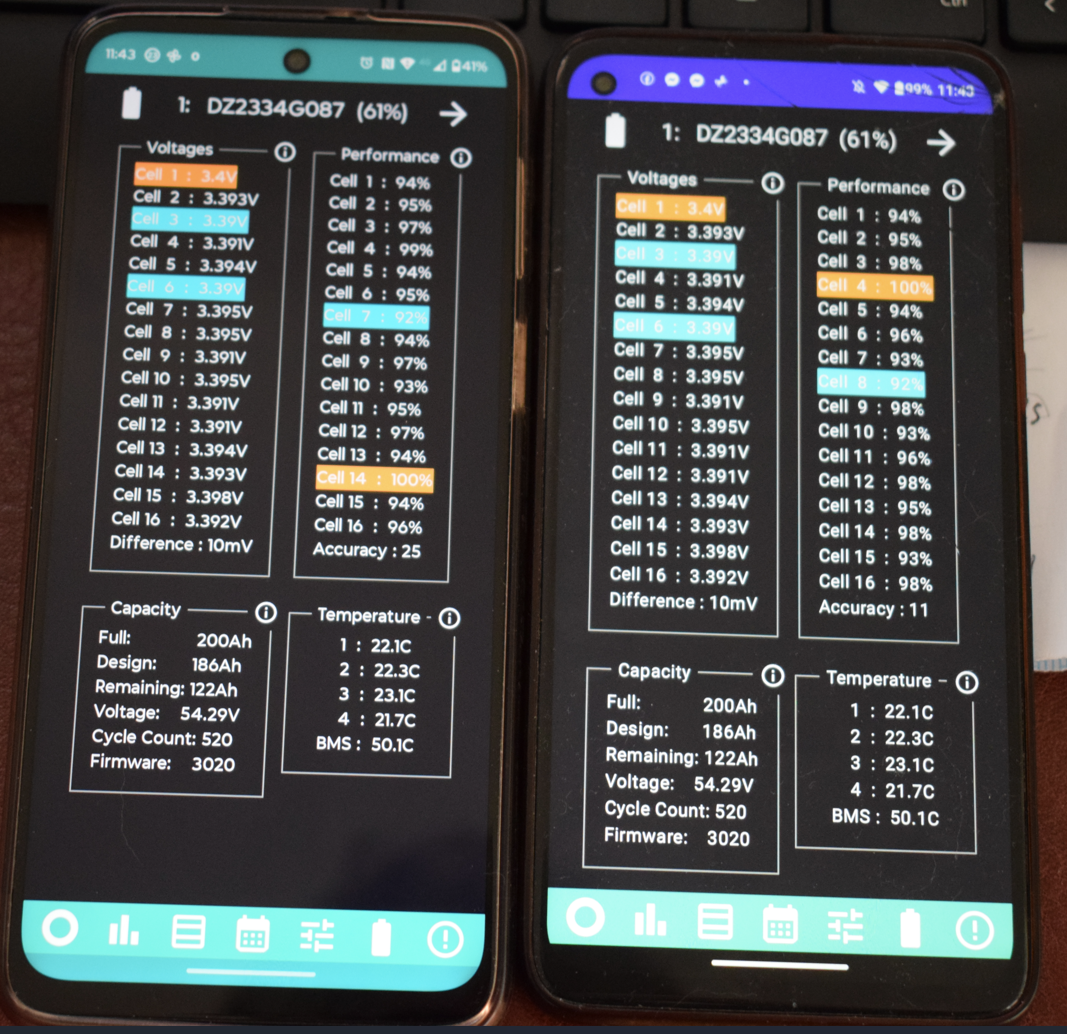
Two phones monitoring the same battery, started 3 weeks apart:

Pretty close


and

W
#86 wrighar

but it shows the difference a starting point makes....

92% and 100% calls different.

Overall, I'd say Healthy.

R
#87 Rubikcube

Thanks for posting results. It's interesting to see two apparently similar batteries both with about 500 cycles producing such different results. I think it's probably due to how well matched the cells were when the battery was assembled at the factory. How this will affect the long term performance I have no idea. Time will tell and it will be interesting to see the results at 1000 cycles.

R
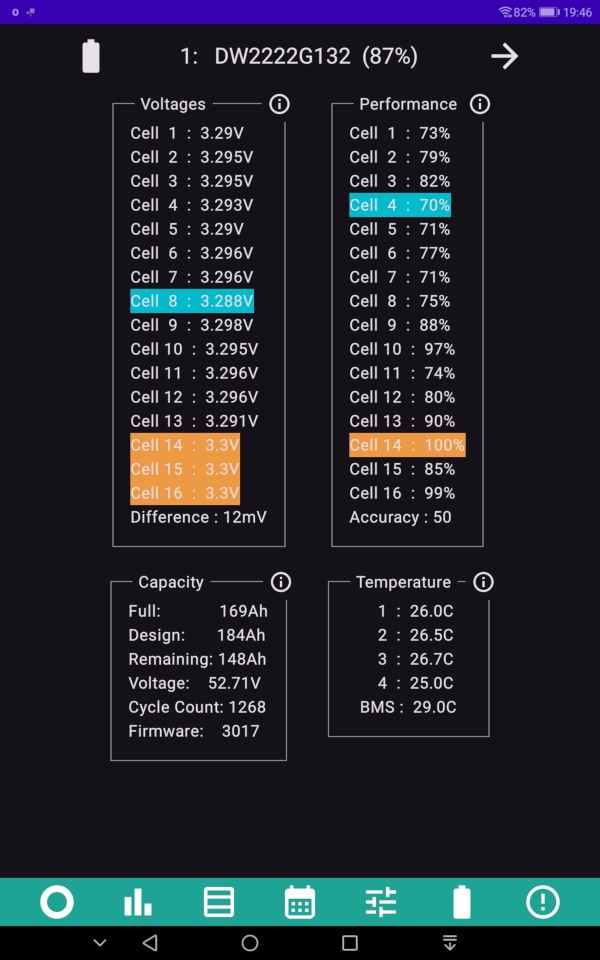
#88 Rubikcube

Just an update with my own battery performance. Cells 4 and 7 have been fighting it out for the bottom spot at around 70%, whilst 14 and 16 have been fighting for the top spot.

R
#89 Rubikcube

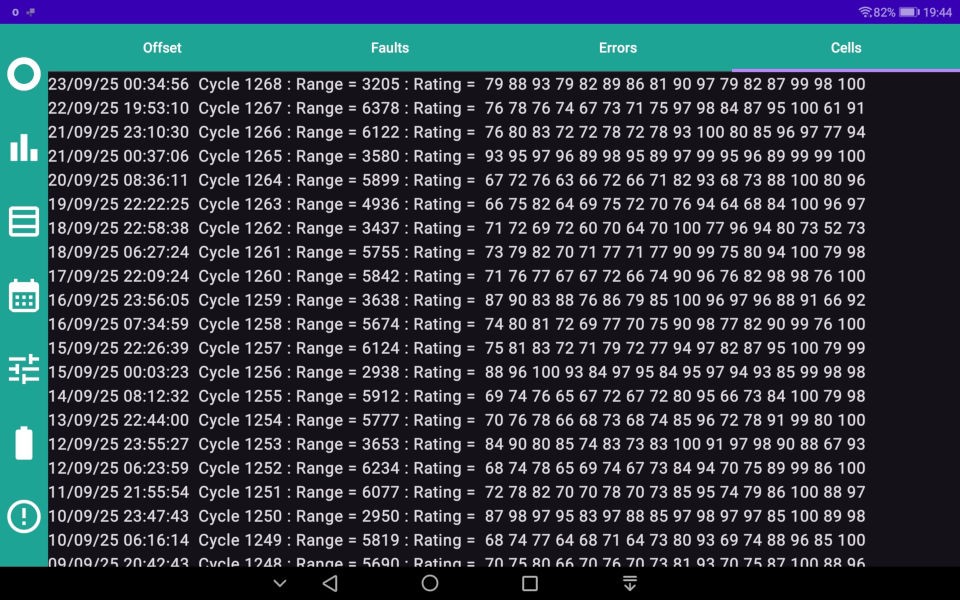
A behind the scenes look at the log I have on my development system. The battery measurements are analysed each BMS cycle. As with many GivEnergy readings there is quite a random factor (it's just not precision scientific equipment). My battery does one-and-quite-a-bit cycles each day. You can see the date time when the cycle changes. If the range value is outside 3000 to 8000 the result is discarded. Otherwise the ratings are accumulated into the moving average that you see. This screen isn't available in the released version because it's pretty meaningless except for debugging.
W
#90 wrighar

Rubikcube
It's the same battery, just started 3 weeks later on an old phone I don't take away from the house.

R
#91 Rubikcube

wrighar Sorry, not clear, I was comparing your battery to @Robgy battery.

W
#92 wrighar

Rubikcube

Ahh yes, vastly differing results..

R
#93 Robgy

Indeed, my performance is getting worse each time I check

T
#94 TimHutchings

Here's mine for what it's worth!
Cell 15 seems to have struggled all the way through, though is did go as low as 72 at one point.

N
#95 NormC

This is what my battery looks like. I've had it for very nearly a year. During July I was getting a lot of over voltage errors - so I calibrated it. It has been all right since.

W
#96 wrighar

Still doing nicely:

R
#97 Roberto

One of my cells is consistently at 66%, but so what ? what does it means, and is there a conversation to be had with Giv ? Or will they say, that is inside their tolerances, blah,blah and is not covered by the 10 year warranty?

S
#99 SteveCook

Roberto
Mine sits at accuracy of 4.
I have taken the view that as my capacity 184 Ah out of 184 Ah = 98.9% after 3 years then this is something I really should not be getting stressed about. There are plenty of other things to worry about

W
#100 wrighar

38 cycles / accuracy now, and I've reached cat like status.
4mV variance.

#103 Judith

What do everyone else’s batteries look like at 1500 cycles. After Nov 22 install in our first year we did 1 cycle per day but after the ashp and Cosy it’s 2.5 cycles a day in winter. So just finishing the 2nd winter.
One cell is consistently lower on the performance panel, but not especially so on the individual figures.
How many cycles/accuracy parameter before it’s worth thinking about, 30?

V
#104 Vestas

Judith Better asked over on his forums?

Not moderating in any way but he's probably got a lot on his plate right now & would appreciate comments on the app there 😉

#105 Judith

I would upload the details on the screen but I can’t right now

#106 Judith

Vestas actually I asked on here deliberately since others have participated in this measurement too, and it’s not critical enough to post on his forum. As you said a very busy man.

V
#107 Vestas

Judith Ah OK, I just thought he'd prefer it there in terms of being able to easily access discussions re his app.

Despite assurances I don't see this forum lasting.

#108 Judith

Vestas I too expect this forum to have a limited shelf life now, but while it does…..
I can’t upload capture of all figures but one cell has a higher voltage by 48mV (significant compared to accuracy) and shows performance of 69% with accuracy of 13.
That says slightly higher internal resistance of the cell to me, anyone disagree? Certainly worth knowing about.
The battery has seen 1560 cycles and shows capacity now of 176 vs factory of 186Ah.

O
#109 Ortwin

My two 9.5 Kw batteries (2023/24) are 546/453 cycles and within 3/6mv. Having said that, the last time I did a calibration (November 25) when going to 3022 software the primary battery capacity was reduced by 9Ah. Waiting for the summer to do another calibration to see what happens
.

W
#110 wrighar

Now my battery is back online after 3 months, it's not as well as it was before...
Multiple cells now at 90% and BMS high every charge:

Hmm, just looked again and 2 of the 90's have moved up


P
#111 pwdst

Would a calibration be wise under the circumstances?

#112 Judith

wrighar yours looks pretty good on cell balance but the high voltage implies a calibration needed?

W
#113 wrighar

Battery was calibrated Monday night as it was under a new warrenty replacement Inverter and had dropped from a 200Ah to 148Ah, so I did a calibrate overnight on cheaprate.

This brought it back up to 192.8 Ah, a 2% drop per year fro April 2024's last calibrate.

I'm also seeing some cell variation of 70-90mV at the top end of charging (at 100% /192Ah full), which the level off to 1-3mV

I may try a slow calibrate in July when it's warmer and the sun is out and do it in the morning.

Paul Landregan says only really do Calibration if absolutely necessary, all the newer BMS's self calibrate at the top end, so I'll watch if for a few weeks.

R
#114 Robgy

wrighar performance looks very good compared to mine and capacity too.
My performance actually improved over winter with full discharge and charge most days.

V
#115 Vestas

wrighar Are the error reports using "inverter voltage" or "BMS voltage".

If its BMS then I'd do another calibration because those voltages are a lot higher than I'd like to see on my battery.

I run an automation which stops charge at 55V (BMS) or when any cell goes over 3.47V. That's pretty much where a full* battery sits IME, regardless of what the SoC says.

*96% SoC on the BMS, 100% on inverter.

W
#116 wrighar

Vestas

V
#117 Vestas

wrighar I'd let it discharge until cutoff, leave it idle (not paused) for 3-4 hours to see if it rebalances and recovers some charge (it probably will - mine often recovers 3-5% on SoC).

If it does recover charge then let it discharge again until cutoff then fully charge on AC and see if it overvolts again.

Assuming it doesn't overvolt then it looks like the usual spring/summer SoC drift whenever PV is in the equation & the battery doesn't fully discharge every day.

I think this drift is made much worse on systems like mine which have small (3-4kW) arrays as the charge from PV to battery is very variable depending on house load - the coulomb counter just loses the plot.

If it does overvolt then try running another calibration.

You should consider putting an automation in place to prevent voltage excursions like you have in the graph above as (IME) there's no way to stop SoC drift entirely.

The 9.5kW battery I have normally peaks at 54.3V (90% inverter SoC) during charge then drops off as the charge rate is reduced between 90%-100% SoC. In summer the SoC is often more than 10% out so the battery charge rate doesn't taper off between 90-100% and this is what causes the problem as the battery cells are charged at max rate all the way to 3.65V in some instances. That's not healthy in terms of preserving lifespan.

V
#118 Vestas

wrighar Also that graph (despite the description in GivTCP) is actually the inverter's idea of the battery voltage.

If you use the actual battery voltage (GivTCP <battery s/n> Battery Voltage) then it should be a bit lower. You do want to get rid of the spikes though.

W
#119 wrighar

A smidge lower, peak of 57.2V Max, and 2 other 57.1V

#120 Maxwell

Are the cell 12 values here anything to be concerned about or does this just need a battery calibration cycle ? When the battery is fully charged cell 12 is about 50mv below the other cells and at it's peak is about 4 deg hotter than the others ? I haven't plotted the other cells as they are more tightly clustered around the cell 1 & 15 values.