Hi all. I’m continuing to try to understand my GivEnergy savings from directly generated solar.
I use Octopus as my electricity grid provider and I can see in their App how much kWh I import.
Can anyone tell me which of the GivEnergy graph reports with the specific data kWh I should be looking at in order to identify my kWh savings are via solar.
Many thanks
James
Savings through solar

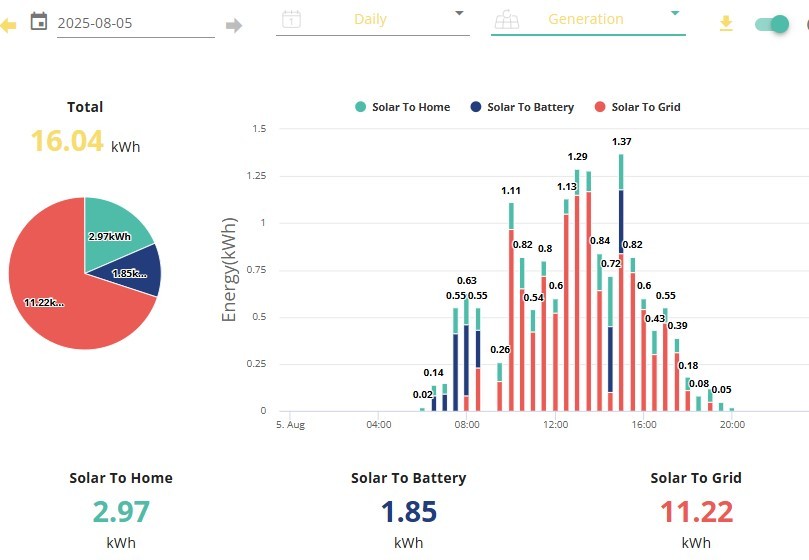
Hi. The Energy Graph (Legacy) can show solar production on a daily/weekly/monthly/annual basis. Is that the kind of thing you're looking for?

ChrisLav Thanks Chris. Almost. So I’m looking to use one of these graphs. But I need some help from the community to calculate what I’m actually generating in kWh and what I use to run the house to offset grid import.
As an fyi I also export any excess.
So which graph of data should I use and any calculations should I make - if any ?
I find its never quite clear cut but the way I do it is to use my energy bills to give me the net cost/saving and then add on the cost of the energy used by the home as a saving, from the energy graph Chris highlighted.
The GE graphs are not 100% accurate but without a specific meter installed to monitor consumption its the easiest option. I also run Home Assistant and the values that gives are a little different but you just have to stick with one source.
When it comes to home much value you put on a kWh of energy that's a different matter as tariff cost can be different if you didn't have solar or what time of day the energy is used.
For simplicity I just use the standard tariff cost and accept that as an approximation based on the theory that without my solar and batteries I would most likely be on something that averaged out to be close to the standard tariff.
Hope that helps

James-brown It can be a bit complicated if you do things like filling battery overnight then dumping it back to the grid in the evening.
A very simple approach is to consider the consumption reported by GE. Pre-solar, that would have been entirely imported, so you could cost it at SVT rates. Then compare that with actual costs (import minus export). Slightly harder if you would have been on Tracker import tariff rather than SVT if you didn't have solar, but the averaged tracker rate would probably be good enough.
If you get a performance report from the GE portal, it does show a saving. But for me it's basing it on a tariff rate of 17p/kWh, but I'm not sure where it's getting that from.

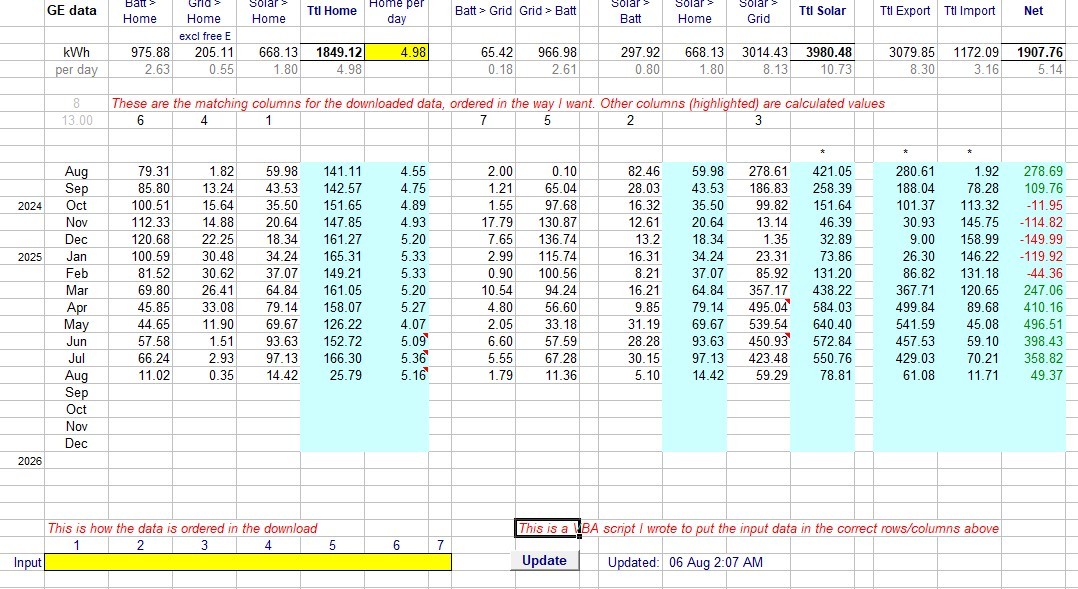
James-brown Again, using the Energy Graph (Legacy) on whatever time period you want. There is a download button which will produce a csv file called Energy Flows Data xxxxx, with totals at the bottom which I use to populate a spreadsheet. [I download the data most evenings around midnight, but I'm a sad git with too much time on my hands, and the data can be downloaded weekly or monthly (or even yearly). ] The spreadsheet gives me the information I need, in a format that I prefer. See example below (hopefully!) with notes

Can also use the desktop app to generate a report over any period but day, month, year already there. See miscellaneous/reports on lower LH side. Would have pasted a picture but this website steadfastly refuses to accept it.
My initial experience is that GE is reporting a lower power flow than is charged/paid for by Octopus, though am still checking details for variance. Greater than apparent meter calibration on low power flow occasions, and may be due to method and frequency of measurement.

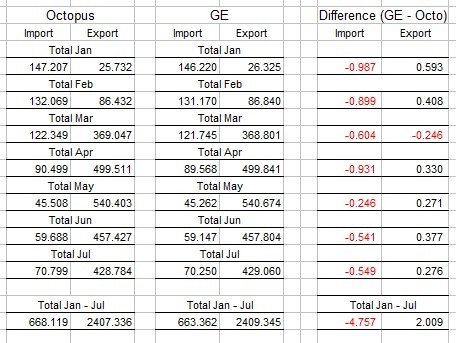
The_Engineer Re discrepancies between GE and Octopus figures - yes, that's been my experience also. Generally GE tends to slightly over-report export and under-report import, but the differences are mostly negligible. Over a 7-month period this year GE over-reported export by c. 0.08% and under-reported import by c. 0.72% (see below)


PS: I need to get a life...
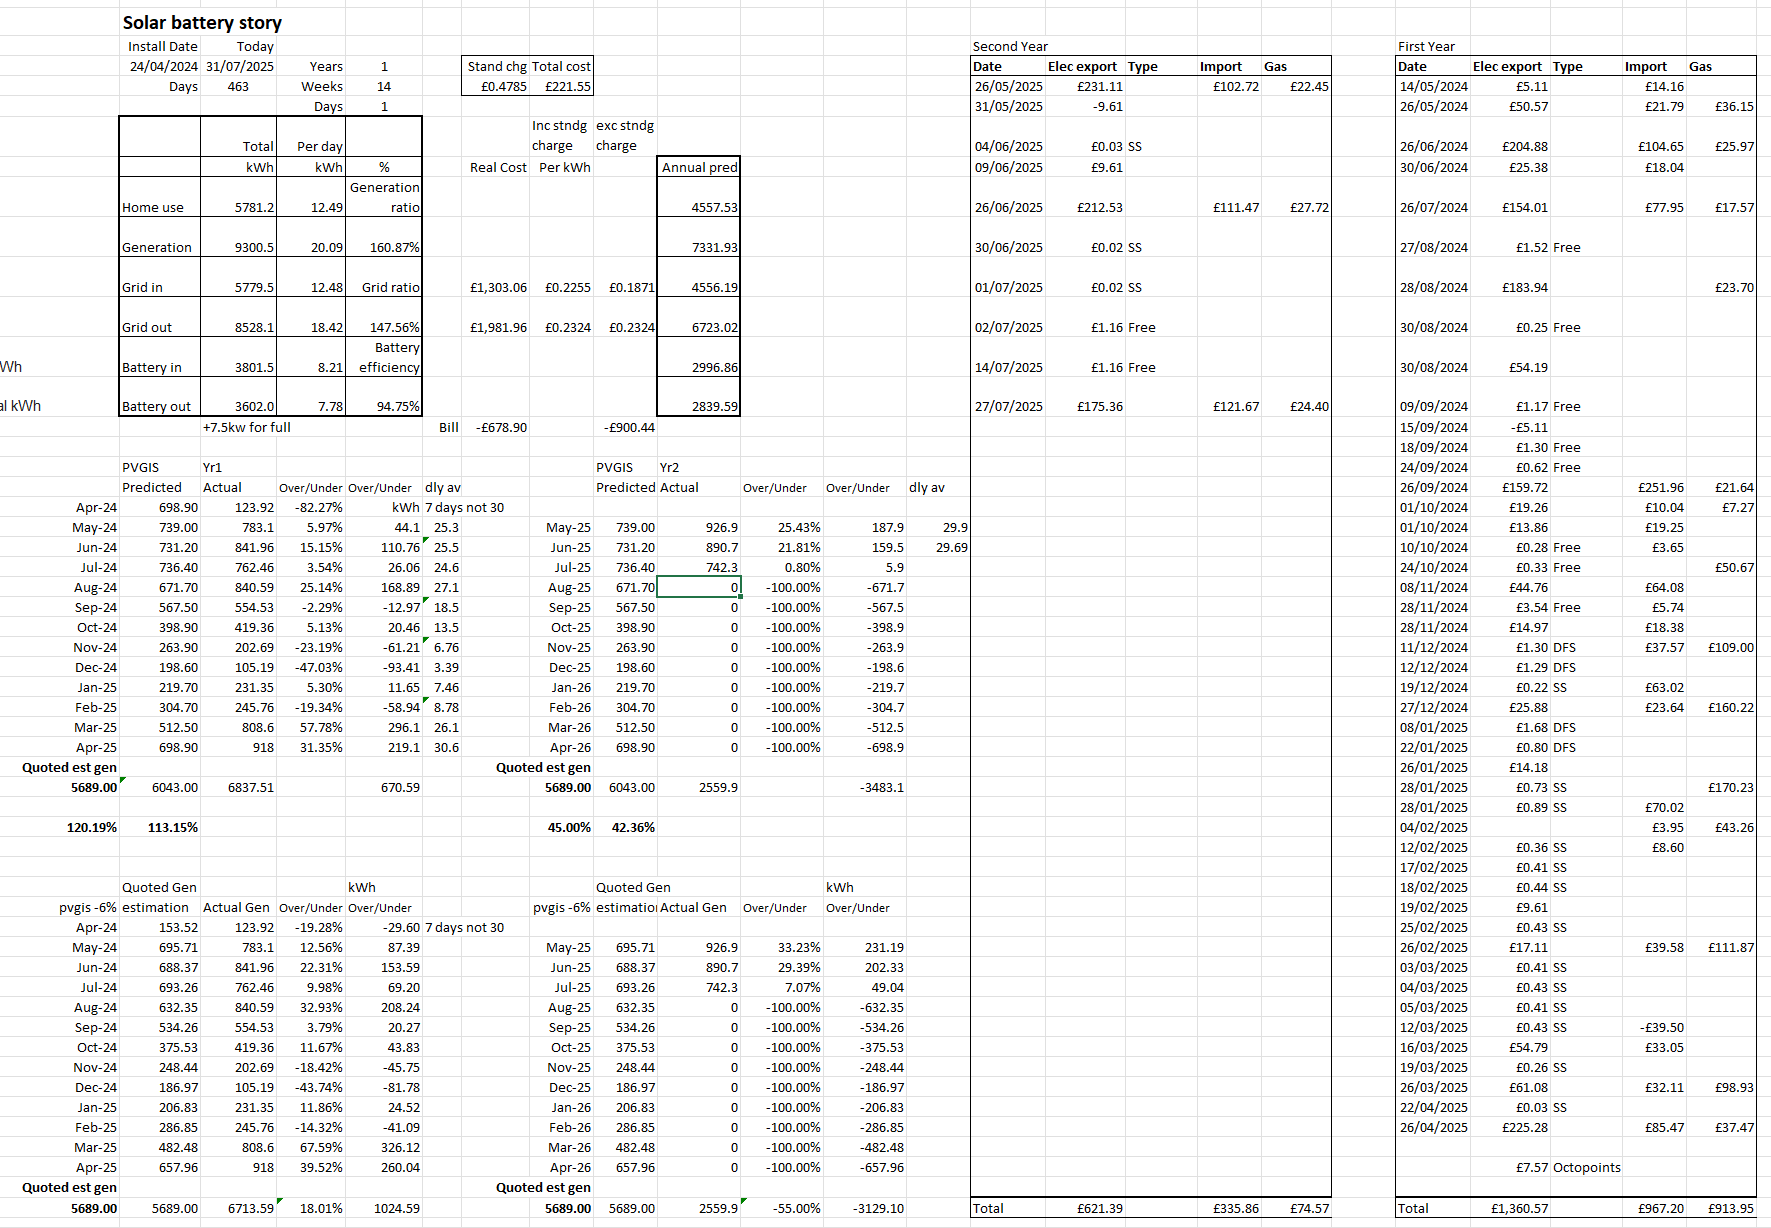
I track all import, export and free bits.
Used to spend around £1600 annually on electricity including standing charge.
Last year we were paid about £400 after the £180 standing charge was paid.
If we remove the standing charge, were easily £2,150 better off last year, which if the following few years follow, we will have paid off the £9,400 coat in just over 4 years, (by July 2028) assuming no price rises.

ChrisLav Yes I must get out more too
My variances between the Smart meter and GE reports are generally around 2% (and therefore withing calibration errors of metering if my reading of the statutes and specifications are correct) but swing more widely (and wildly) at low power flows. I shall continue to monitor
It really is tail chasing. With panels alone we were getting a significant cash saving. We then queered the pitch adding an ASHP last November.
Over the first winter and settling in our energy consumption was definitely higher. Since then other factors to the fore:
No gas charges
Exceptional Spring Solar generation
8 hours of grid at around 13p/kW
The net result is zero bills from April with only 3kW/hr from solar and 5kW from battery.
My installation was £8500 plus £1800 ASHP - £10300. -