My Energy Graph - Legacy shows zero half hour data (HHD) as of Friday 19th from 1100. I only knew about this as of yesterday morning. It is continuing today i.e. no HHD on the Legacy Energy Graph. I have downloaded HHD from this graph since January of this year, when the Energy Graph started showing graphs with chunks of HHD missing. Does anyone have an solution?
I have also posted about this on the "Official" Forum (Beta) without a reply as yet.

Energy Graph - Legacy
Henwobi unlikely you will get a reply from givenergy in either place.
Hopefully someone will spot a bit of the portal is broken and fix it on Monday that sounds like what’s happened
Henwobi I spotted that problem as well but it looks like its fixed now.

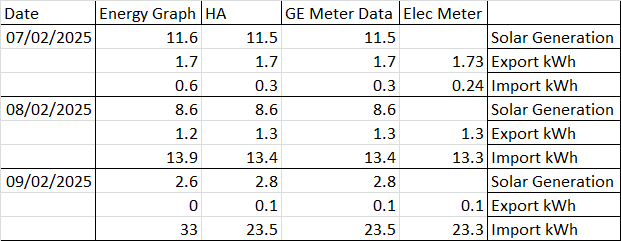
Paul70 Agree it now seems to be fixed. The Legacy version has always given more accurate results than the newer version (matching - more or less - the actual consumption figures from Octopus)
It has been fixed including access to the days I missed while it was down. If anyone from GivEnergy reads this: thank you.
The Energy Graph (Legacy) has disappeared from my dashboard. I still don't think that I am seeing the correct figures in the Energy Graph. It is saying that I have imported 19.2kW so far today, HA tells me I have imported 16.2kW. I will check the Bright app in the morning for the meter readings and see which is right.
The Energy Graph - (Legacy) has also disappeared from my dashboard. I have been recording daily figures from the Legacy version since xmas and these figures are very similar to the daily figures shown by the Octopus app.
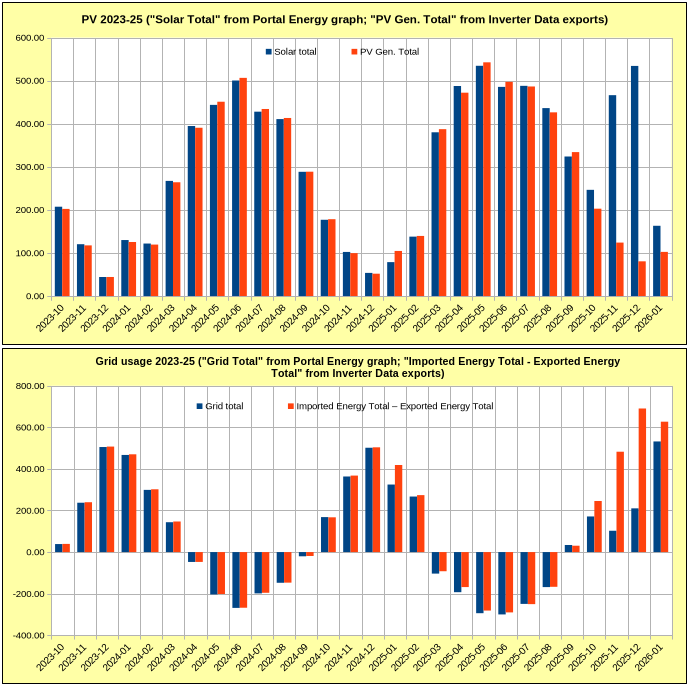
The Energy Graph (non Legacy) data has always been significanty different to the Octopus figures. I have even had solar gain figures of 9kWh at 3am and this is in Scotland in the middle of winter!
I have been discussing this for months now with my installer (eviGroup) who have been trying to get some reaction from Givenergy - with no success.
Now that the Legacy version has gone I can no longer get hold of accurate data.
Not happy about this total lack of customer support.
RT I'll check tomorrow but I hope this isn't correct. I've also been using the legacy stats as they seemed accurate. The solar gen stats particularly on the new data are way off. Having trustworthy data is essential for assessing system performance and potentially fault finding. Hopefully GE are on the case with this as it's pi$$ poor.

My Energy Graph (Legacy) has also vanished from the dashboard, replaced by the non-legacy version, which I have found in the past to be very inaccurate. I'll compare readings over the next few days with what Octopus are registering in terms of kWh in and out, and maybe work out some kind of adjustment figure for my record-keeping...

Hmm... Looking at Feb 8th, the Legacy version showed 4.68 kWh import, versus Octopus 4.675. The non-legacy version shows 4.9 kWh for that day. Similarly with export - 1.18 v 1.171, and non-legacy 1.1 (not a lot of sun that day, but more than the previous three days!). I'll continue to monitor the differences...
Yes, gone for me too :-(
Mine's gone as well :-(
Yep Legacy has gone on mine too and agree that "new" version is hopelessly innaccurate!
I dont think anyone from GivEnergy reads this forum. I think it would be worthwhile reposting on https://community-beta.givenergy.cloud.
NormC I've checked the figures for the past three days and they are pretty close - apart from the import figures for yesterday. That is way out for some reason.

I'd noticed that Legacy & non-Legacy had been trending towards parity, over the past month, or so... Certainly much closer than the crazy differences I'd been seeing in the past.
@RT - for graphing of energy (and a lot more), I download the daily CSVs that you get from the portal's My Inverter > Inverter Data page...

jonhd it does seem to be improving, I haven't lobbed anything into a spreadsheet yet but generally the data seems better. Thanks for monitoring and if you get chance, please let us know how it progresses.
My legacy graph also disappeared. I would love vaguely accurate details of my home consumption (in the past the non-legacy graph figures appear to be very inaccurate). I did get a sort of response from GivEnergy, but not a very helpful one. Looking at the figures today, the non-legacy graph doesn't appear to be that accurate still. As in I really don't see why I would have used 10% more electricity already this month than I did last year (with a week to go!).
I assume the only way for me to get home consumption figures will be through GivEnergy (ie I can't glean anything from Octopus?).

Claire As jonhd says above - you can use the GE Inverter data (meter data) which should give you daily consumption figures (as well as import, export, PV generation etc figures). I use them to 'correct' the figures given by the non-legacy energy graph. I found the legacy graph matched the Octopus import/export figures reasonably closely in the past, whereas the non-legacy version seems to be quite untrustworthy. 2 days ago the graph figures showed 11.1 kWh house consumption, almost entirely in the period 12.00-12.30am, whereas the meter data (and Octopus) showed almost nothing. Which begs the question: where does the energy graph get its figures? Certainly not from the inverter data...
ChrisLav - True, shame that you can only download one day at a time! Not sure I have the energy to go back and correct the old data!!
It (the daily data downloads) is also a lot of data! E.g. My January 2026 spreadsheet is 9000 rows by 42 columns
And, gulp!, did I say the new Energy Graph accuracy might have improved...