My custom Power Graph for Home Assistant

10 comments started 2026-04-15 last 2026-04-18
Home AutomationHome Assistant
G
#1 Guybrush-Threepwood

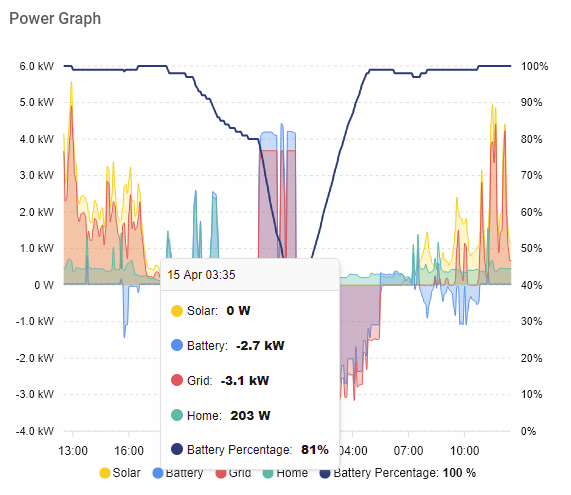
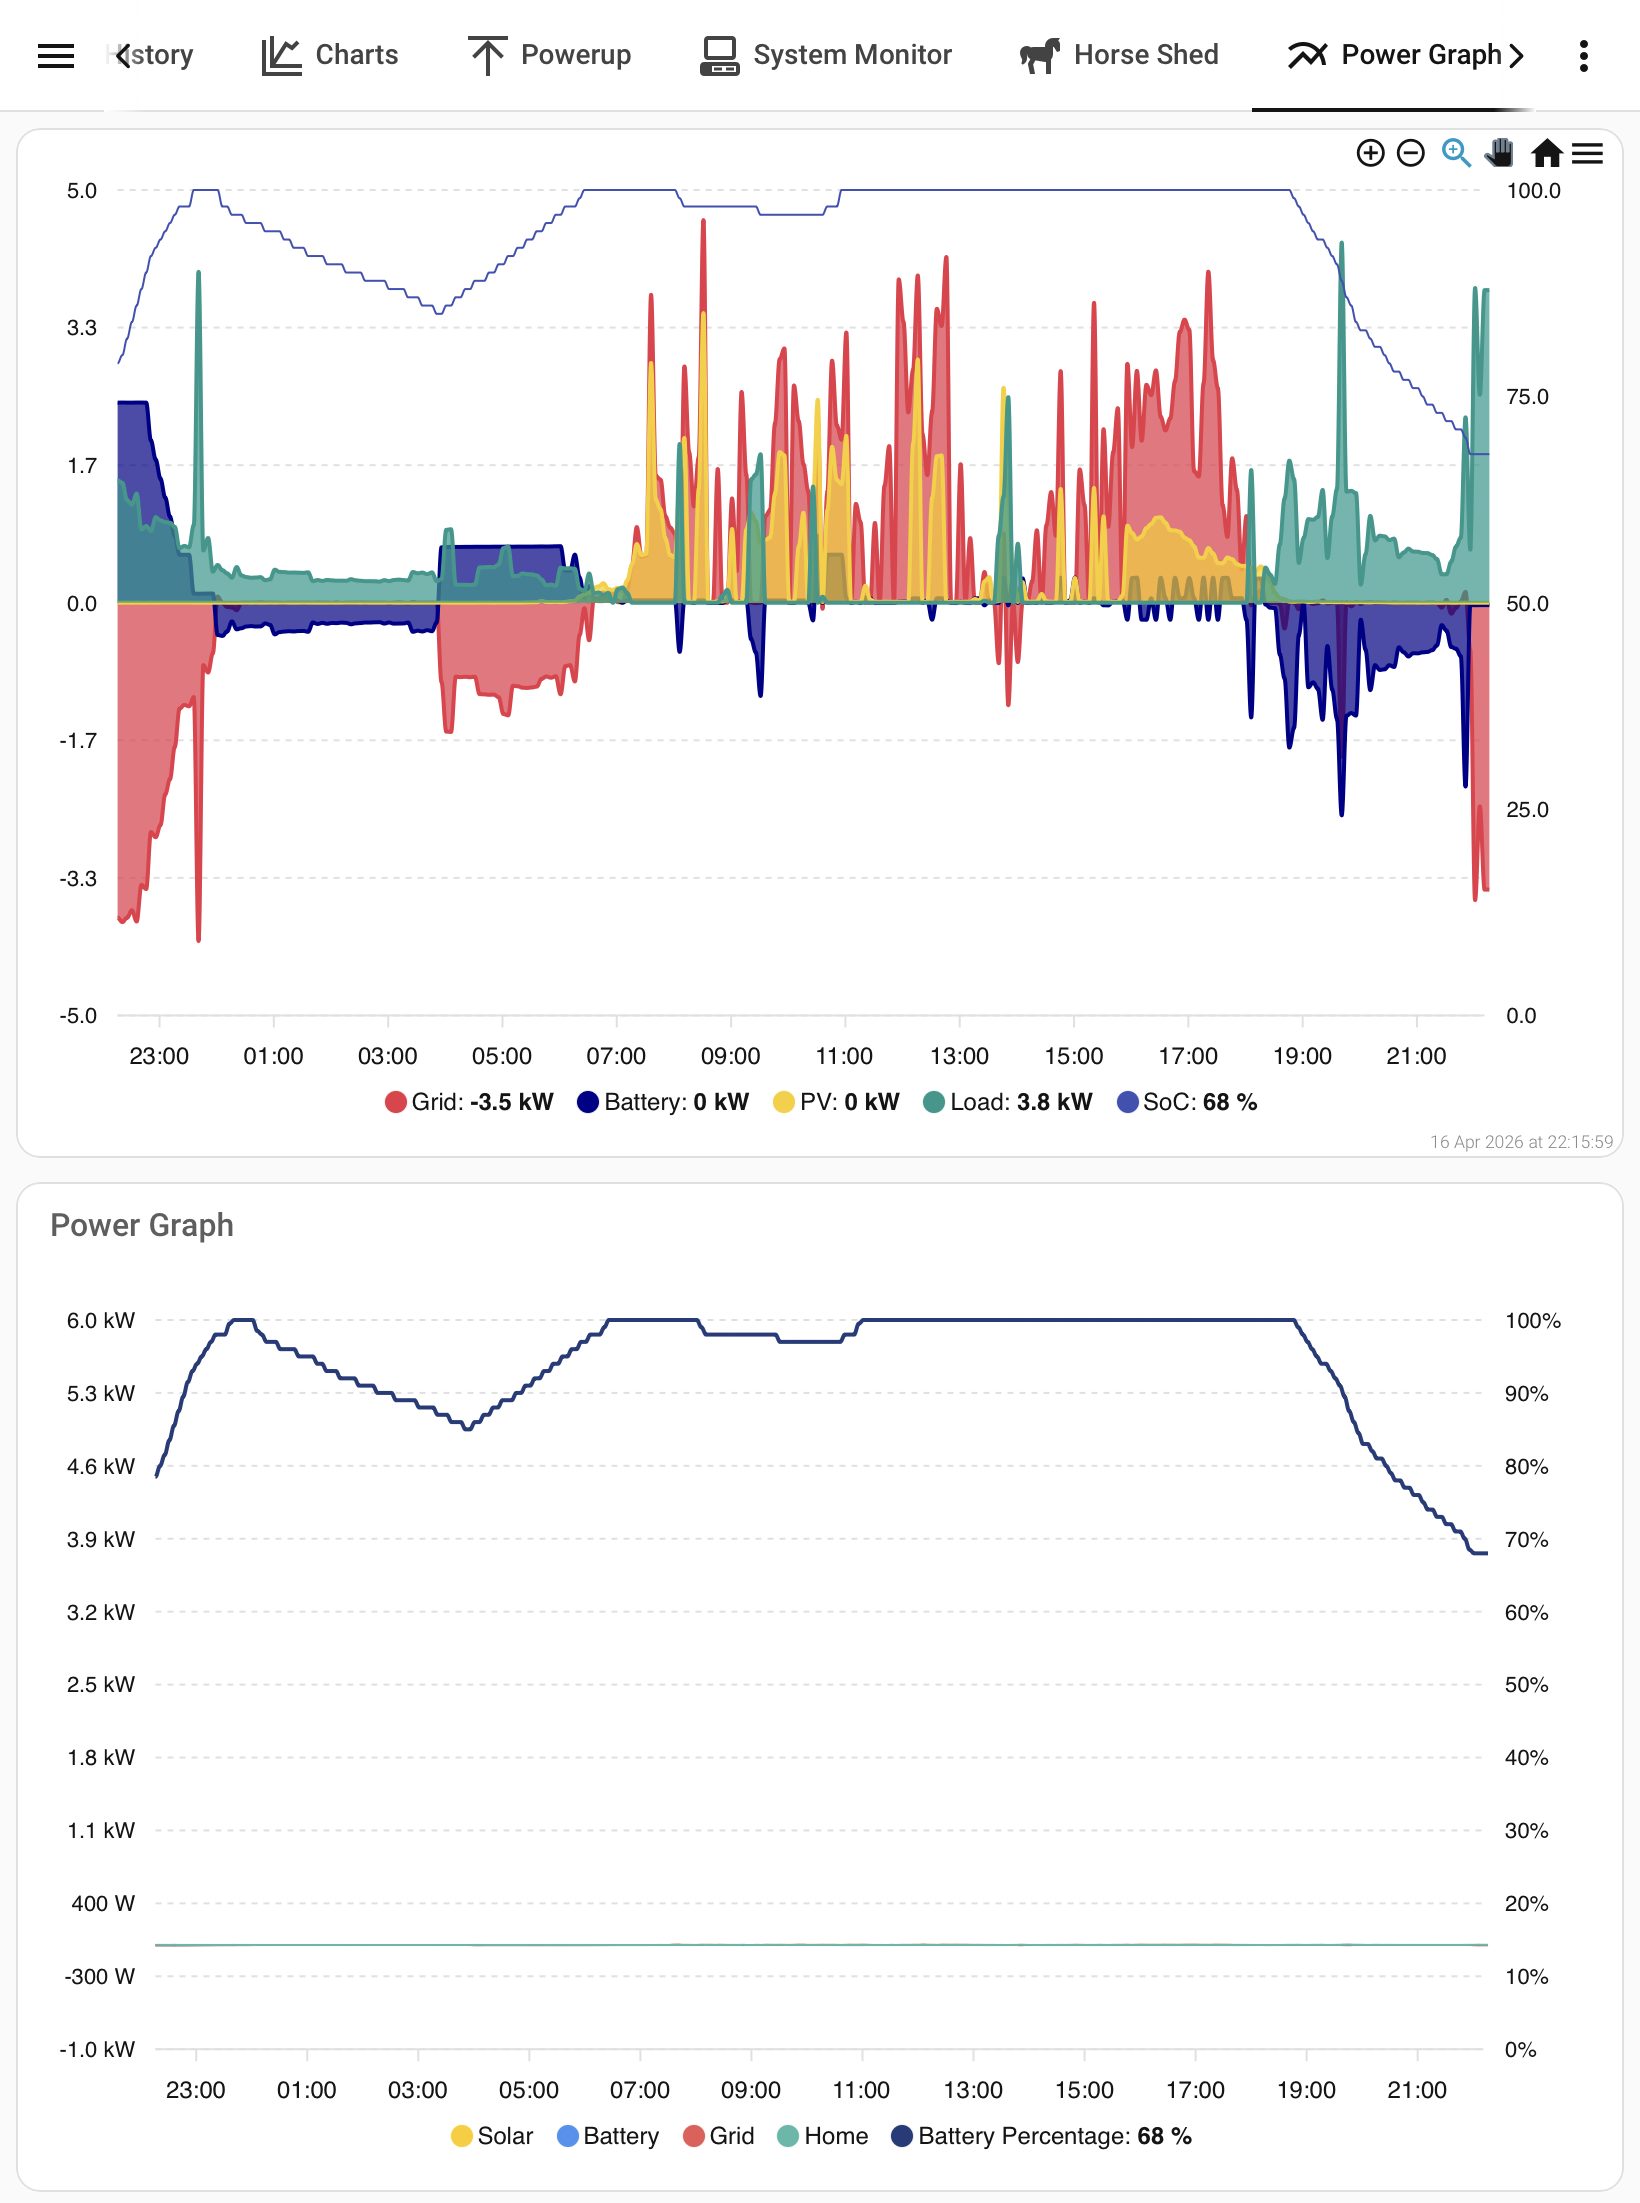
With many of you jumping on the Home Assistant train I thought I would share with you my power graph, made using the Apex Charts custom integration that mimics the GivEnergy one but with a few tweaks to make the colours more userfriendly with light and dark themes and the layers optimized.

It also includes some calculations to show values as Watts until it hits 1,000 and then moves to kW. You can tweak things like decimal places if you so wish.

Add the code pasted below into a new visual and replace the xxxxxx with your inverter serial number.
type: custom:apexcharts-card
cache: true
experimental:
  color_threshold: true
header:
  show: true
  title: Power Graph
graph_span: 24h
show:
  last_updated: false
  loading: false
apex_config:
  chart:
    height: 450px
  markers:
    shape: circle
  xaxis:
    type: datetime
    tooltip:
      enabled: false
  tooltip:
    shared: true
    enabled: true
    followCursor: false
    intersect: false
    style:
      fontSize: 12px
      fontFamily: Helvetica, Arial, sans-serif
      fontWeight: 400
    custom: |
      EVAL:function a({ series, seriesIndex, dataPointIndex, w }) {
          const hoverXaxis = w.globals.seriesX[seriesIndex][dataPointIndex];
          const hoverIndexes = w.globals.seriesX.map((seriesX) => {
              return seriesX.findIndex((xData) => xData === hoverXaxis);
          });
          
          const units = ['W', 'W', 'W', 'W', '%'];
          
          const formatValue = (value, index) => {
              if (index === 4) {
                  return Math.round(value) + '%';
              }
              const absValue = Math.abs(value);
              if (absValue >= 1000) {
                  return (value / 1000).toFixed(1) + ' kW';
              }
              return Math.round(value) + ' W';
          };
          
          let hoverList = "";
          hoverIndexes.forEach((hoverIndex, seriesEachIndex) => {
              if (hoverIndex >= 0) {
                  hoverList += `
                      <div class="apexcharts-tooltip-series-group apexcharts-active" style="order: 1; display: flex; font-size: 12px; font-weight: 400; font-family: Helvetica, Arial, sans-serif;">
                          <span class="apexcharts-tooltip-marker" style="background-color: ${
                              w.globals.markers.colors[seriesEachIndex]
                          }; border-radius: 50%; width: 12px; height: 12px;"></span>
                          <div class="apexcharts-tooltip-text">
                              <div class="apexcharts-tooltip-y-group">
                                  <span class="apexcharts-tooltip-text-y-label">${
                                      w.globals.seriesNames[seriesEachIndex]
                                  }: </span>
                                  <span class="apexcharts-tooltip-text-y-value" style="font-weight: 800;">${formatValue(
                                      series[seriesEachIndex][hoverIndex], seriesEachIndex
                                  )}</span>
                              </div>
                          </div>
                      </div>`;
              }
          });
          const date = new Date(hoverXaxis);
          const parsed = date.toDateString().split(" ").slice(1);
          const time = date.toLocaleTimeString('en-GB', { hour: '2-digit', minute: '2-digit' });
          return `<div class="apexcharts-tooltip-title" style="font-size: 12px; font-weight: 400; font-family: Helvetica, Arial, sans-serif;">${
              parsed[1] + " " + parsed[0] + " " + time
          }</div>${hoverList}`;
      }
series:
  - entity: sensor.givtcp_xxxxxx_pv_power
    name: Solar
    type: area
    opacity: 0.2
    color: "#FFCC01"
    yaxis_id: power
    unit: W
    stroke_width: 1
    extend_to: now
    show:
      legend_value: false
  - entity: sensor.givtcp_xxxxxx_battery_power
    name: Battery
    type: area
    opacity: 0.3
    color: "#4593f1"
    yaxis_id: power
    unit: W
    stroke_width: 1
    extend_to: now
    show:
      legend_value: false
  - entity: sensor.givtcp_xxxxxx_grid_power
    name: Grid
    type: area
    opacity: 0.3
    color: "#EA5A56"
    yaxis_id: power
    unit: W
    stroke_width: 1
    extend_to: now
    show:
      legend_value: false
  - entity: sensor.givtcp_xxxxxx_load_power
    name: Home
    type: area
    opacity: 0.3
    color: "#50baa9"
    yaxis_id: power
    unit: W
    stroke_width: 1
    extend_to: now
    show:
      legend_value: false
  - entity: sensor.givtcp_xxxxxx_soc
    name: Battery Percentage
    type: line
    color: "#233C7B"
    yaxis_id: soc
    stroke_width: 2
    extend_to: now
yaxis:
  - id: power
    align_to: 1000
    min: ~6000
    max: ~6000
    decimals: 0
    apex_config:
      tickAmount: 10
      labels:
        formatter: |
          EVAL:function(value) {
            if (Math.abs(value) >= 1000) {
              return (value / 1000).toFixed(1) + ' kW';
            }
            return Math.round(value) + ' W';
          }
  - id: soc
    min: 0
    max: 100
    decimals: 0
    opposite: true
    apex_config:
      tickAmount: 10
      labels:
        formatter: |
          EVAL:function(value) {
            return Math.round(value) + '%';
          }
all_series_config:
  group_by:
    duration: 5min
    func: avg
    fill: last
  float_precision: 0
R
#2 Robgy

Guybrush-Threepwood but with a few tweaks to make the colours more userfriendly with light and dark themes

The ge software certainly needed the ability for users to change its colours 👍

G
#3 geoffreycoan

Guybrush-Threepwood thanks for sharing

I like the more muted colours and the clever logic you added to auto-scale the entities, unfortunately it doesn’t work for me, see lower chart:

I suspect it doesn’t work because the chart configuration assumes that the source entities are in Watts. Mine are all set to kW because I find it easier to display everything consistently in kW rather than look at lots of figures in watts that are spurious detail.

I have similar charts (I think Paul Landregan first shared them), top chart, and the colours are more garish.

One thing I have changed from the GivEnergy default is I have swapped the battery power sense around so when the battery is charging from the grid then the battery and grid are opposite sides of the axis line, and when discharging to meet house load, again they are opposite sides. I think the GivEnergy power graph is flawed in the way it displays the data, but personal choice and all that.

TBH this isn’t a set of charts I Look at all that often. As I have two inverters that share the load between them and a separate FIT array the simple single inverter view isn’t complete so I tend not use it.

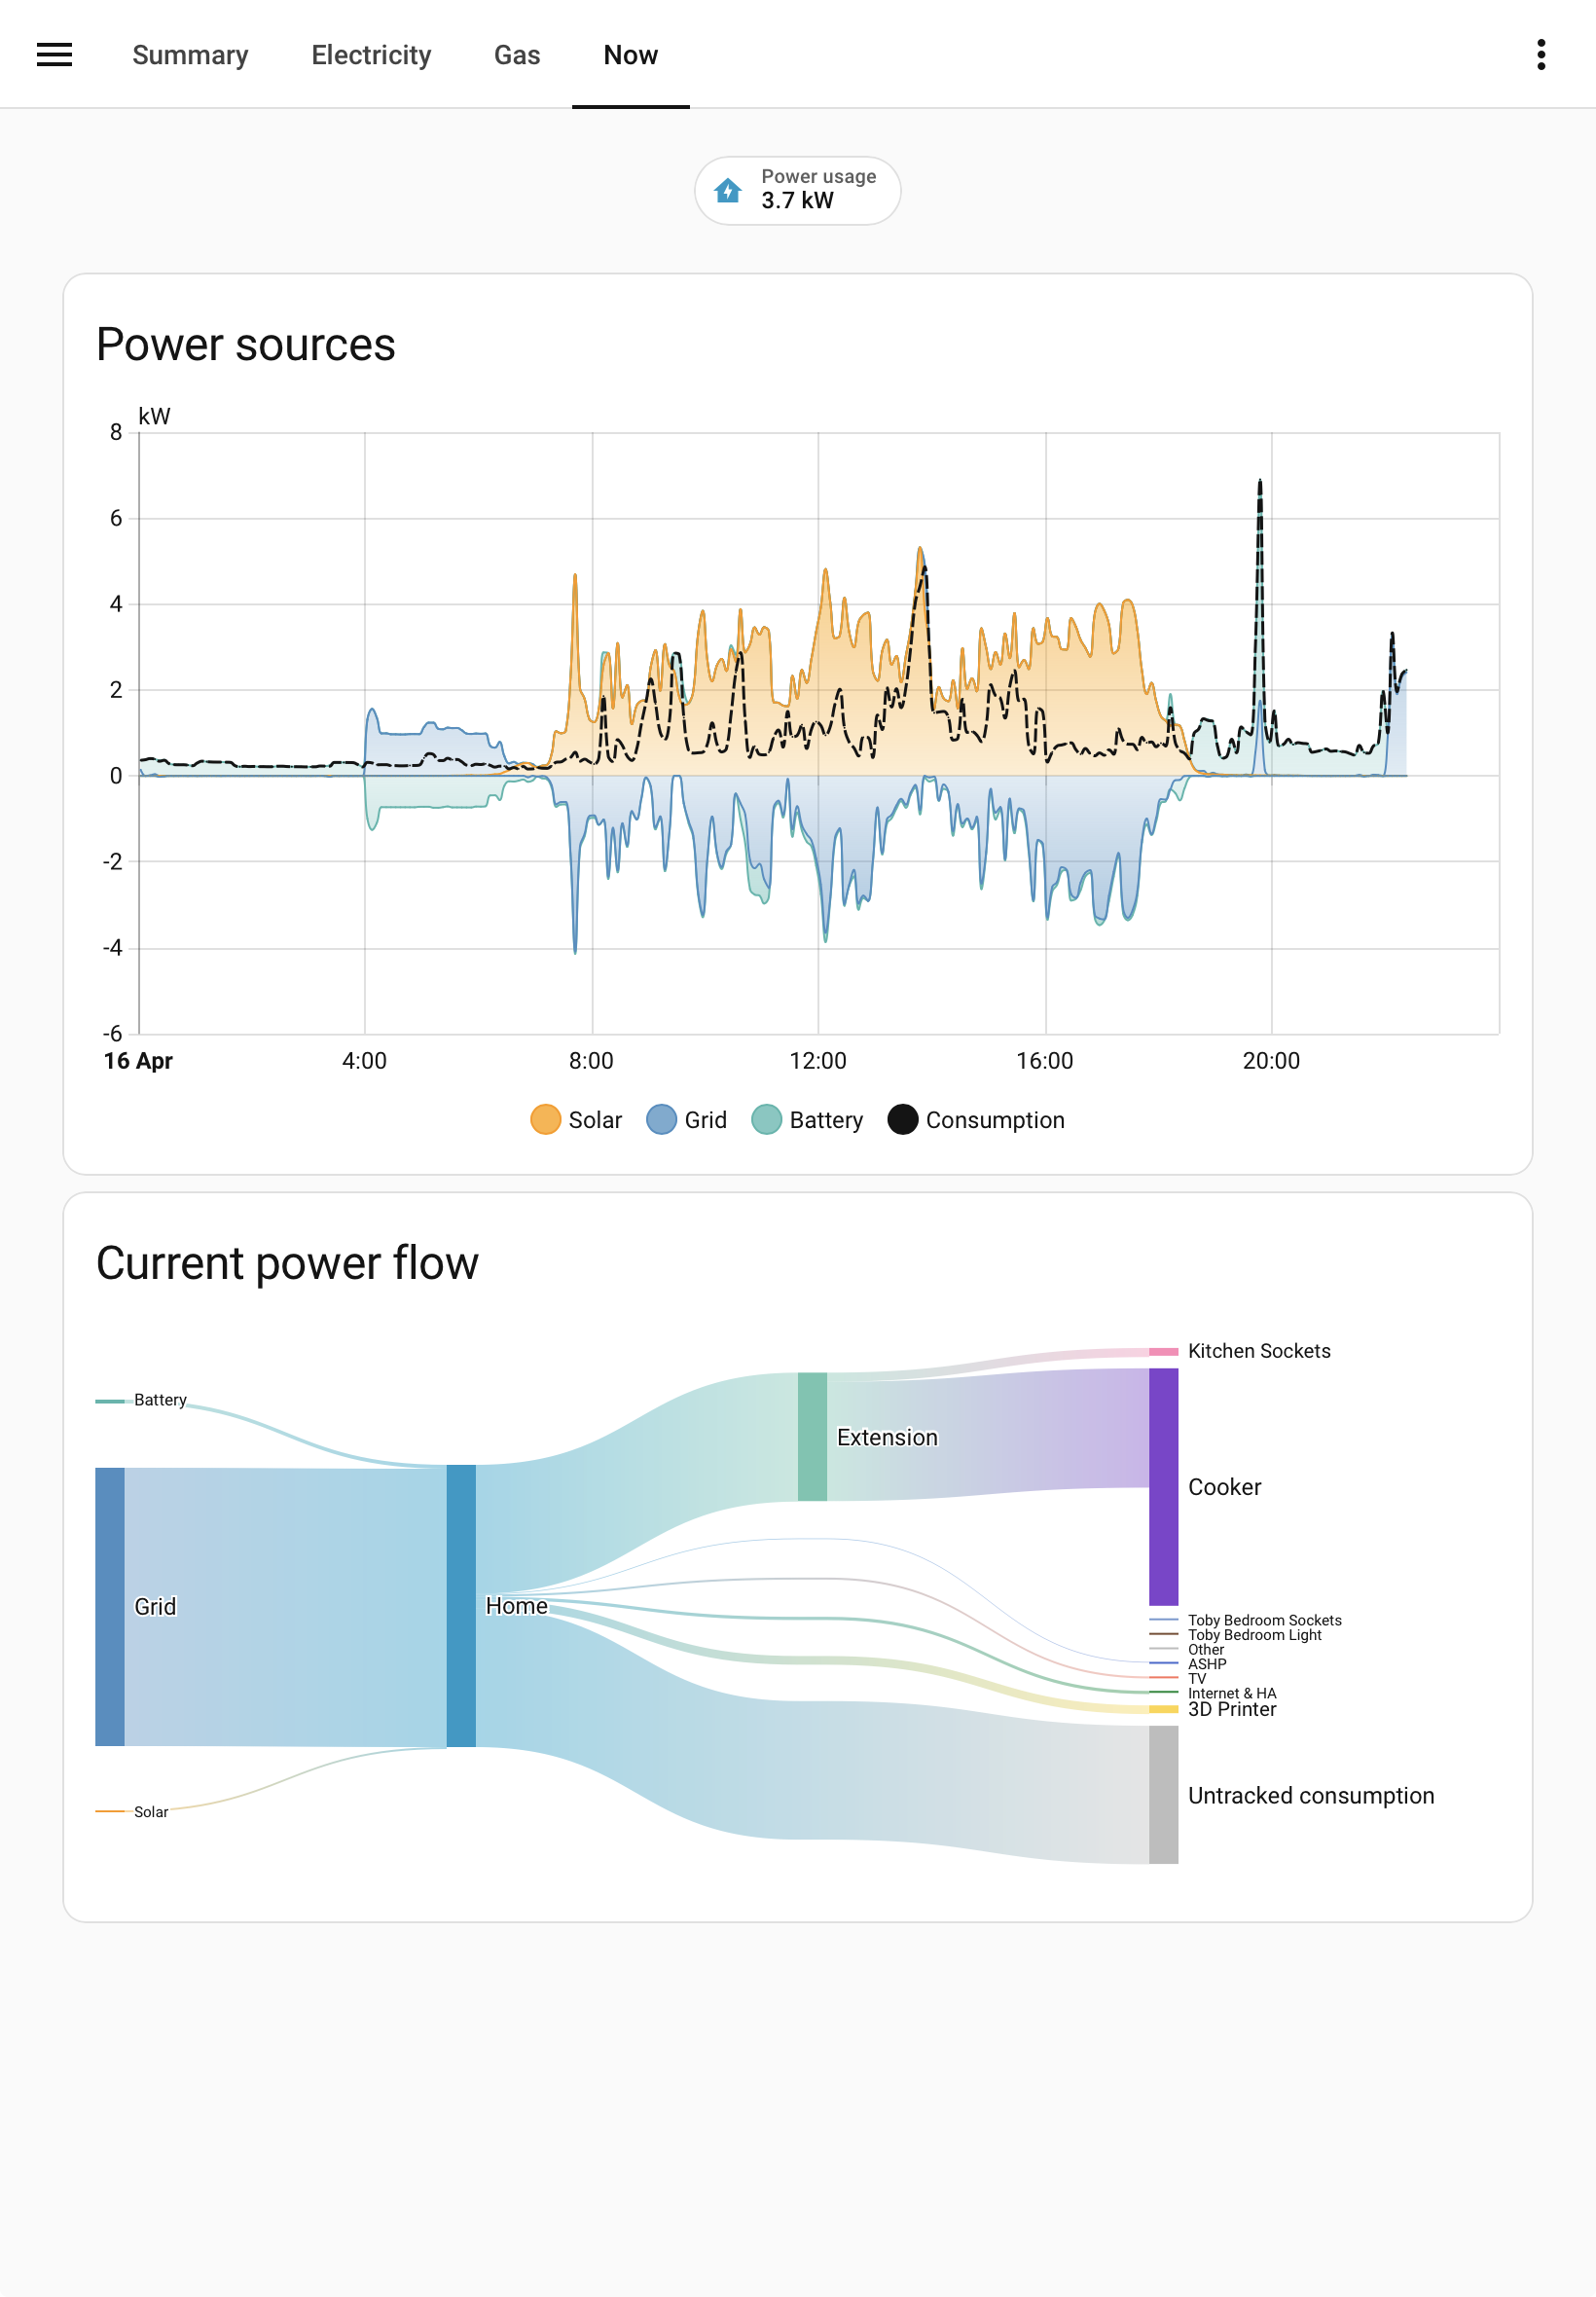
I would also recommend those new to HA to setup the Energy dashboard, its pretty easy to do so with your givtcp sensors, and gives great historical views of energy generation and consumption (and handles multiple inverters and arrays well). The Energy dashboard now includes a ‘now’ power display which gives a similar view, plus you can get a breakdown by device if you have HA monitoring other devices (I use a mixture of smart plugs and Shelly EM’s):

And if you use the Octopus integration which provides Energy rates the Energy dashboard will track your import and export costs as well.

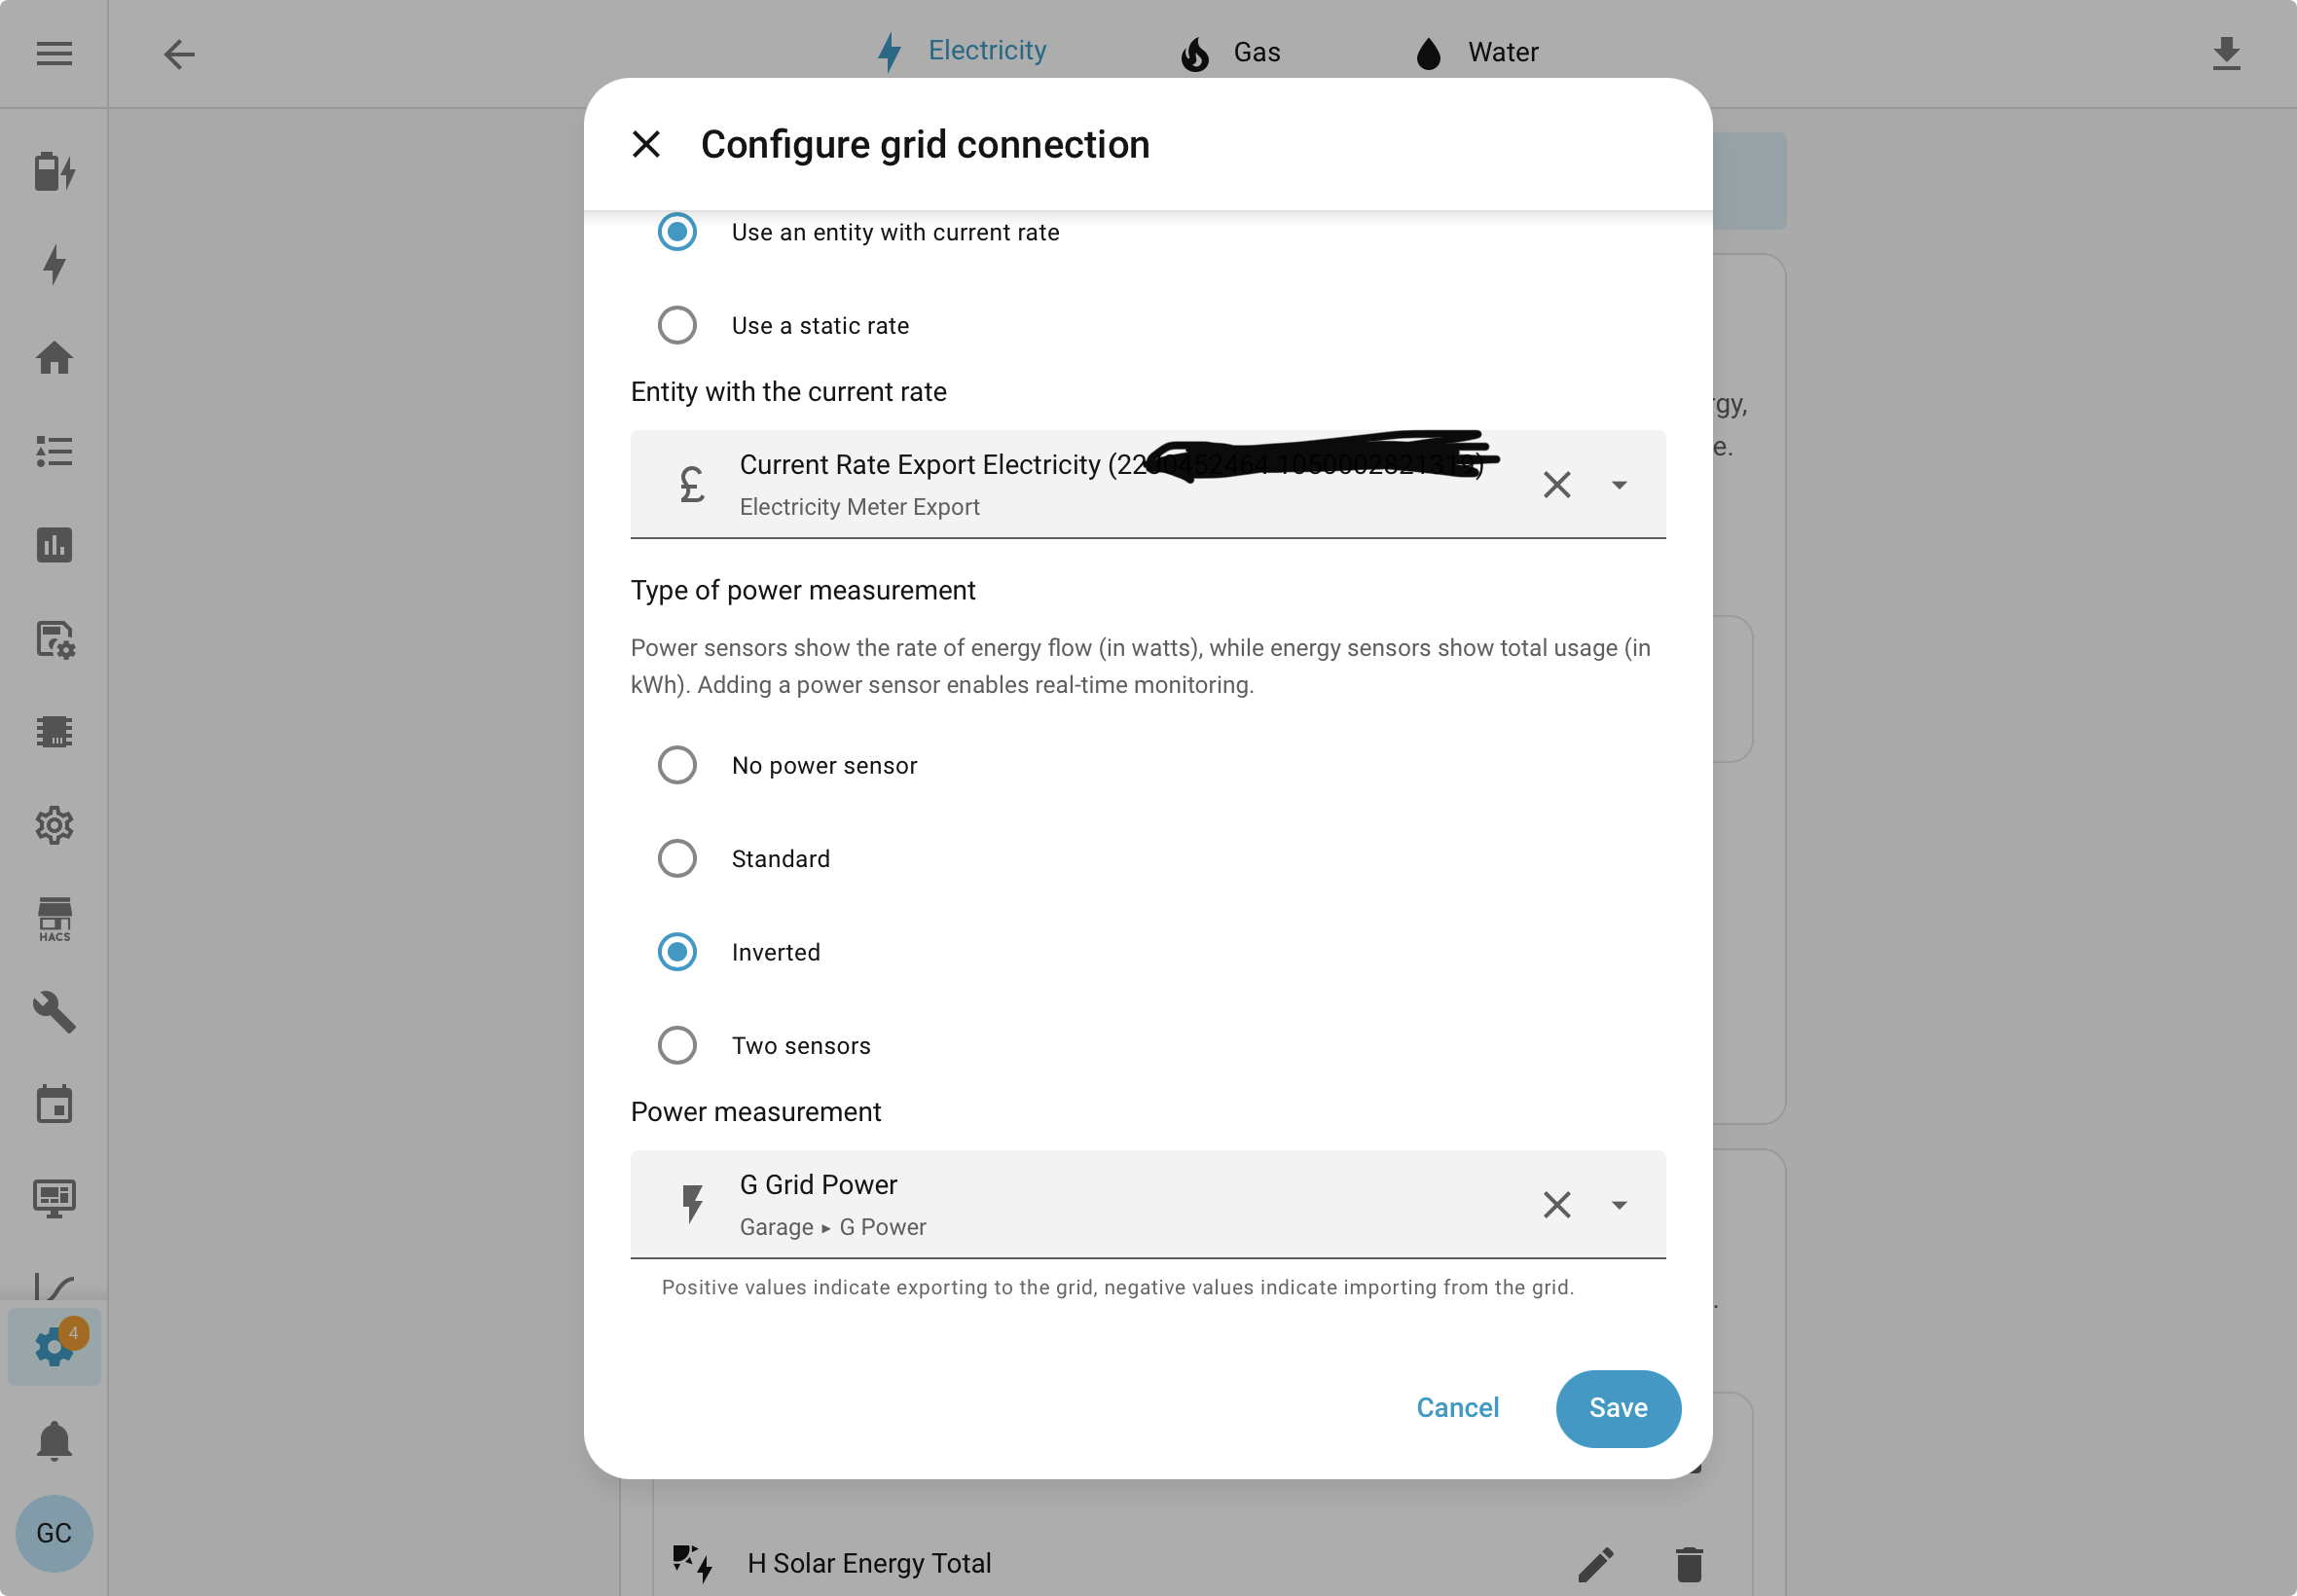
One thing to note though, the GivEnergy grid power sense is the opposite way round to what HA expects so you have to set ‘inverted’ for the grid power:

R
#4 Robgy

I use the ha energy dashboard and use shelly monitors and the octopus integration but I can't figure out what my untracked energy is.

C
#5 Chips78

im 1 week in to home assistant, only possible with speak to the geek videos. Trying pretbat now but i really dont want my now un-warrantied batteries charging and discharging multiple times a night to make an extra 10-20p. I can see the end result would be really cool getting my tado, solar panel and anything else i can get to work on one dashboard but it could be a bit more user friendly.

C
#6 Chips78

ive also turned my max charge and discharge rates down to give the inverter an easier life

G
#7 Guybrush-Threepwood

Chips78 Ive also turned on low power charge and just let it fill its boots in the 5 hours. I do have predbat doing its thing as without it at this time of the year the batteries stay around 70%+ and dont get a good workout.

T
#9 TX200

Chips78 I didn't like this either.

I set an override price in apps.yaml to pretend the overnight export rate is the same price as overnight import.

``rates_export_override:

  • start: '23:30:00'
    end: '23:59:59'
    rate: 3.99
  • start: '00:00:00'
    end: '05:29:59'
    rate: 3.99
  • start: '05:30:00'
    end: '08:59:59'
    rate: 3.99``
G
#10 Guybrush-Threepwood

I also have that. I set the export to zero as I hated how overnight I just wanted a slow charge but it would be constantly fill, empty, fill, emtpy.

I also modified it so it started importing a touch later as it was often exporting down to my reserve and get there a bit early, causing me to draw from the grid for a few mins at peak. This just ensures the nighttime dump happens just before offpeak and then gives me some overlap.

  rates_import_override:
    - start: "00:30:00"
      end: "01:00:00"
      rate_increment: 22

  rates_export_override:
    - start: '00:30:00'
      end: '01:00:00'
      rate_increment: 2
    - start: '01:00:00'
      end: '05:30:00'
      rate: 0.02

My rates_export_override ensures I dont import at that last moment when I want the final dump.

My rates_export_override makes the just before cheaprate look extra tasty before making export during cheap rate totally not what it should do.

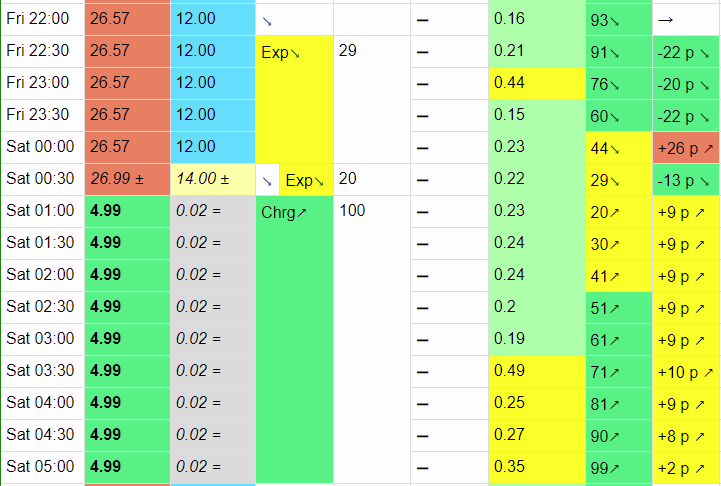
Every night my end of day plan looks like this with a nice soft charge

G
#11 geoffreycoan

Guybrush-Threepwood I also modified it so it started importing a touch later as it was often exporting down to my reserve and get there a bit early, causing me to draw from the grid for a few mins at peak. This just ensures the nighttime dump happens just before offpeak and then gives me some overlap.

If you find that predbat is draining the battery too quickly then this indicates you either have your charge/discharge curves not defined (or wrong), or charge/discharge rates wrong. Or both !

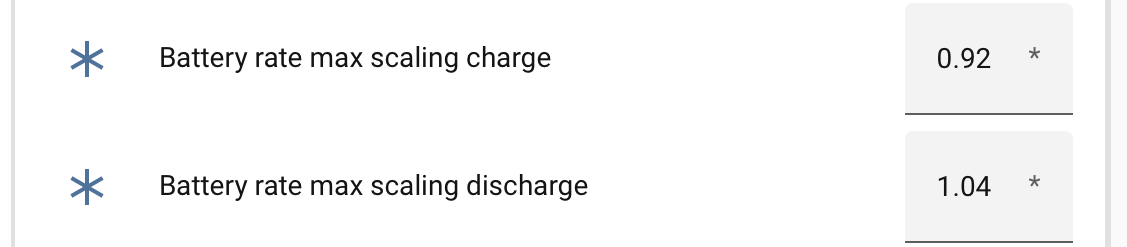
You can get predbat to determine the curves and set them in apps.yaml, the battery charge/discharge scaling controls are also useful

As you have said, several ways to stop predbat from repeatedly charging and discharging overnight. Another option is to change the mode to Control charge overnight and back in the morning.