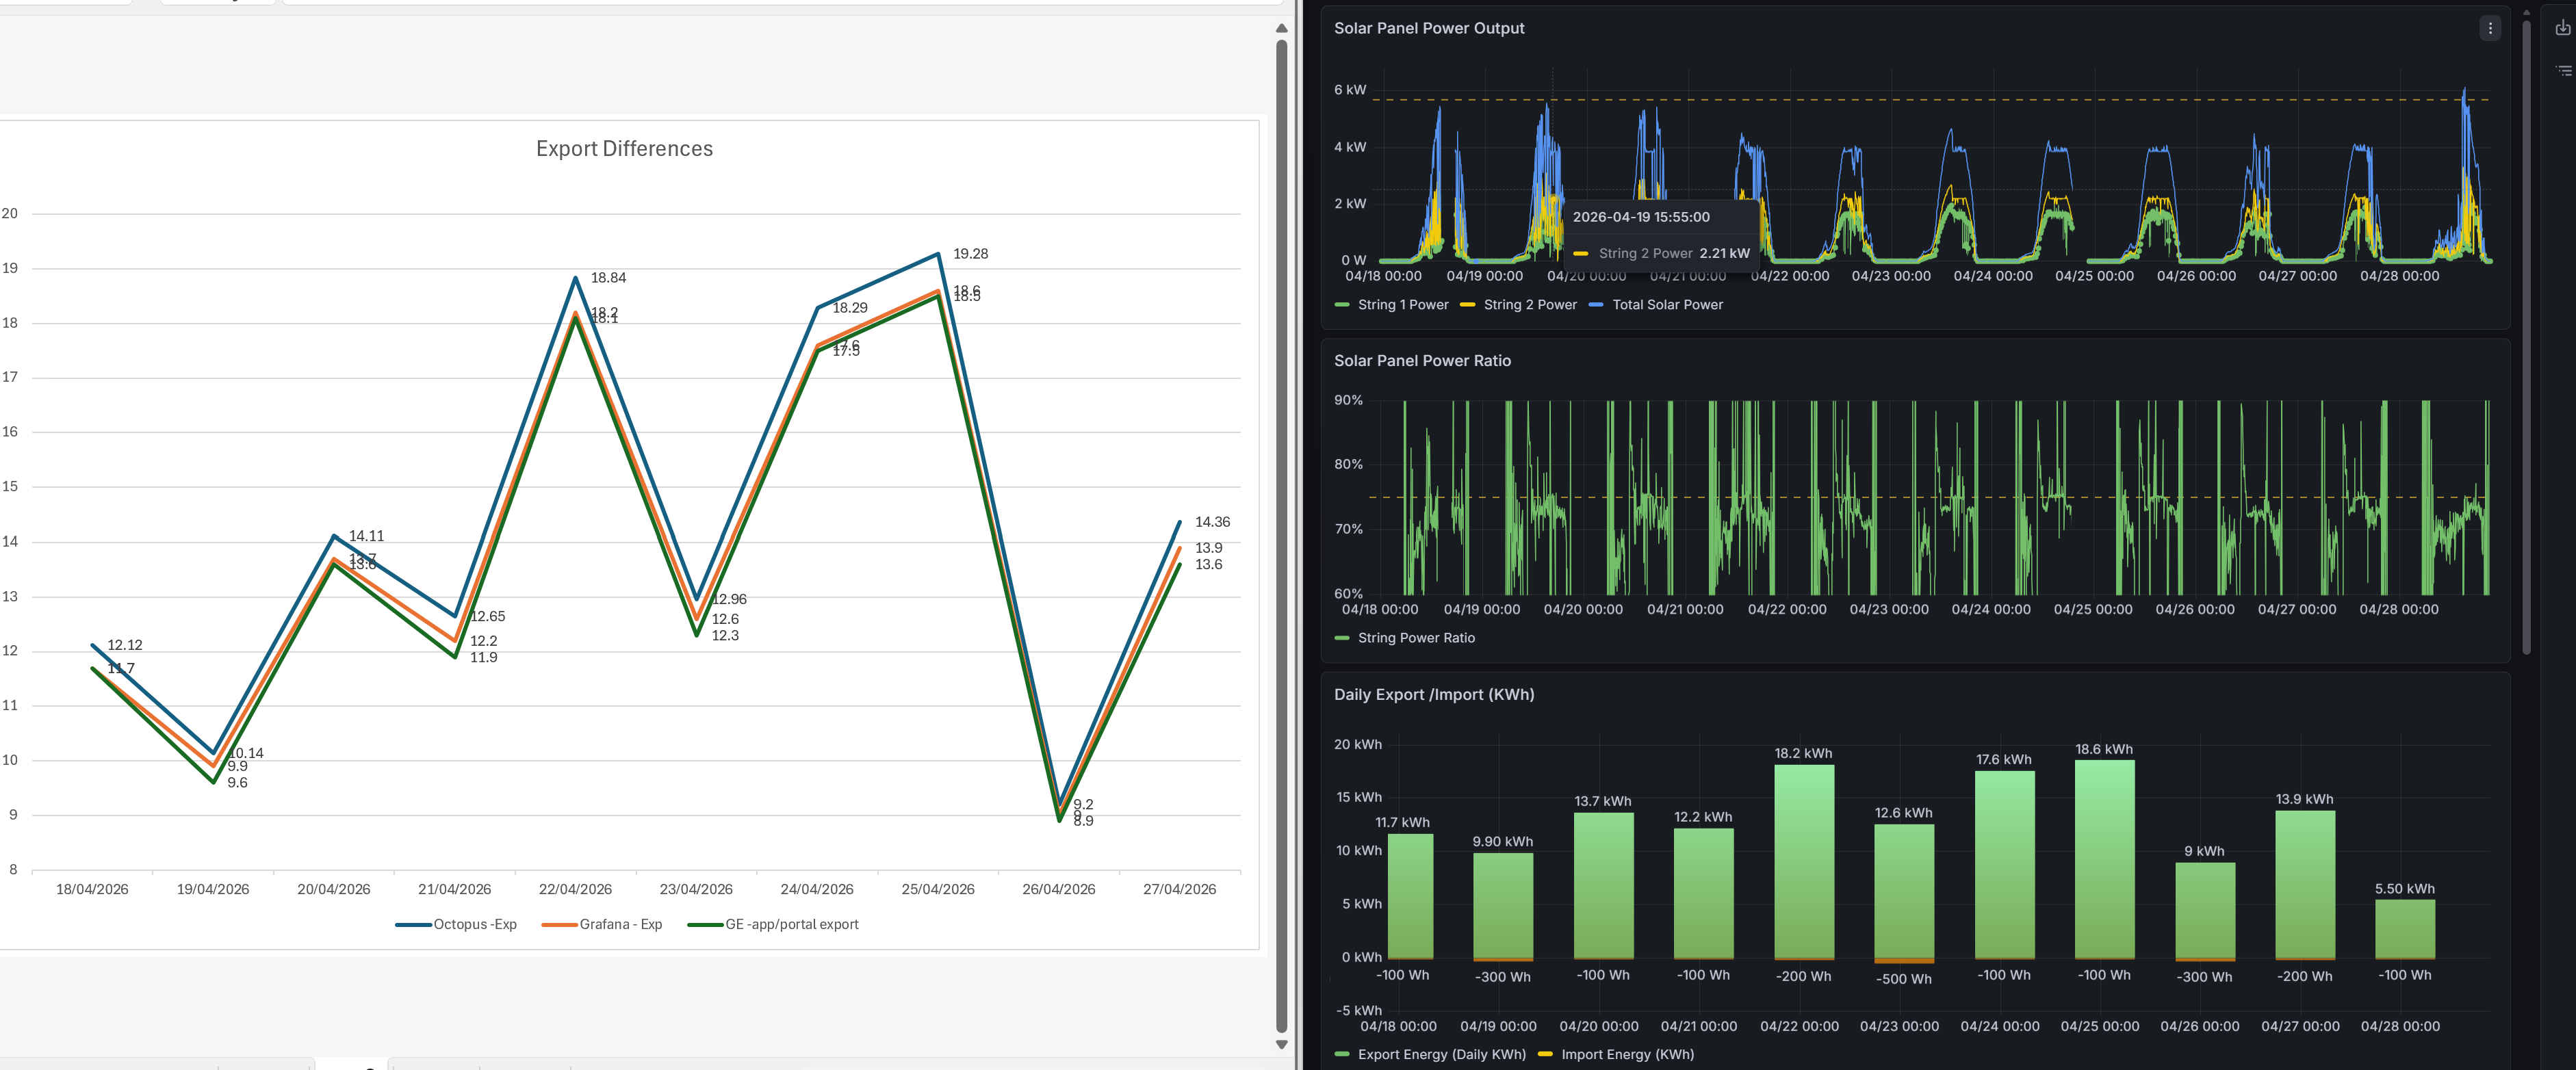
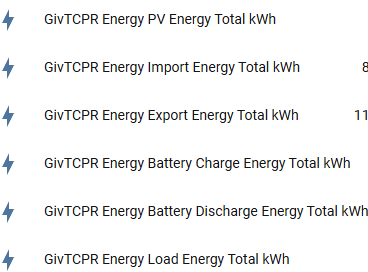
wrighar I used the total export and total import figures, bottom chart and i used this grafana query to generate the top chart (the ge_non_raw_numbers is the measurement name i created in telegraf for the non raw fields in givtcp)
SELECT difference(max("Export_Energy_kWh")) FROM "ge_non_raw_numbers" WHERE $timeFilterGROUP BY time(1d)
SELECT difference(max("Import_Energy_kWh")) *-1 FROM "ge_non_raw_numbers" WHERE $timeFilter GROUP BY time(1d)
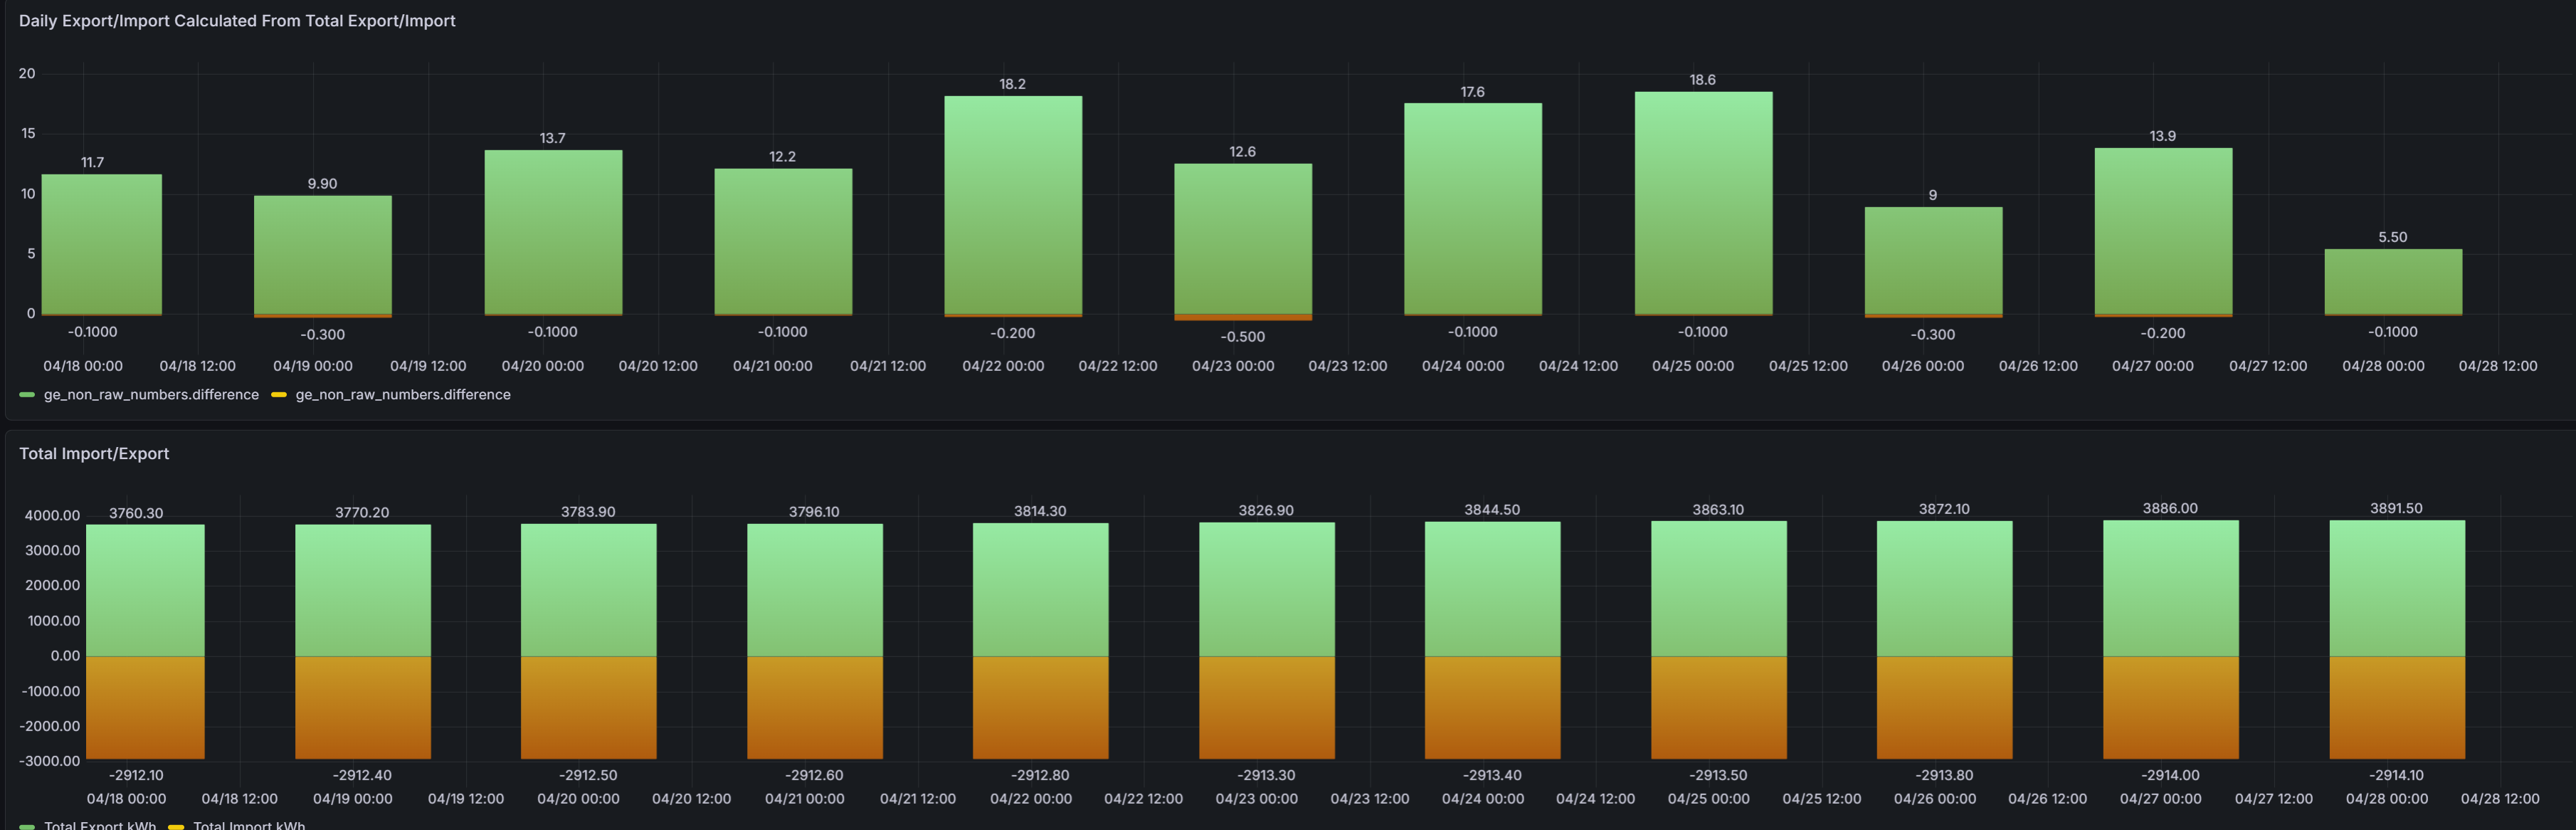
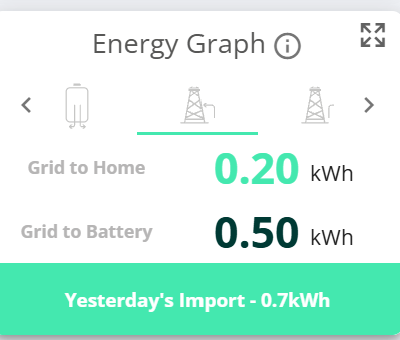
And these calculated values match exactly to the import and export today totals which of course we know in themselves are not completely correct. If you look at the 27th the GE portal says 0.7kWh imported, of which 0.2 is to the home. And you can see that on both the grafana chart and excel graph that the value here matches the grid to home, not the total (taken from the import today total field). I know this is a limited data set. But from what i can see the import today field matches against what the portal shows as daily grid to home total and doesn't include import to battery. And i'd say that the same can be said of the total import energy field.
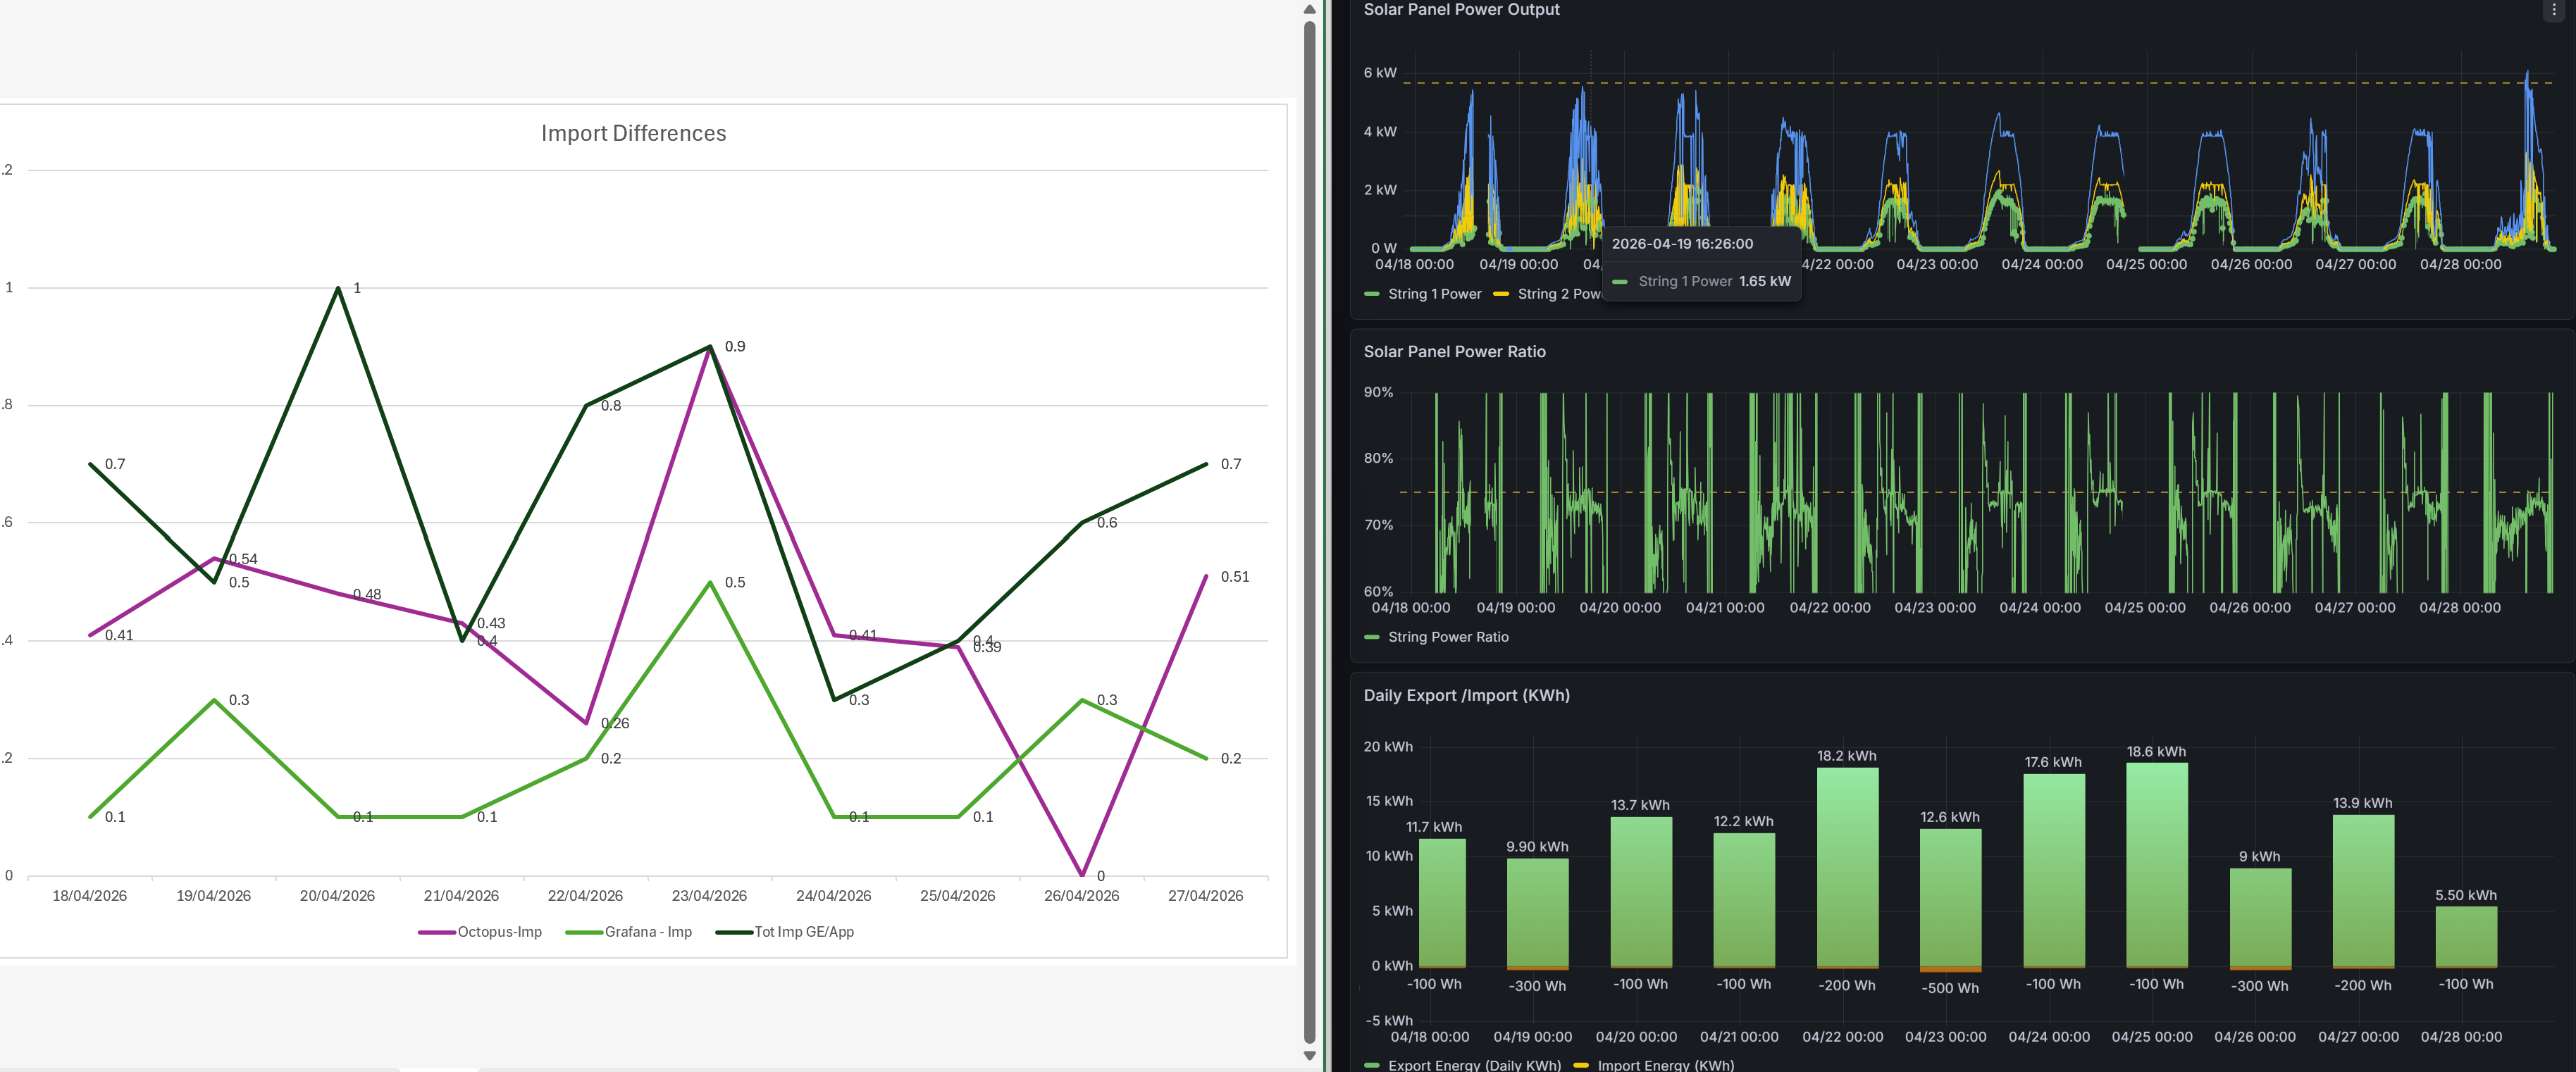
The export totals are not exact but perhaps more consistent (subject to my small data sample). But, i will take the Octopus values here 🙂