
The Seven "GE standard " Datapoints in Home Assistant

9 comments started 2026-05-16 last 2026-05-18
Home Automation
B
#1 BobB

Hi Folks,

I have integrated the seven standard data points provided by GE into my solar spreadsheet:
Solar To Home, Solar To Battery, Solar To Grid, Grid To Home, Grid To Battery, Battery To Home and Battery To Grid

I sum them by month. I like it. I pretend it matters!

Soon, there's a strong chance these stats will no longer be available to me and I'd like to reproduce them in Home Assistant.

Has anyone done this work already and would you be prepared to share the code?

I've started, but it is a lot more complex than might first appear.

For example - Solar to battery. How hard can it be? If the battery's charging and the sun's out then add the charge rate to a utility meter.
But wait...
What if solar is generating more than my battery can consume?, maybe take the minimum of the Battery Charge and PV Generation.
But wait...
What if it's an Octopus freebie session, then some of that charge might be from the grid. I think I just have to ignore this scenario, the solar is going "somewhere" but there's no telling where. I can accept this, but unless I handle it gracefully I'm in danger of double counting because the same situation exists with Solar to House. So only one of these Utility Meters should take the solar kW during this scenario.

Someone here will already have thought all this through and could save me the headache.

Any generous, brainy folk out there?

Thanks all.
B
#2 BobB

Hi Folks,

Without wishing to look too much like a d*ck, I've had a go. I think I'm close. This is how I've generated the sensors (these are all using sensor templates that then go into utility meters). Sorry about the dots, it's the only way I could format it.

Sensor.............................Formula
Solar to Battery...........Minimum of Battery Charge and PV Generation
Grid to Battery.............Battery Charge - Solar to Battery
Solar to Grid.................Export Energy
Solar to Home.............PV Generation - Solar to Battery - Solar to Grid
Battery to Home.........Battery Discharge - Export Energy
Battery to Grid.............Battery Discharge - Battery to Home
Grid to Home...............Load - Solar to Home - Battery to Home

I think my logic is correct and I've caught any double counting possibilities. I'll check it for a few days for correctness.

If anyone wants the underlying code, let me know.

G
#3 geoffreycoan

BobB I know you don’t want to let go of your existing spreadsheet, but these energy numbers are a bit made up by the inverter.

Personally I never look at them and don’t use the power sensors that givtcp provides (I think these are what the portal uses to approximate the energy sensors you see, but probably does it on a 5 minute data sample).

You could probably get sensors that do what you want by doing a Riemann integral on the power sensors (sensor.givtcp_xxx_solar_to_battery etc) to convert them to an energy sensor. This would be more accurate than the way the portal does it.

But as I said, I don’t look at this data. I look at total grid import, total solar generation, total house load, all of which I get from the energy dashboard.

B
#4 BobB

Cool. Thanks Geoffrey. (Yes. I was looking at you when I started this thread!) I did see the HA Riemann integral function and I can see it's probably better. But it looked more complicated. My query interval is 30s I reckon if it was shorter, the integral function would improve further. I'm reluctant to do anything that adds more load to the inverter though.

I might try the integral as well and compare the two datasets. It'll be a useful learning exercise and might help inform me on the accuracy of my original attempt.

Thanks again.

W
#5 wrighar

Most the numbers are guesses fr specific to specific.

You can only really state 'home used', 'solar generated' 'Grid import' 'grid export', 'battery charge' and 'battery discharge'

You have no way of knowing things like solar to battery really... it's just energy provided to either home of grid.
likewise solar goes to battery, home and grid.

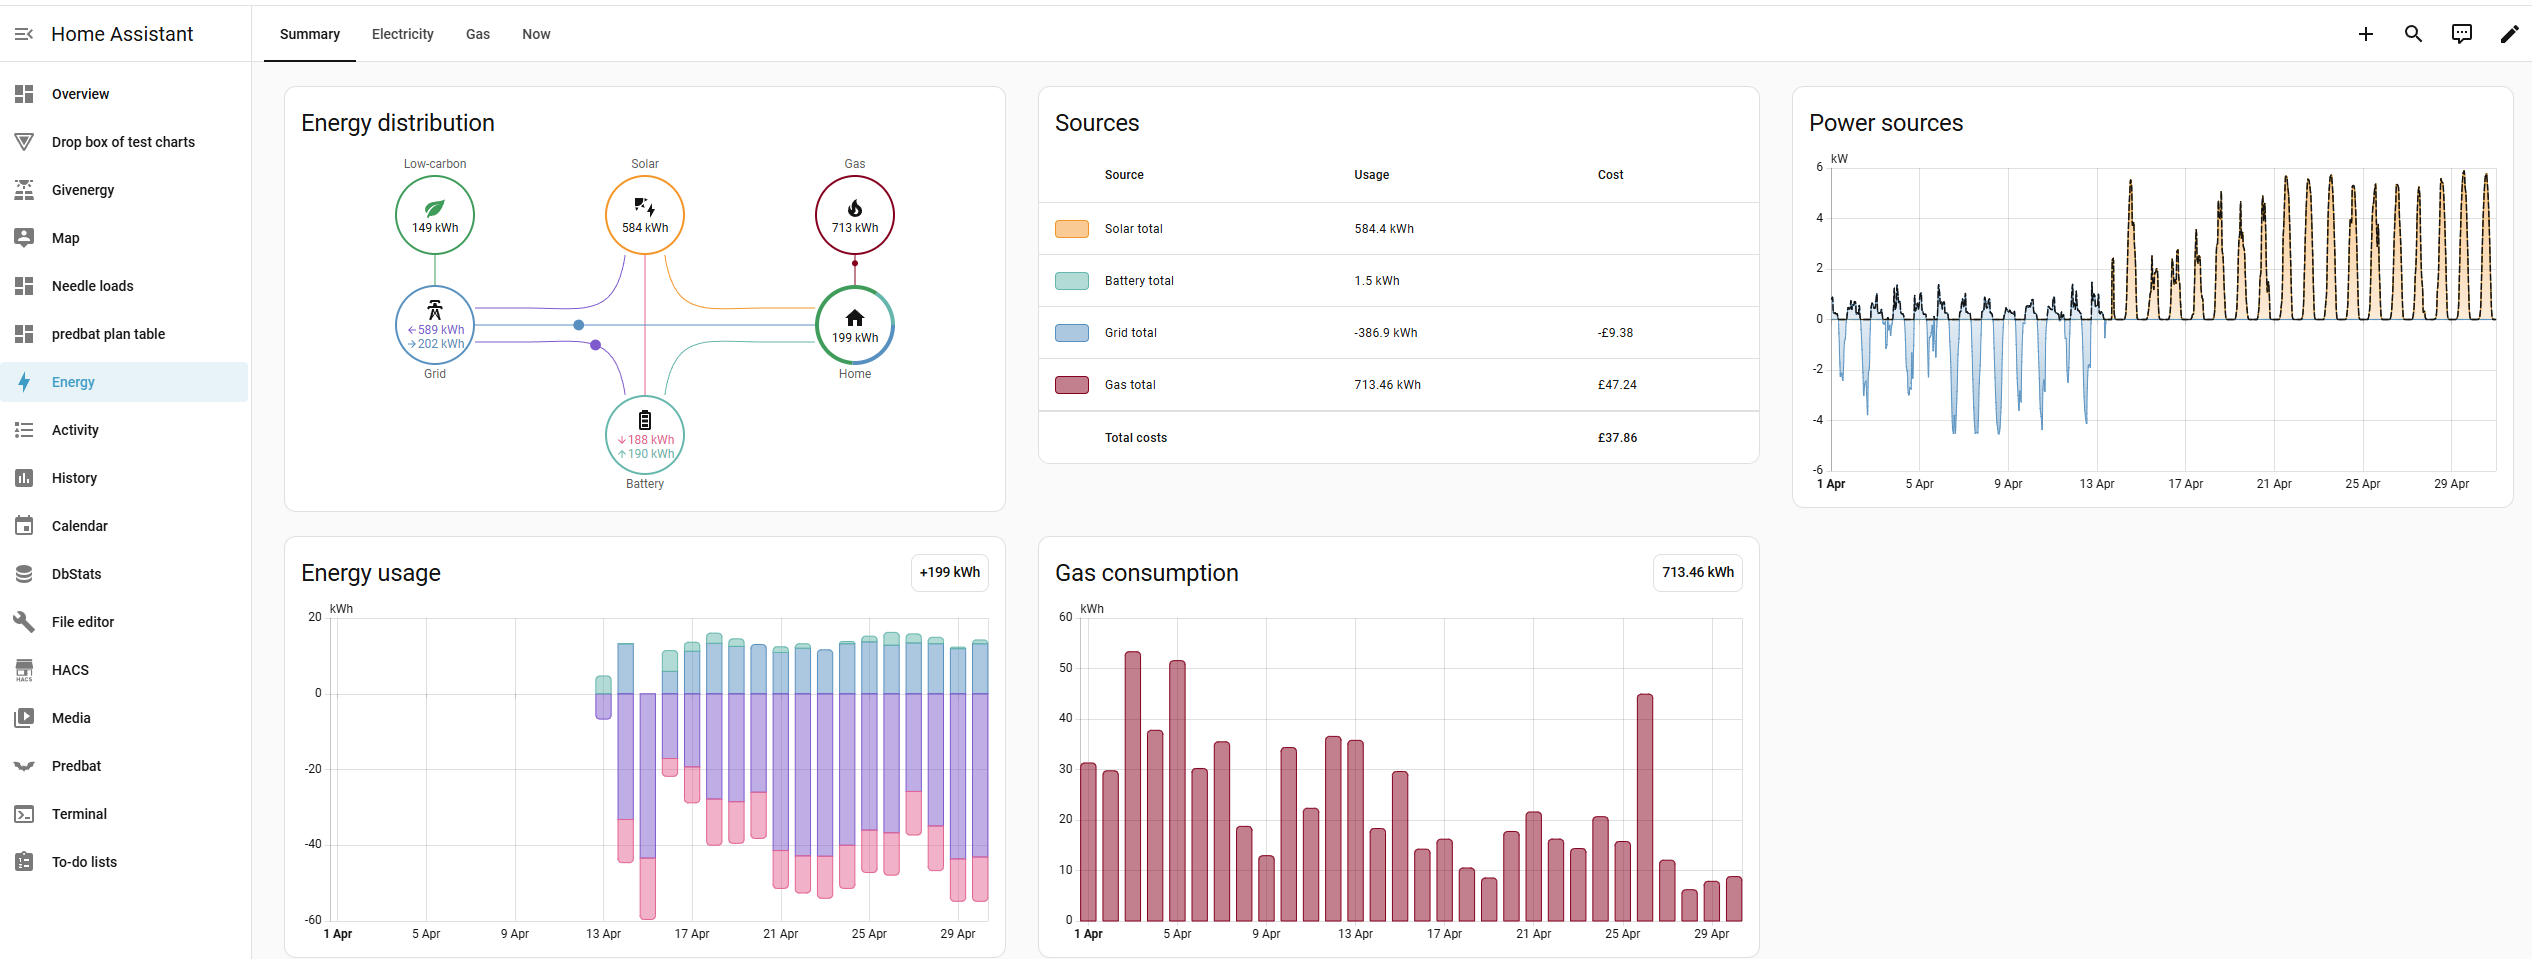
The default 'Energy' tab in HA offers a good monthly summary This was my 'April' (new inverter on the 13th) :

D
#6 DD

BobB consider the case PV=1kW and battery discharge is 1kW (eg forced discharge), with consumption=0.5kW and export=1.5kW.

Or PV=0, forced discharge=2kW, export=1.5kW

What's 'load' in grid to home ?

B
#7 BobB

wrighar , DD
Thanks. And I get it. If two sources are providing power, you cannot tell what's going where. I suppose the most obvious answer is to split the inputs by ratio, ie if PV is generating 1kW, the battery is outputting 2kW, and the house only requires 0.5kW, then the PV generated (1/(1+2)) * 0.5kW and the battery supplied (2/(1+2)) * 0.5kW.

But it's far worse than that. As Geoffrey points out, I only have sample points of data at 30 second intervals. It's all rubbish.

... But it's my rubbish 🙂 And I want to get as close to the GE supplied stats as possible so I can continue with the same spreadsheet as I started when I got the system.

wrighar "Load" in Grid to Home is the house energy requirement, so my attempt of the maths is: Grid to home = the grid supplies what the house needs minus what solar provides minus what the battery provides.

R
#8 Rtidey

I used to get monthly statistics via the api and used my scripts (https://github.com/roberttidey/GivEnergyScripts) to process them into spreadsheet format.

Although, there are some drawbacks as pointed out, I still found them useful to estimate cost savings and there were close to some of the equivalent data from my Octopus account.

I no longer have the access to the api as I am not subscribing. I have replaced all the functionality by HomeAssistant.

This works very well and in many cases better. One small example being the forced charge / forced import functions which now offer a range of timed intervals from 2 minues to 3 hours.

For the statistics side. I have added in export statistics functionality to Home Assistant and have added a python program to translate the output into files compatible with the previous api versions. Details are in the github.

The statistics obtained this way are close (1%) to the original api versions.

B
#9 BobB

Rtidey Nice. Thanks Robert.
I've already used your python scripts to download my data and check against the (sometimes wobbly) data from the portal.

I'll definately check out the import_statistics integration.