Daily Sustained Spikes in App

6 comments started 2022-11-04 last 2022-11-05
Mobile AppGivEnergy ProductsHybrid
A
#1 ap2u

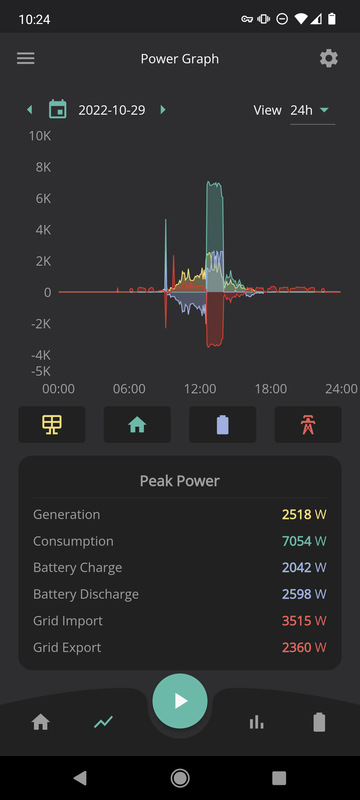
I have a new installation that hasn't been put on a SEG tariff yet. I have noticed a daily spike in consumption for roughly the same period in the app. The smart energy meter doesn't show anything near the same consumption figures and I am 99% sure there isn't anything in the house that is actually consuming, I've made sure that all the usual high consumption devices are off before and still had the same behaviour to roughly the same level 6kW.

Here are 2 examples from the last few days:
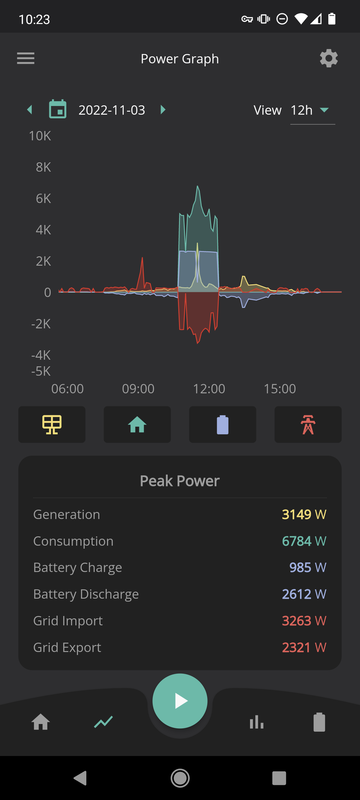
Here and Here

I have a 4400kWh PV install with the G2 3.6kW inverter and 2x G2 2.6kWh batteries.

Any help would be appreciated
#2 THALL

Nearly 7kw is much higher than that inverter can ask for. The CT clamps will only monitor power coming over those cables. Any neighbors leaching off your power? Very odd.

R
#3 Rubikcube

Profile looks like an EV charger.

T
#4 Tim

ap2u 4400kWh

Call me a pedant, I suspect this is either 4400Wp or 4.4kWp. The p is "peak" meaning that it's the most you would get out given perfect conditions.

@Rubikcube nice spot! Does look like either an EV or a teenager using the electric shower first thing in the morning.

A
#5 ap2u

@Tim @Rubikcube No EV chargers or electric showers in the house

Having a read of other posts in the forum, I figured I would check the CT clamp configuration seeing as mine was openly accessible. After a lot of trial and error, I figured out that not only was it fitted facing the wrong way, but was also on the wrong lead between the DB and the junction box that splits out to the inverter and OB115. I've fitted it properly now between the meter and the splitter with the arrow pointing in the direction of the inverter (or away from the meter).

All the data in the app now seems to make sense!

Thanks all for suggestions

T
#6 Tim

ap2u As you say, it all makes sense. Note to self: "Phantom teenager syndrome looks the same as a CT the wrong way round".