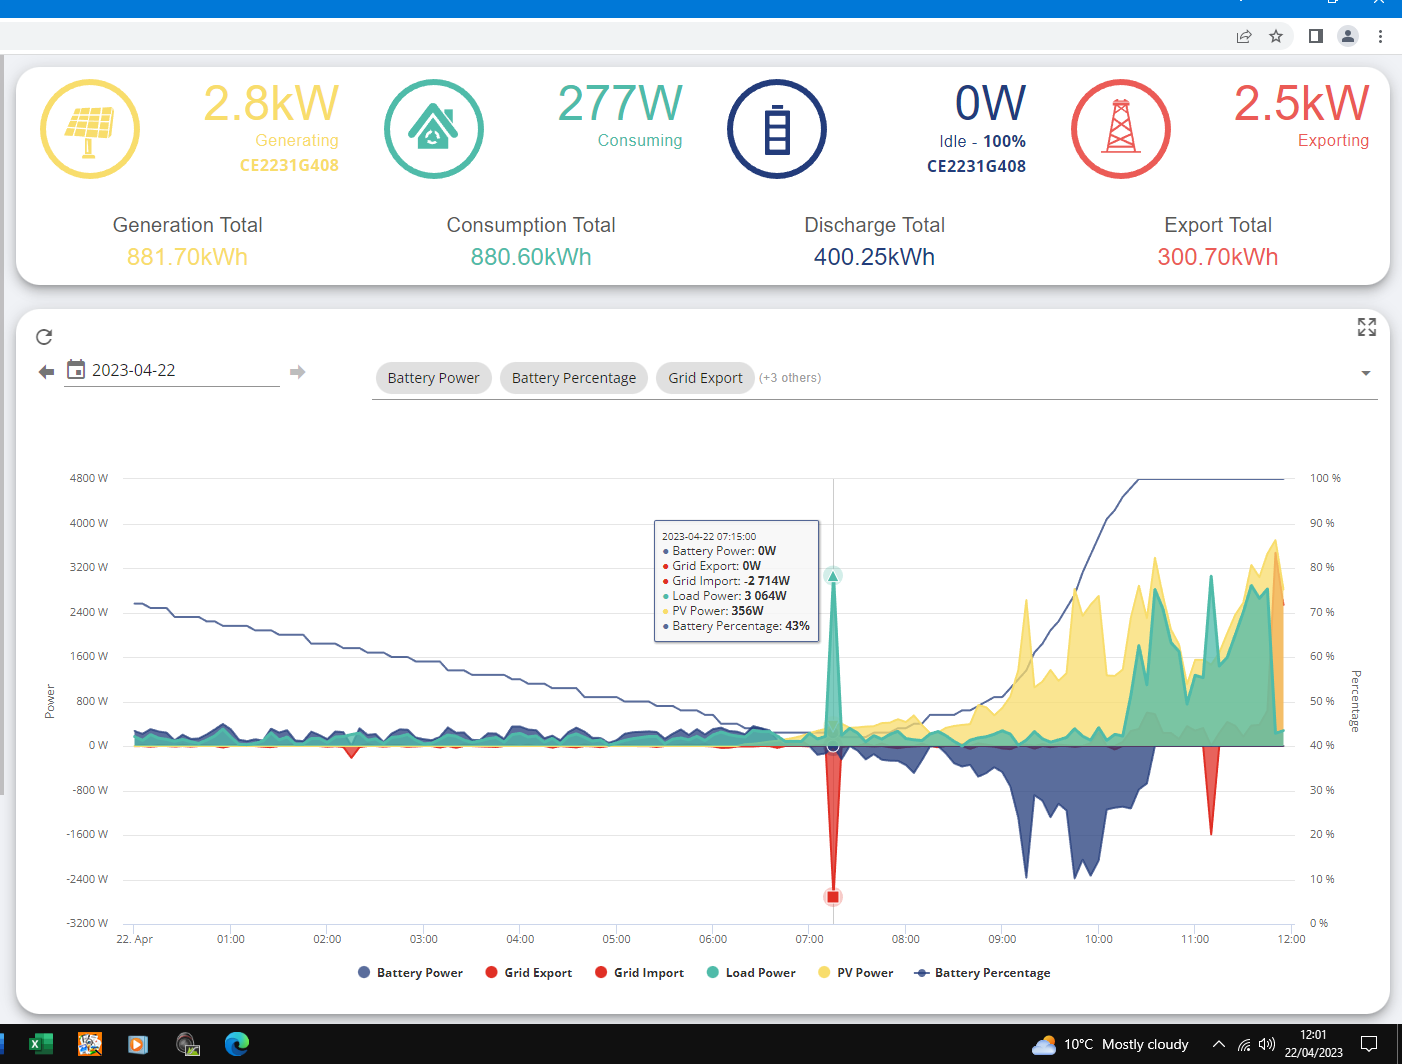
I suspect those brief imports are where the system is settling (when a kettle or similar was switched on) - and they happened to coincide with the 5 minute 'snapshot' sample, taken for the portal. These usually only last 10-30 seconds and are quite normal.
If they last much longer than that, then there may be an issue, but on the above evidence I doubt it.
What was the total amount of energy imported during that day?
(Conversely, I boiled the kettle this morning, and it did not register on this graph at all, as it all happened between two samples - it's just down to chance. Once you understand that the graph is made up of 5 minute samples - ignoring what happens between them - then it becomes more understandable. You would think that plotting a graph like this would be simple, but actually it is much more complicated than it might seem. You could get it to use some averaging, but that would show values lower than reality. Or you could show a peak value, but that would over-report reality).