Wildly inaccurate AIO readings for Generation

19 comments started 2023-09-04 last 2023-09-23
Cloud PortalGivEnergy ProductsAC Coupled
B
#1 Barns

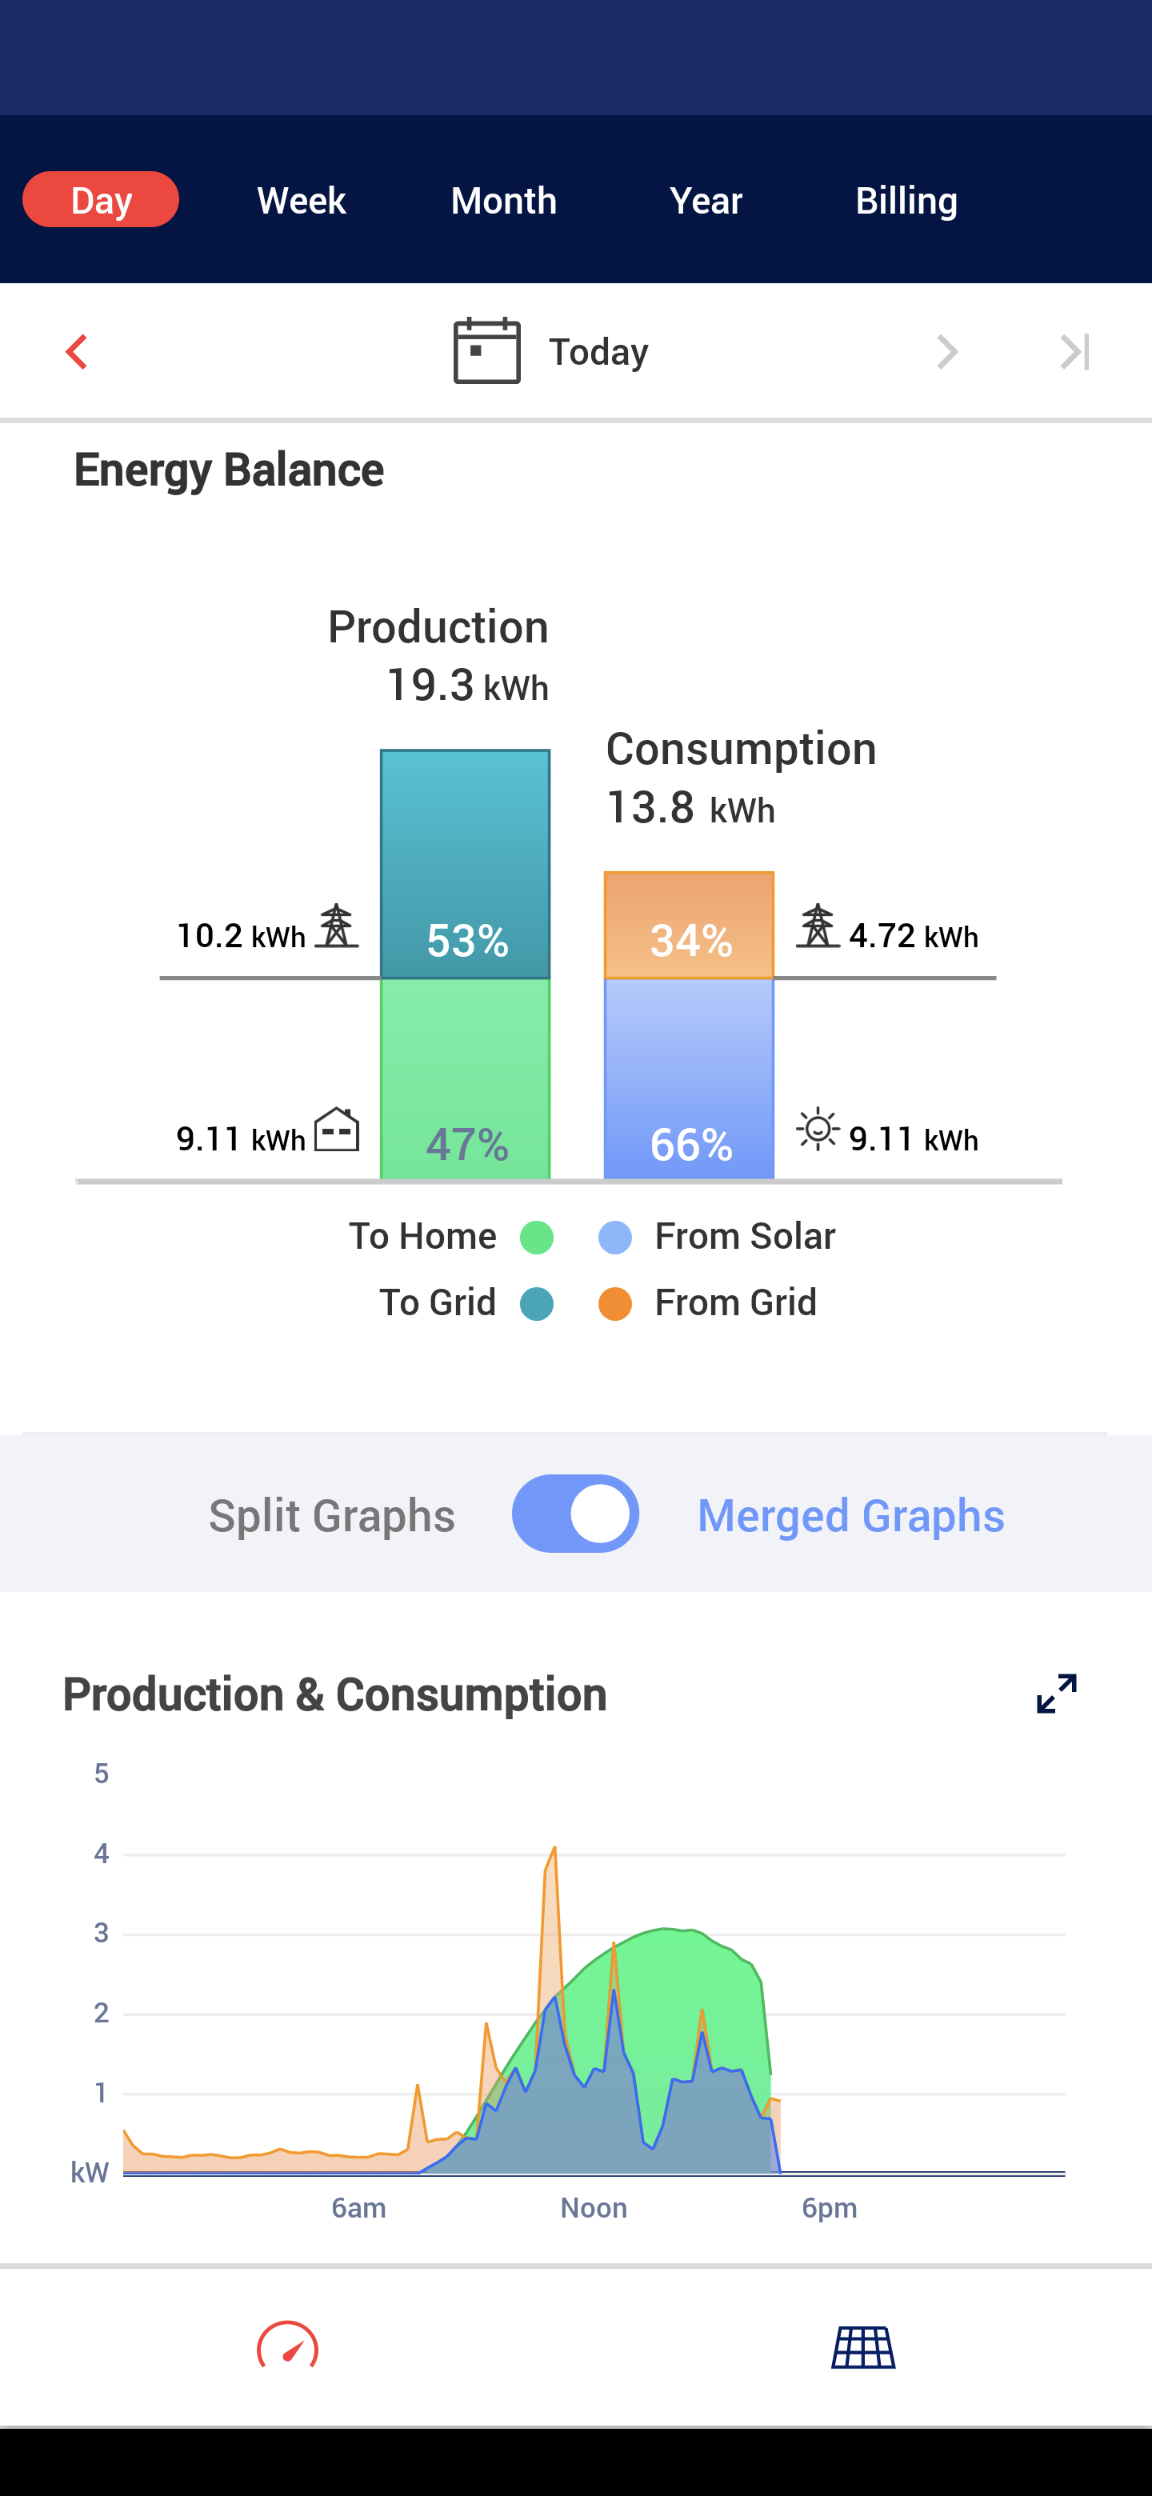
Hi, has anyone else got hugely inaccurate (like less than 50% of what they should be) readings for solar generation from their AIO on the app and cloud site? For example today my SolarEdge inverter reports it's generated 19.3kWh so far but the GE app only says a total of 9.31kWh split across generation to home, battery and grid.
I'm inclined to believe the SolarEdge inverter figure as that also tallies with the generation meter and so forth and has been reliable for years. I'm can't believe the huge inaccuracy is due to CT clamps sampling rate or whatever. I think it must be a software bug somewhere. This is consistent pretty much every day. And I've not seen connection drops for the AIO either so don't think that's causing it.
Edit: the numbers that look wrong are on the Energy Graph. The solar generation curve on the Power Graph looks correct, as in it matches the one from the SolarEdge portal completely. Which is why I suspect there's a bug in how the Energy Graph numbers are being calculated since the raw data on the Power Graph looks correct (and I assume this data is where the half hourly totals on the Energy Graph come are calculated from).

B
#3 Barns

Jellybaby Hi, yes, I've seen that thread and have seen missing data some days but this issue of the Generation data is different I think; I've got no gaps in data for today for example, no connection drops, all the data is there but it just looks calculated incorrectly. Two separate issues I believe.

J
#4 Jellybaby

Barns Like this?

btw before solar system was installed our home usage was between 13-16kwh daily (I know the AIO+Gateway adds 2-4kw daily)

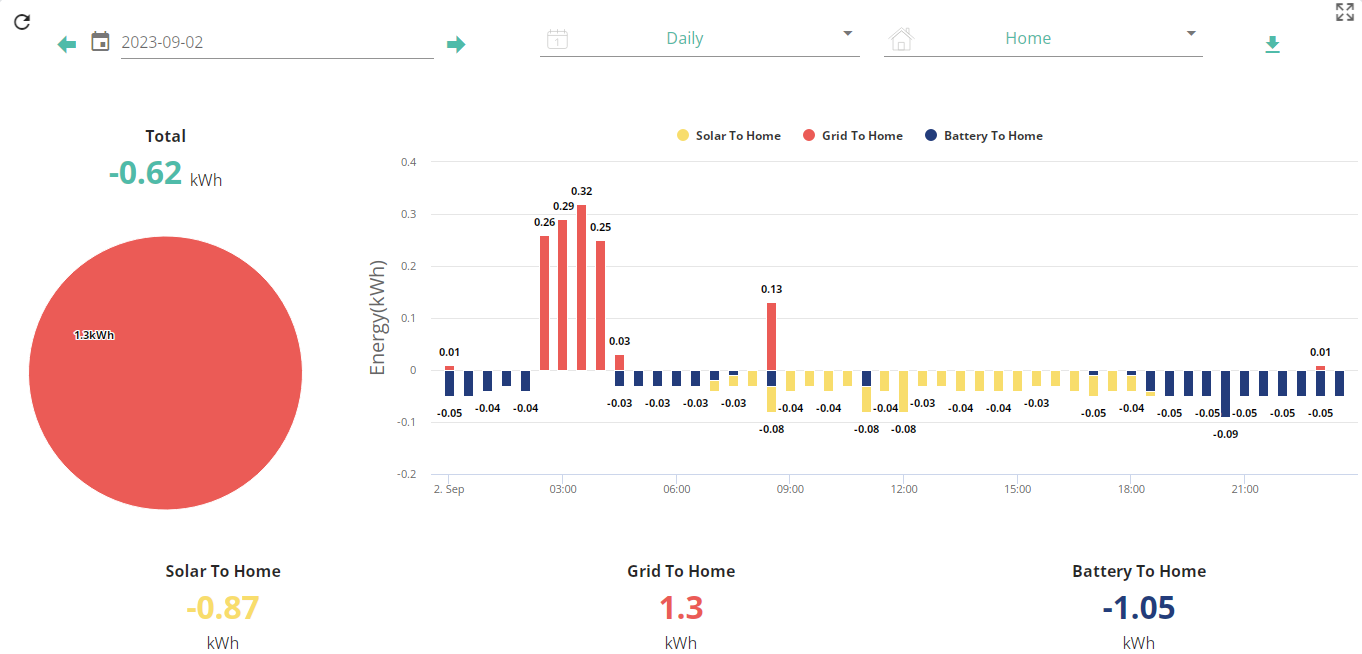
House load at night is around 300w til the fridge/freezer kicks in but battery drain is around 80-150w higher than house but the red spikes are when I draw 3.6kw from grid every night (I spread out the draw as to not generate more heat than necessary)

Solar to home is way off, grid to home is off because with 300w minimum draw those figures are way off and battery to home is definitely off unless 40% of a 13.5kwh battery is around 1kwh

All this is on LAN connection now, has been for a while.

B
#5 Barns

Jellybaby these are the sorts of issues I'm seeing, if I can get images linked in:

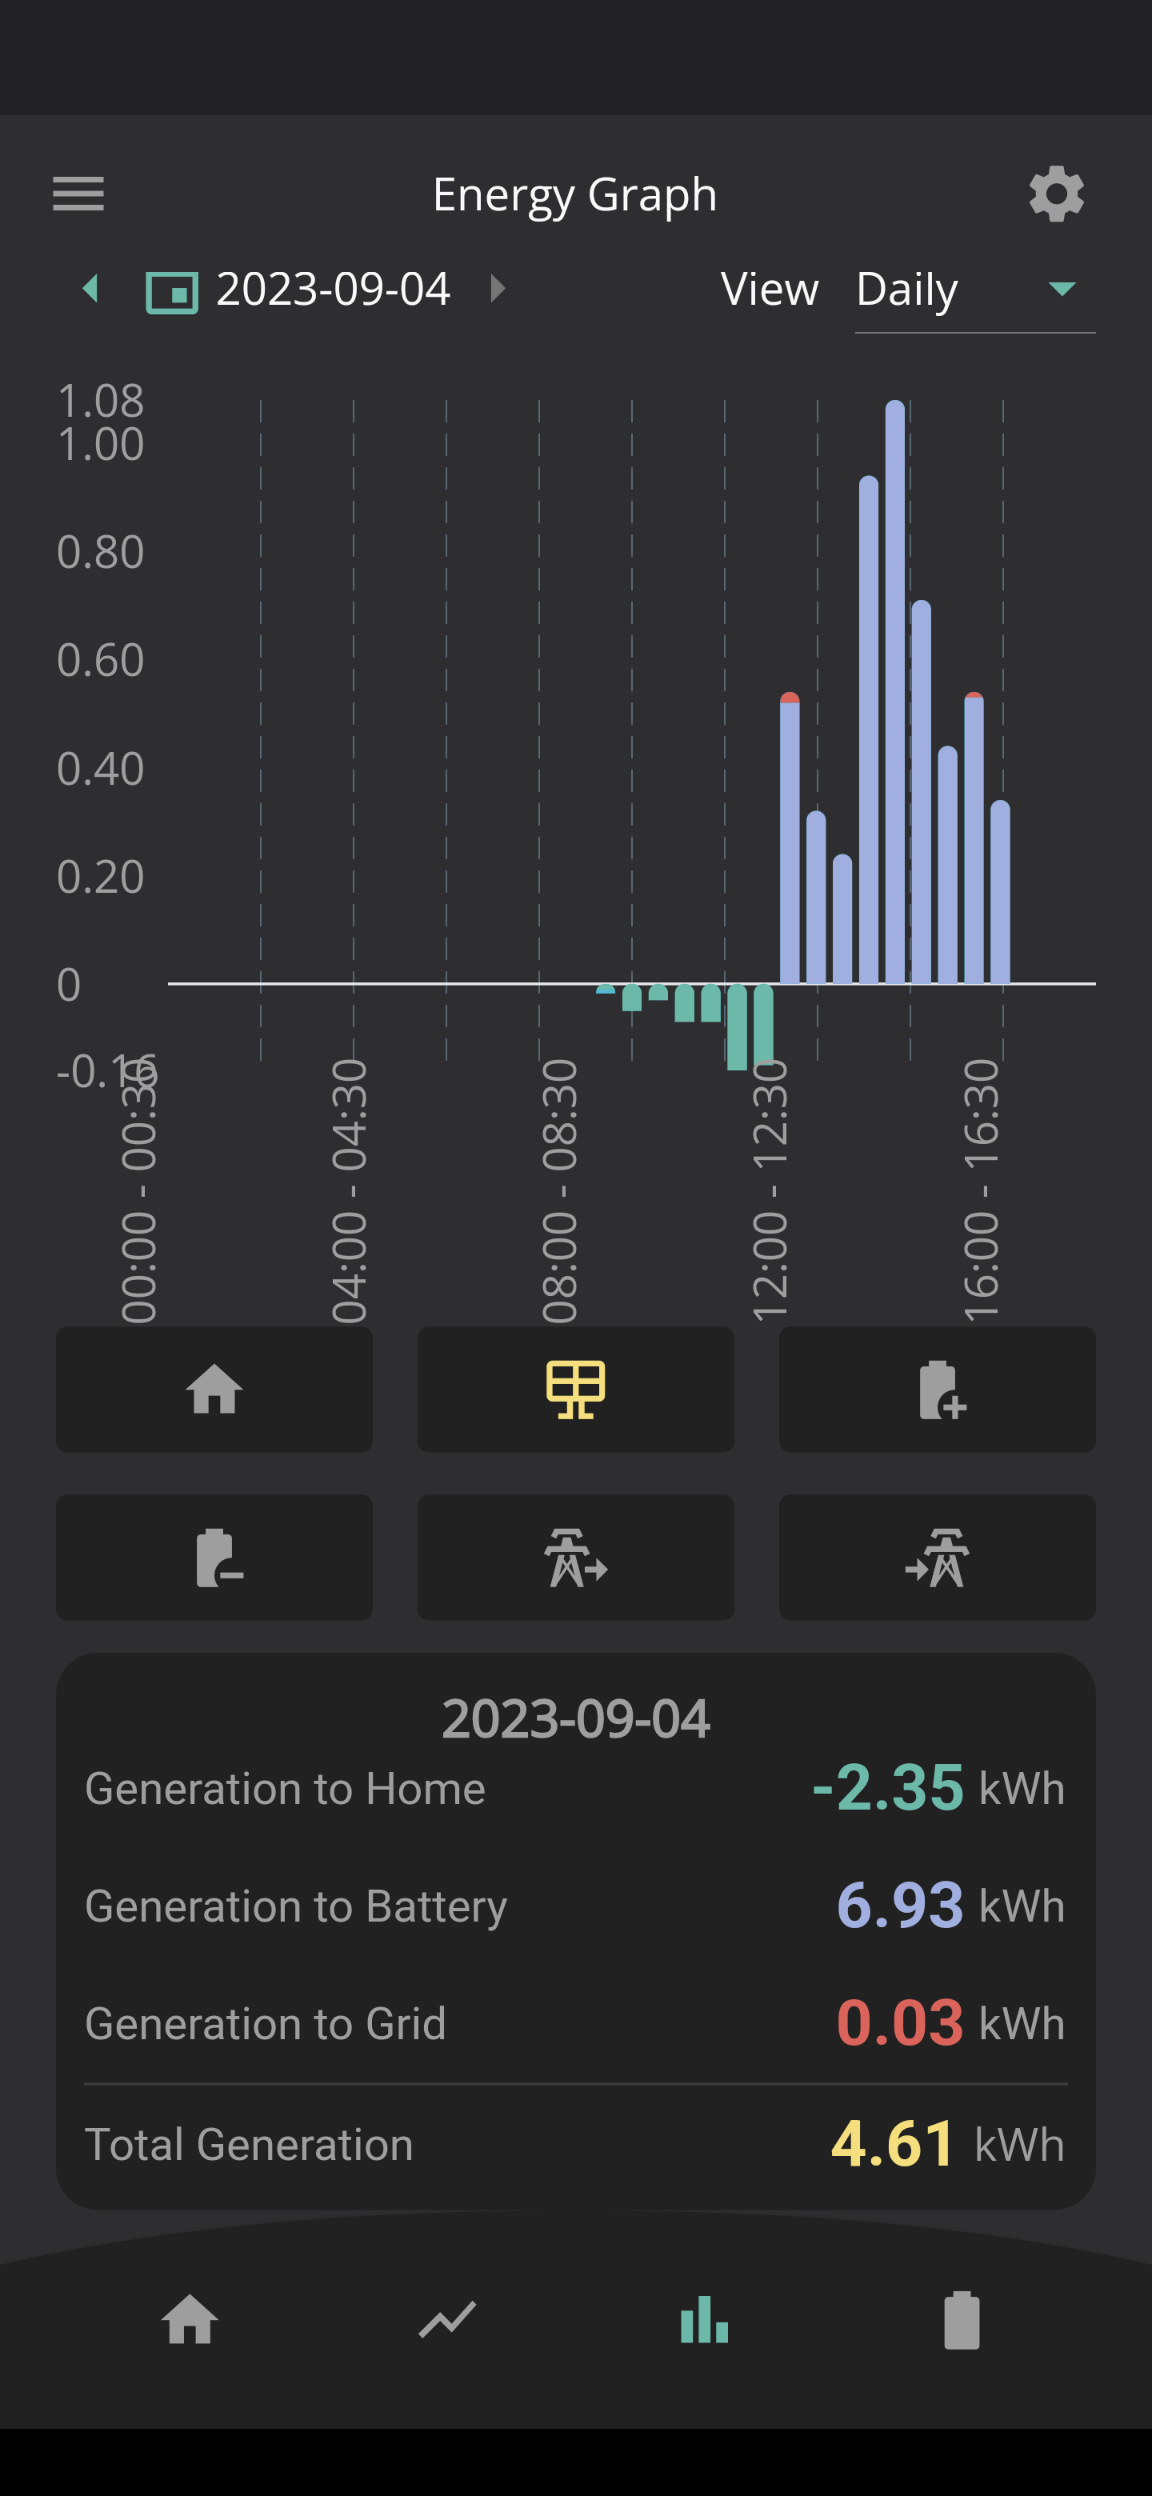
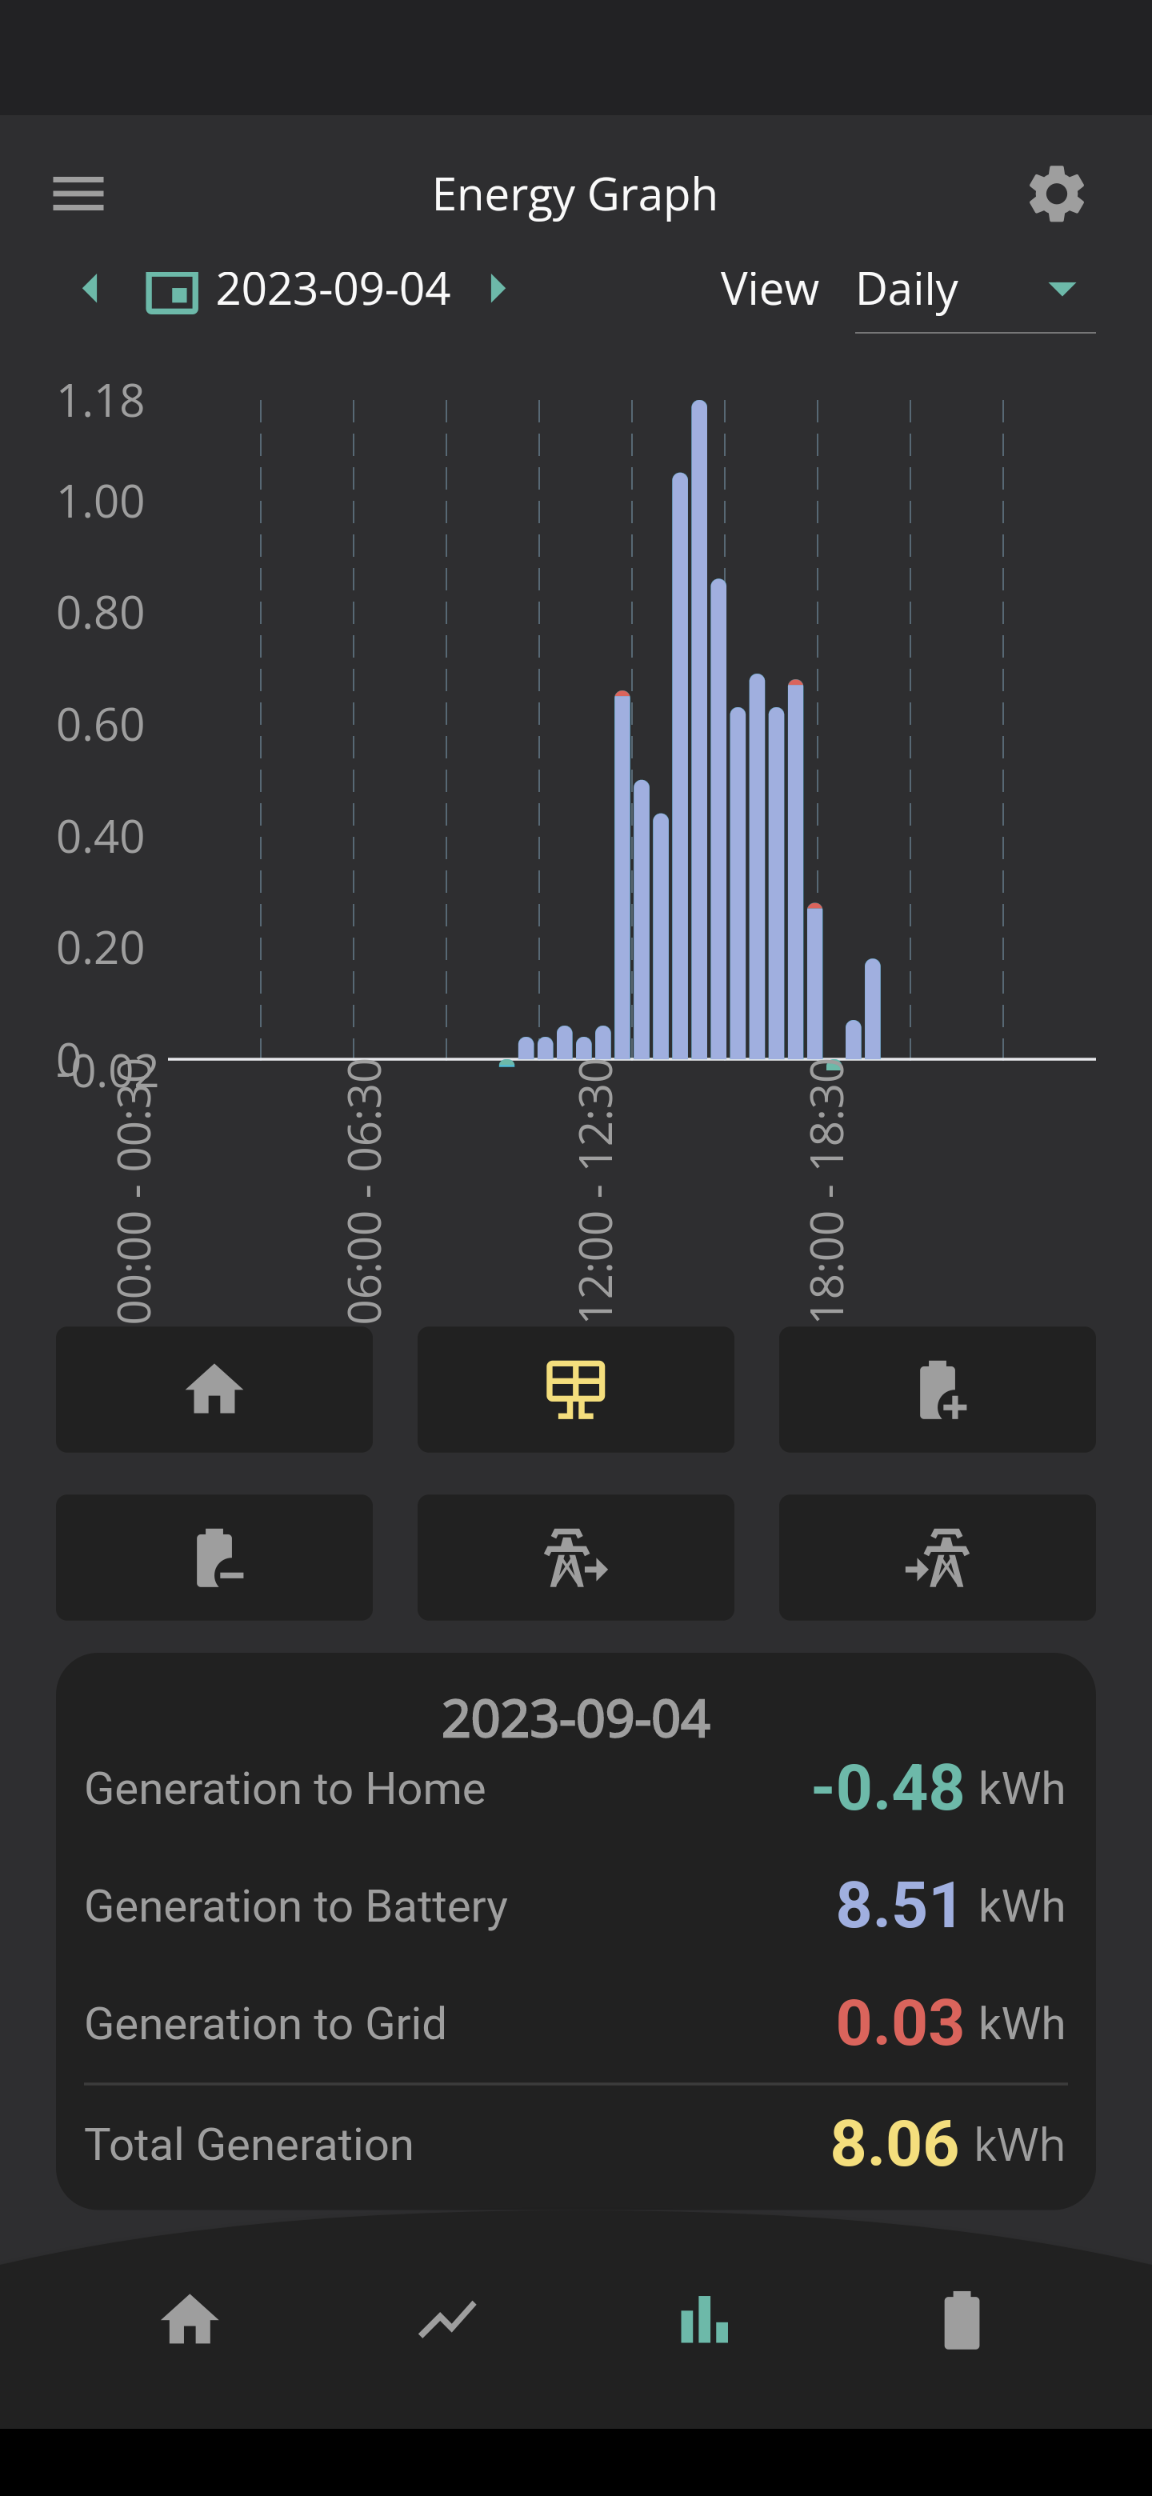
This shows the Energy Graph for Generation for the day. You can add the three totals (ignoring the minus) to get the actual amount it thinks was generated by solar for the day.

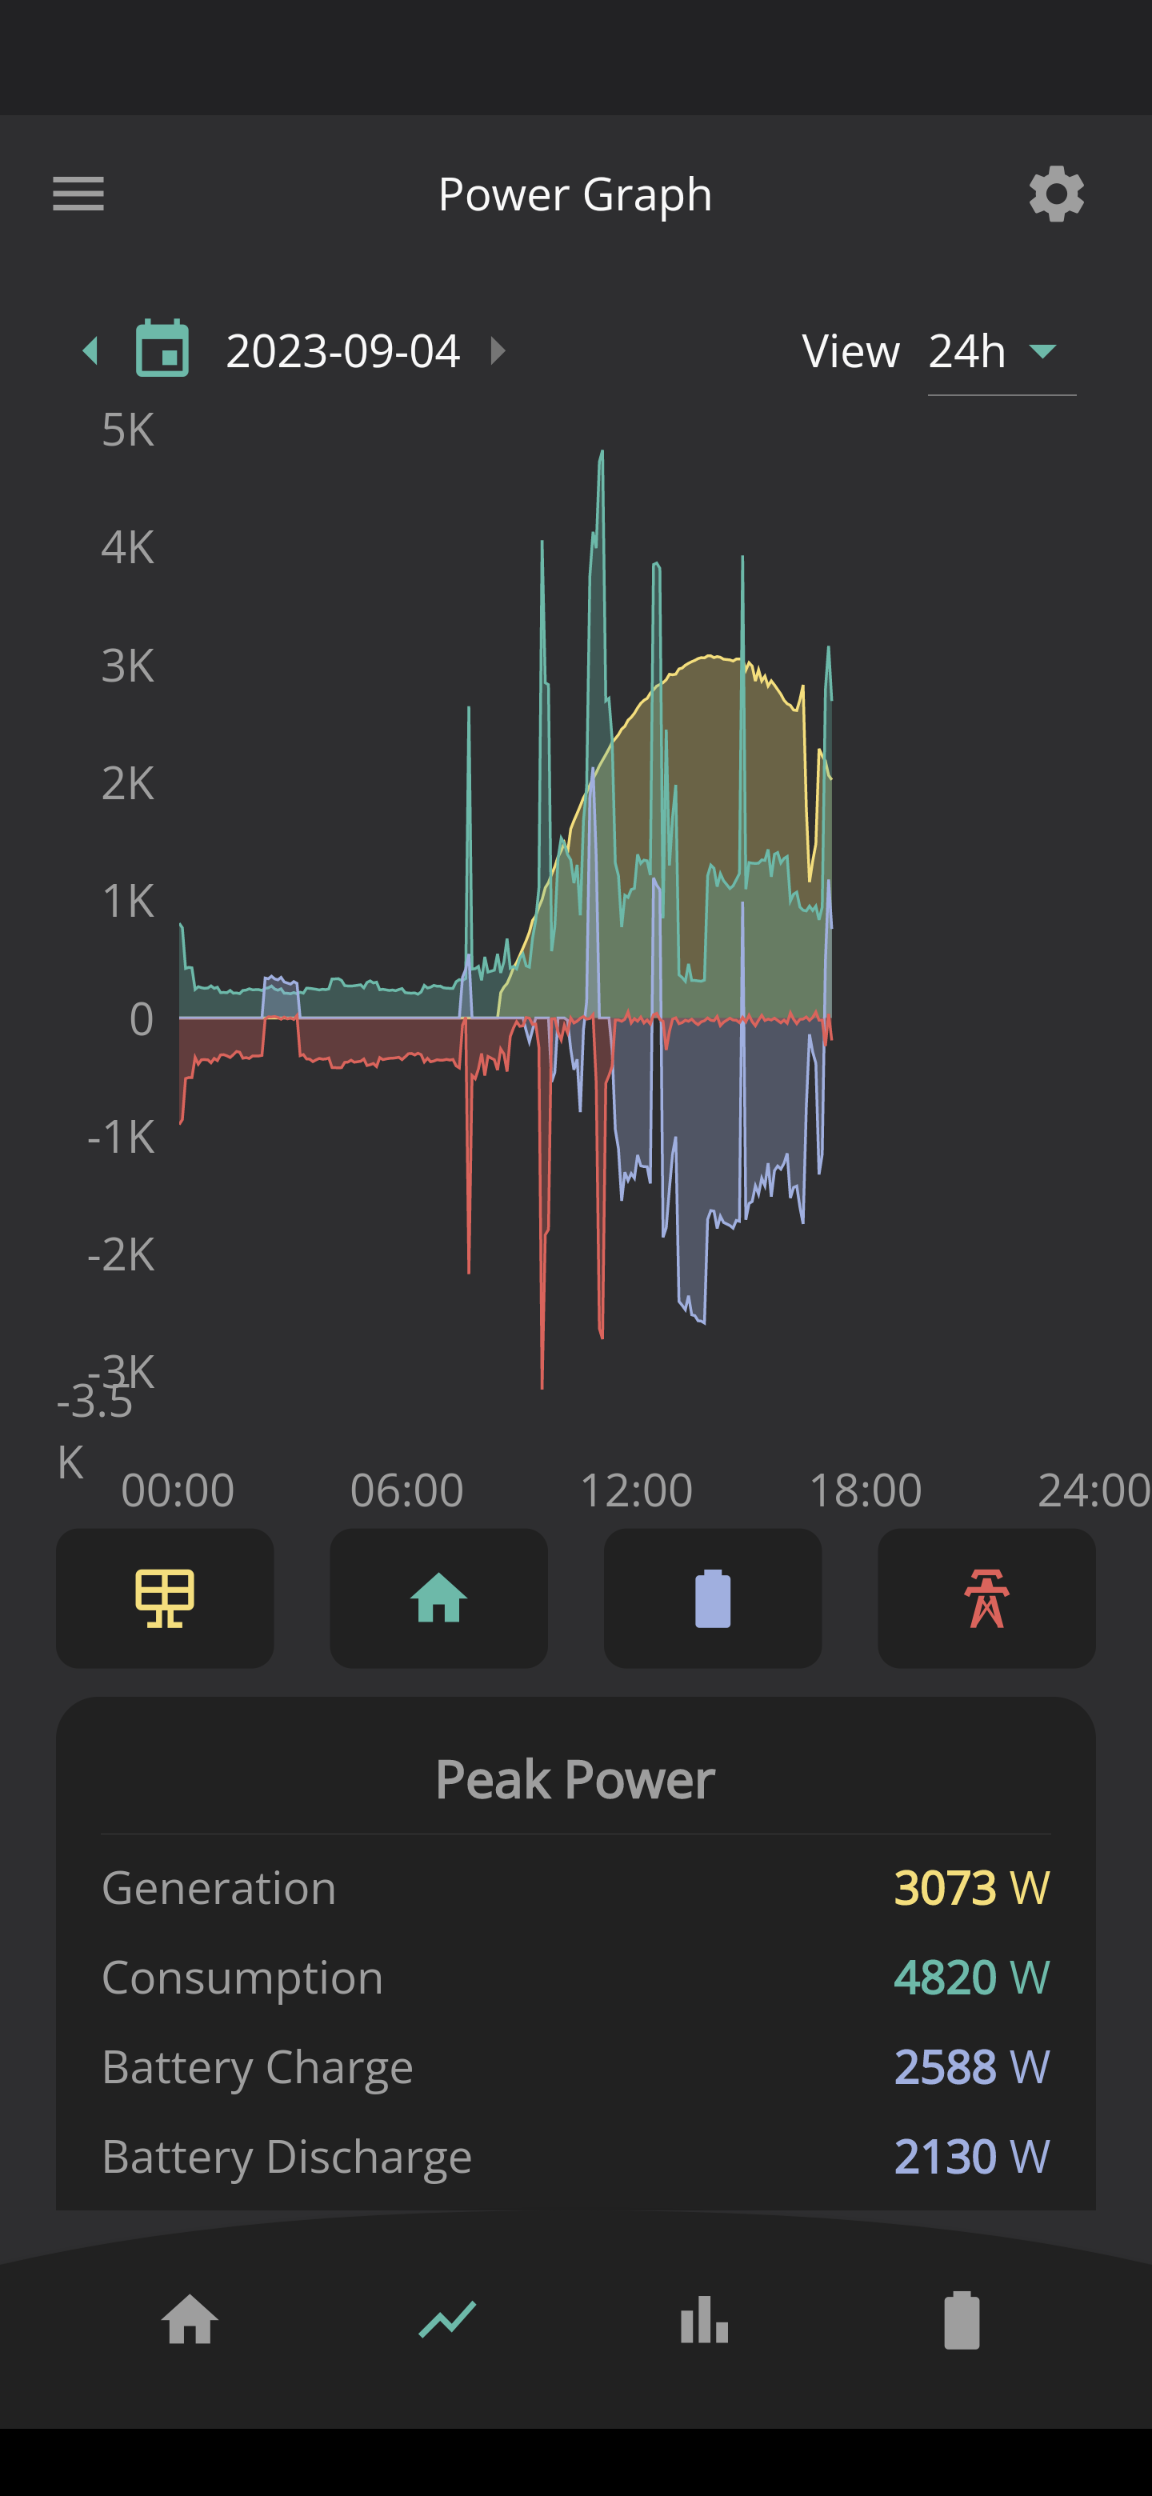
This shows the Power Graph for the day, note the nice smooth yellow Generation graph that closely matches the data from SolarEdge below, indicating it's not a com problem.

This final one shows what the SolarEdge portal gives as the total generation for the day. Note the much larger generation total.

B
#6 Barns

Barns Looking at the Energy Graph a bit more, I'm wondering if the issue is that it's ignoring any "Generation to Home" for a data period where there's any "Generation to Battery". So for the period where it was charging the battery from solar, it was also using a big chunk of the solar to power the home (obviously, since only excess solar goes to the battery). However that's not reflected on the graph at all - no Generation to Home for any time period where there's any Generation to Battery. Meaning a big chunk of the total generation is just missing.

J
#7 Jellybaby

Barns I came to the same assumption, its ignoring some kind of data.

I have a Solax inverter but that only reports yield from panels themselves, thats as far as any info goes that I get outside of GE app/portal.

B
#8 Barns

Just to rub in how wild the data is, here's a picture of yesterday's Energy Graph for Generation, same day as above just taken the next morning. Note that the figures are very different especially the "Generation to Home" which has somehow decreased!! Which obviously makes no sense at all. Definitely a software bug.

I
#9 IanMac

My in-laws have just had an AIO installed and their Energy graph often shows these "upside down" figures as per Jellybaby's post 4 on this thread. At first I thought it must be a CT clamp the wrong way around, but some days the graph is correct and others it is upside down with negatives. Having looked in more detail, I can only conclude there is a bug in the software.. They do get outages on their internet connection tho, which might affect things.

B
#10 BlokeFromStoke

Same here - you have to sum the absolute values to get a realistic number...

B
#11 Barns

BlokeFromStoke yes but as you'll see from the pics above, the sum of absolute values is less than 50% of what was actually generated. So it's still hugely massively wrong! Basically something is very borked in the Energy Graph numbers for Generation at least.

R
#12 Rubikcube

Barns the "Generation to Home" which has somehow decreased!!

The generation to home has changed from -2.35 to -0.48 which is a mathematical increase.

B
#13 Barns

Rubikcube yes ok 🙂 but the absolute value has decreased which is what's important here, the minus (I believe) is just there to indicate the "direction" of the flow in some way that I've not quite figured out the meaning of. But GE seem to do this throughout their graphs, use negative and positive values to indicate "charging" and "discharging" type behaviours and I'm assuming this negative is something similar directionally.

#14 NC

Evening all,

Exact same issue here.

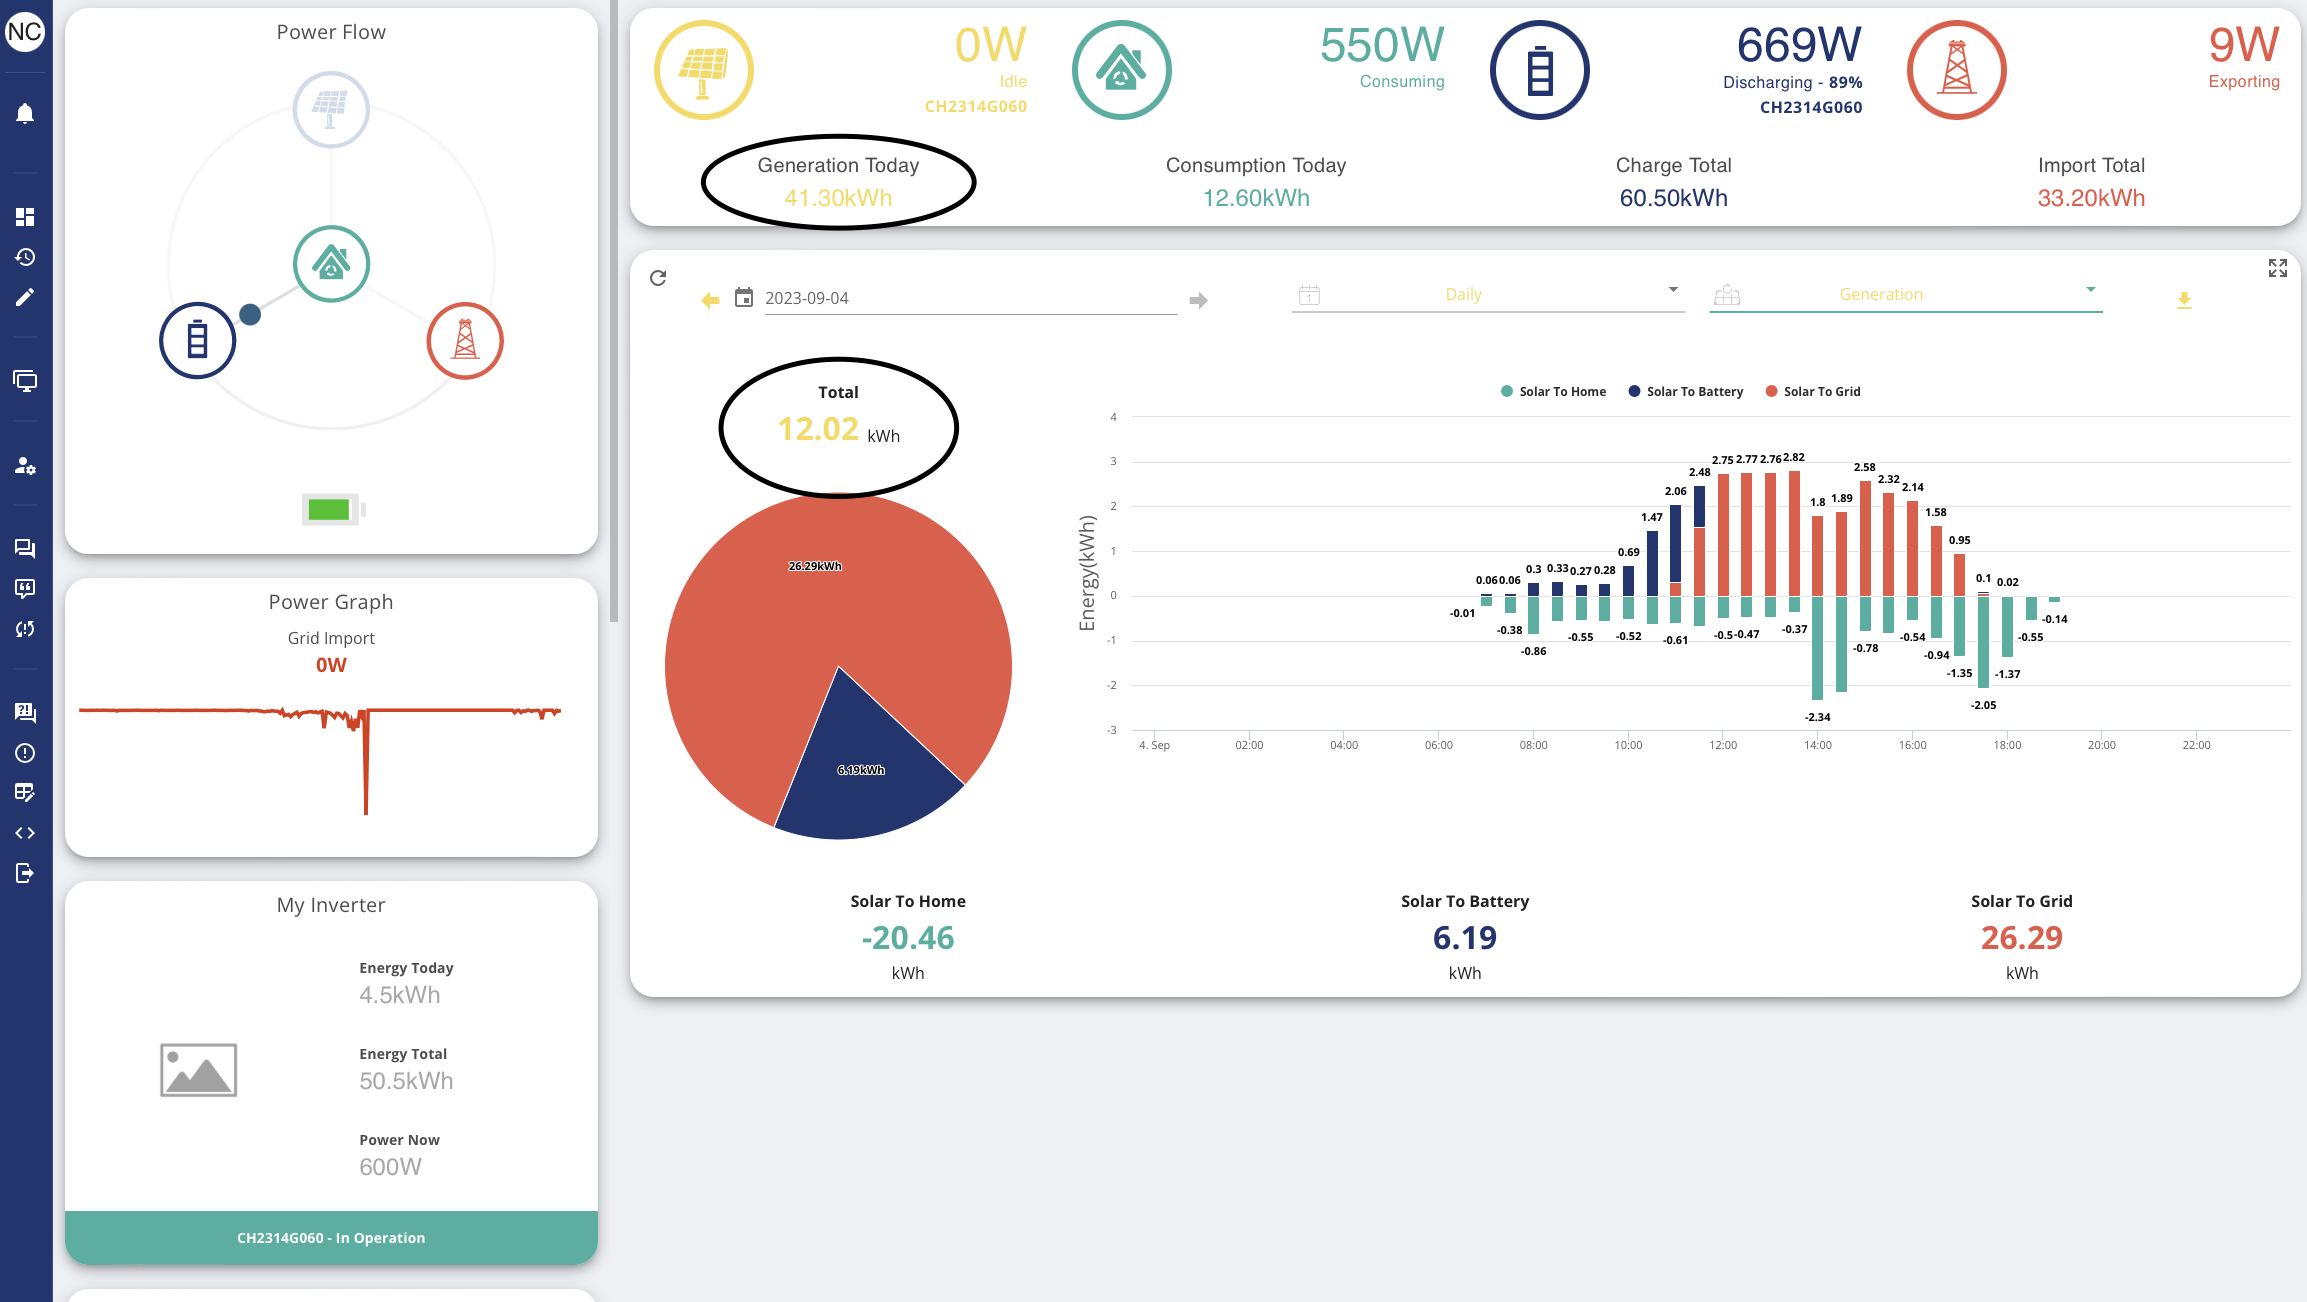
I've sent some feedback to GE about it and I'm hopeful for a response. My numbers are all over the place as fas as the energy chart are concerned. Like you have pointed out, the power chart seems within an acceptable tolerance and I'm happy with that. How the 2 charts are reading the same data and coming up with wildly different conclusions leads me to believe it has to be a bug and hopefully resolved in a firmware update. Here's an example from my portal yesterday. Not the worst I've seen by a long shot but still bad.

Guess my career as a YouTuber presenting my monthly stats will have to wait...

G
#15 geoffreycoan

NC Its not just an AIO issue. I have two Gen 1 hybrid inverters and have found the GE reporting is just wrong - see my posts and screenshots on https://community.givenergy.cloud/d/2913-does-anybody-have-a-remotely-working-energy-graph/3

The GE data does give me a ‘shape’ of what’s happened (ignoring the negative generation figures), but all of the generation is too low and the export is low as well. Import and battery SoC seem about right.

To rub salt into it, the BBC basic iOS inverter app gives correct figures every day, although of course no history on that. I’m now using Home Assistant and the data there (read directly off the inverters with GivTCP) doesn’t have any of these issues. If you want your youtube career to take off get Home Assistant!

W
#16 wilfleek

Jellybaby

If you click on the tab that says "home" and change that to "generation", the figures make a bit more sense, at least on my system they do.

#17 NC

wilfleek This is the generation screen though.

D
#18 Daveb01

Barns

Hi Barns,

I have also been getting these errors and sent an email to GE and they have sent this back.

believe this to be a reporting error due to it being calculated data, please look at meter data for a more accurate representation of this.

So if you go here and compare then it is accurate (with a little difference from DC to AC conversion)

Click on your inverter information Icon (looks like a TV)
Scroll to the last TAB “Meter Data”
Look at column “PV Generation Today in kWH”

My data for say 10th September

SolarEdge says Production 11.8 kWh
GE says Production 10.9 kWH

G
#19 GaryS

IanMac Mine does the same. The Energy graph with the AIO is totally useless and not fit for any analysis at all.
This needs fixing.