

Newbie questions apologies, but today is probably the first day since my PV panels went up that I’ve had a constant 10/10ths blue sky from morning to evening. GE app chart snapshot looks like this: 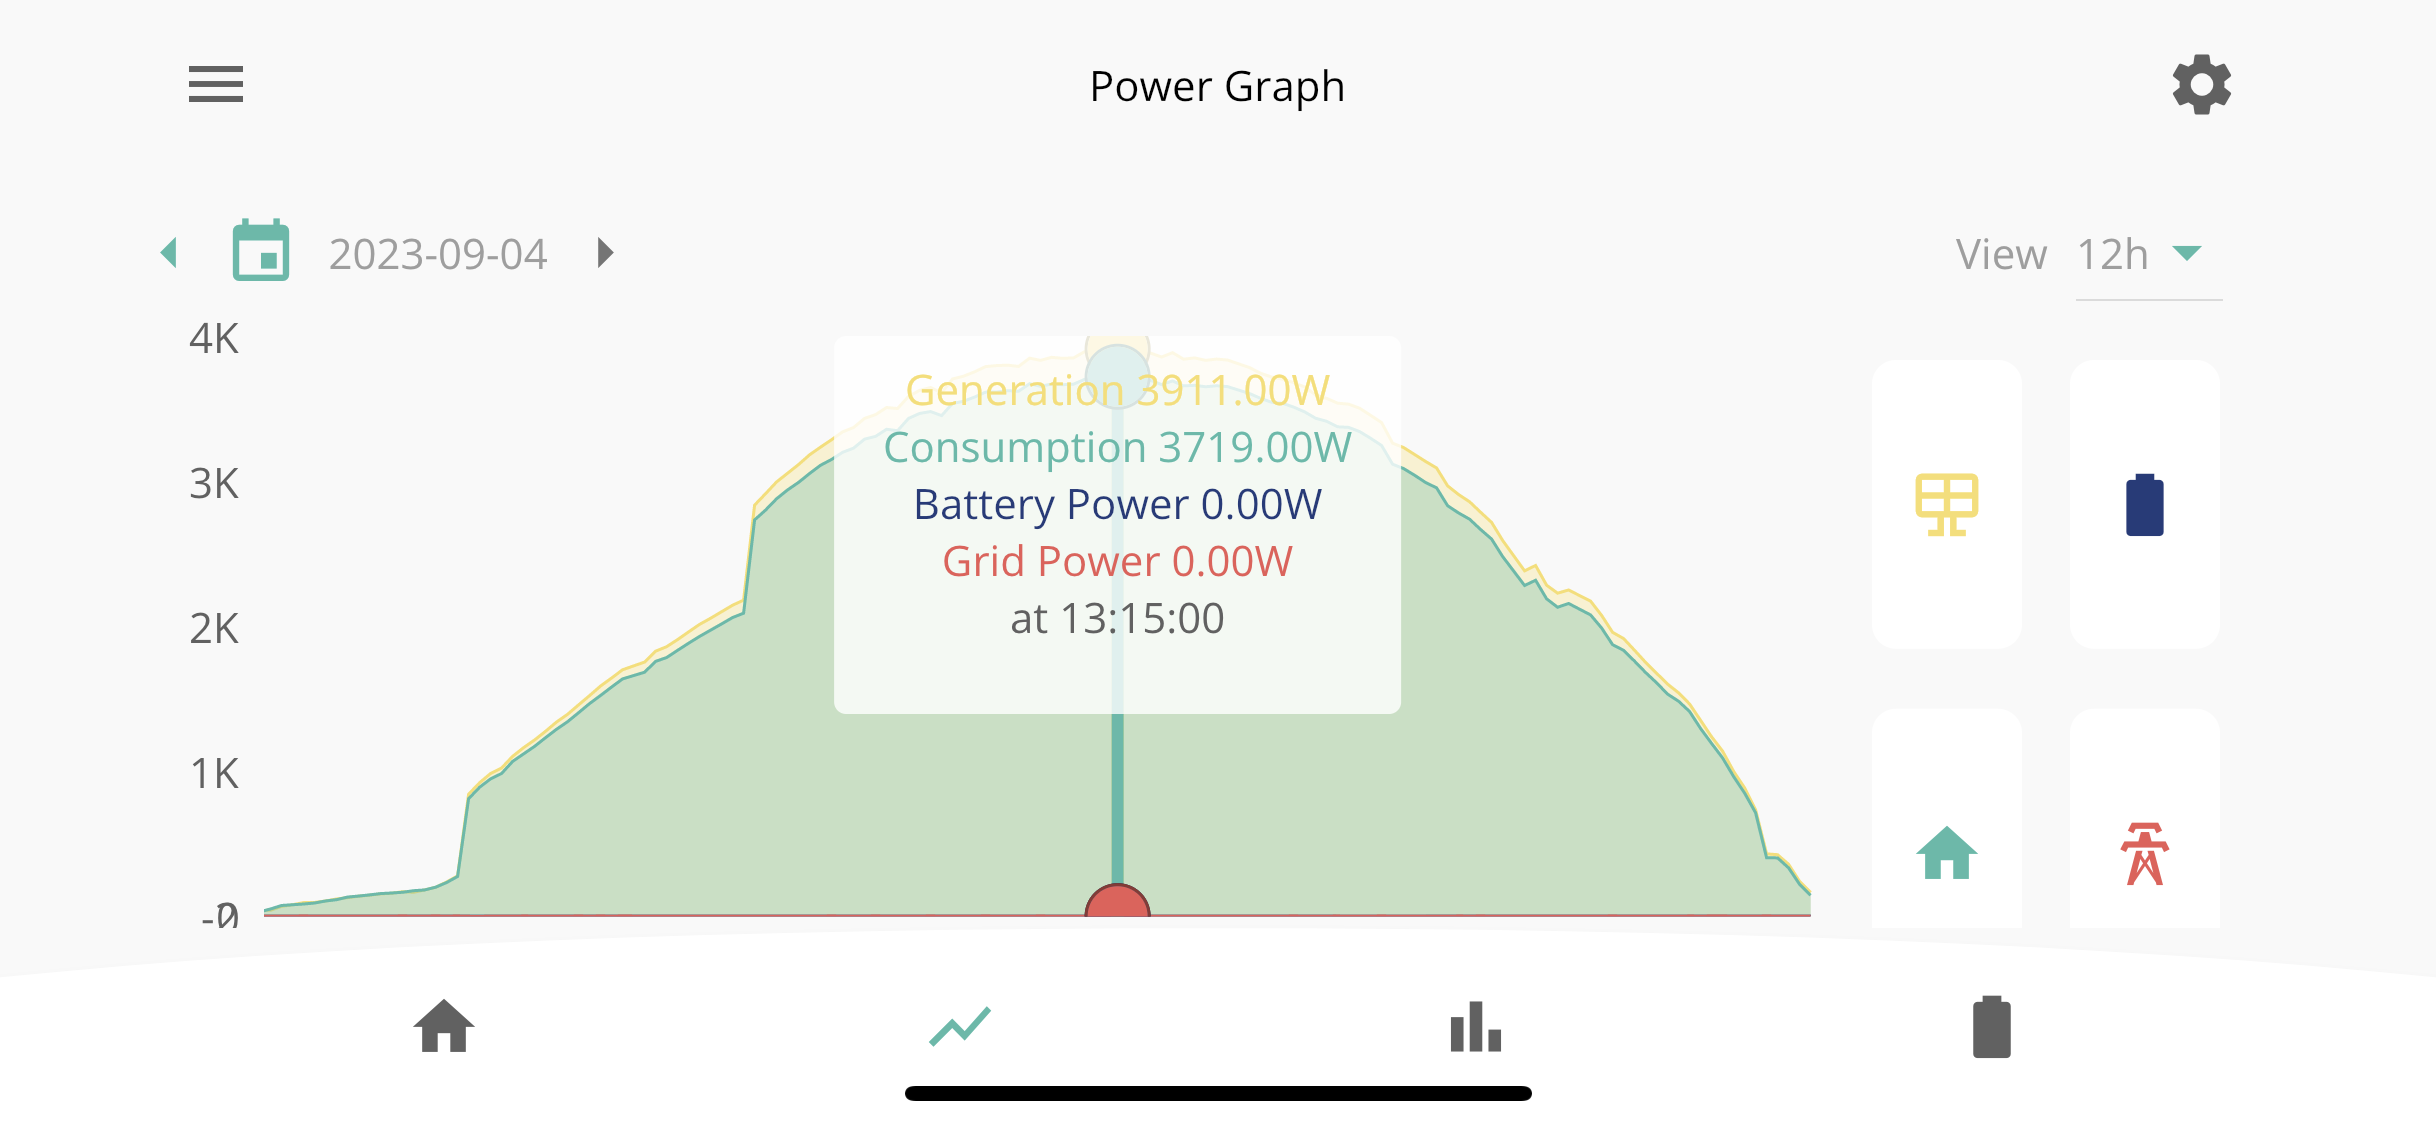
I have 13x400W panels so 5.2kW theoretical max output (10 on a flat roof, 3 on a pitched roof) - and a GE gen3 5kW Hybrid inverter. My gateway and AIO are currently off as yet to be commissioned (fingers crossed for a successful GE site engineer visit booked for this week…)
The inverter today reported generating 3.9kW peak at 13:15, so 75% of that figure. There are also interesting discontinuities in the graph when generation steps up at 08:15 and 10:25 - perhaps spurious, or maybe due to panel location / orientation?
I would appreciate any input on
1) Does 75% peak generation sound right for early September?
2) The 5% difference between generation and consumption - is that due to inverter losses?
3) Is there a well regarded industry tool (that’s free?) for estimating theoretical generation given panel setup, location, time of year etc?
Thanks all - really grateful to this community for contributions thus far!