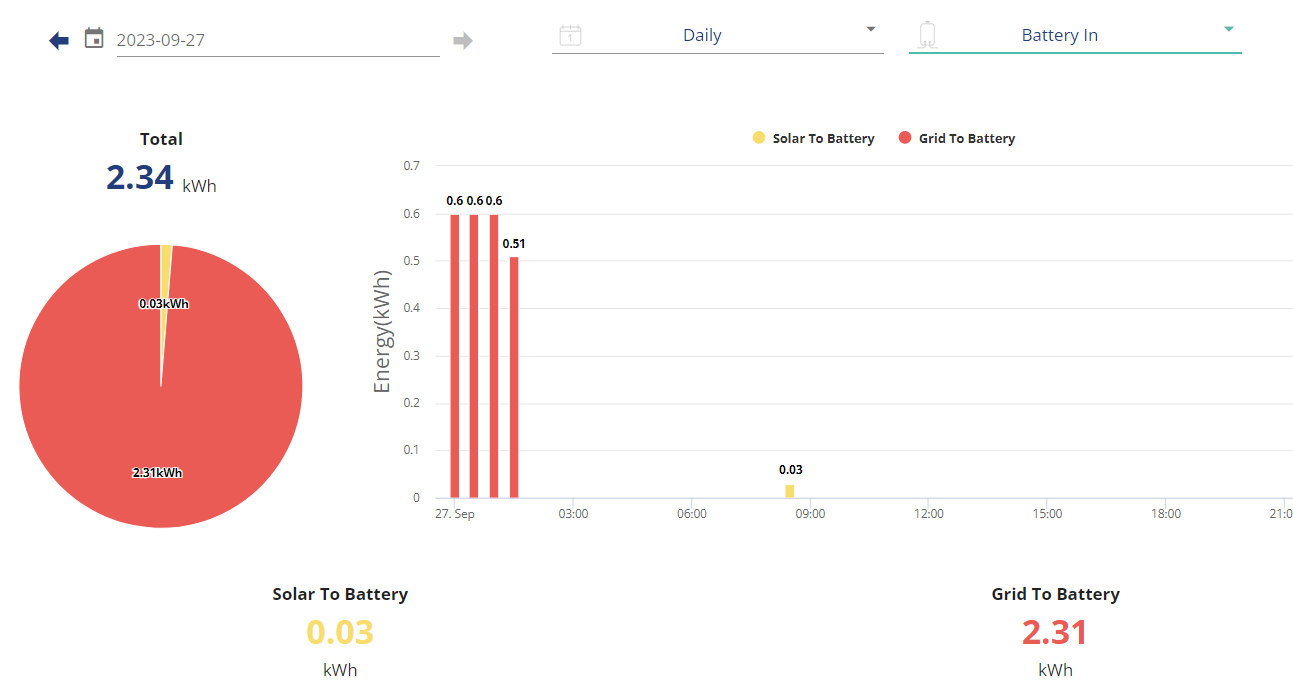
So I have had the SOC bug in the past and my system does appear to be fixed in terms of sudden drops. However the graphs on the dashboard are not tallying with what I would expect. Today I was looking at the data as I am considering getting a second battery, however I noticed something. I charge on a cheap rate nightly and here is that charge in the energy graph (battery in):
Here is the power graph for today also.
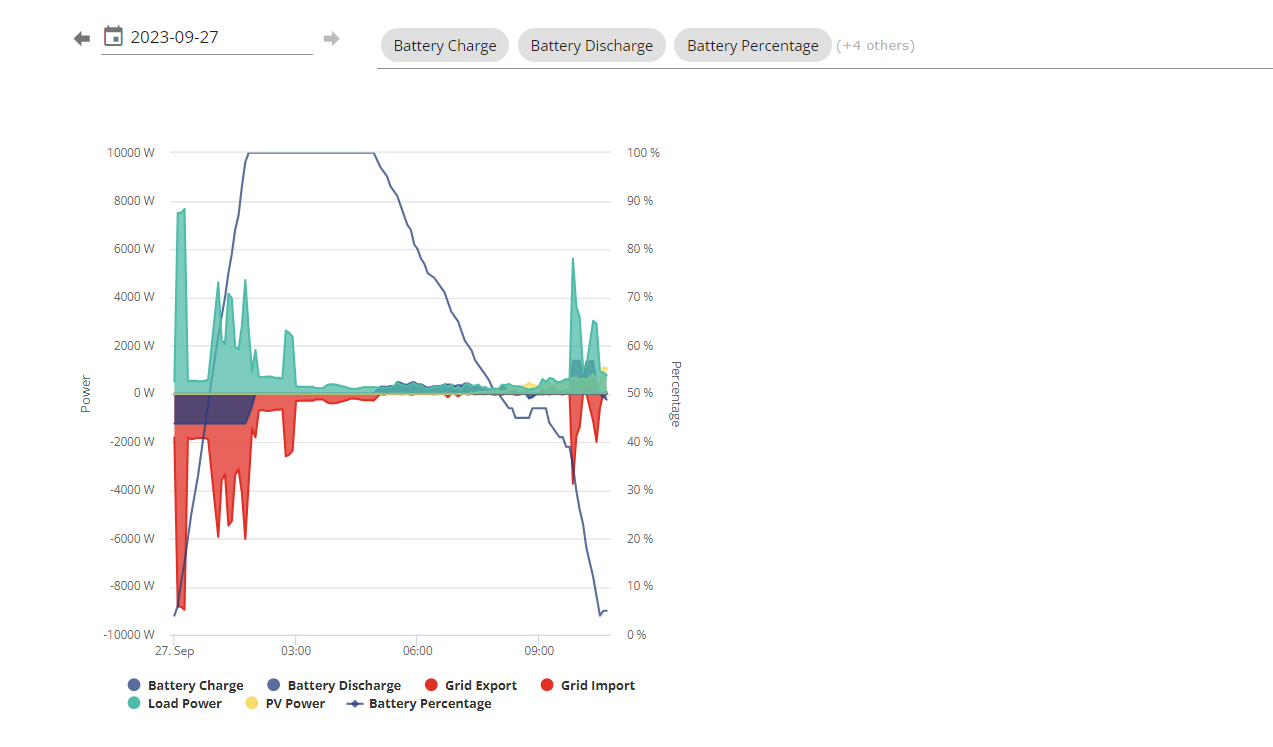
The battery can start discharging from 5am and tou see that usage over the morning , it even got minimal solar this morning at 9am ish... recharging slightly. Then I put on the dryer and the battery discharged down to 4% .
Here is the energy (battery out):
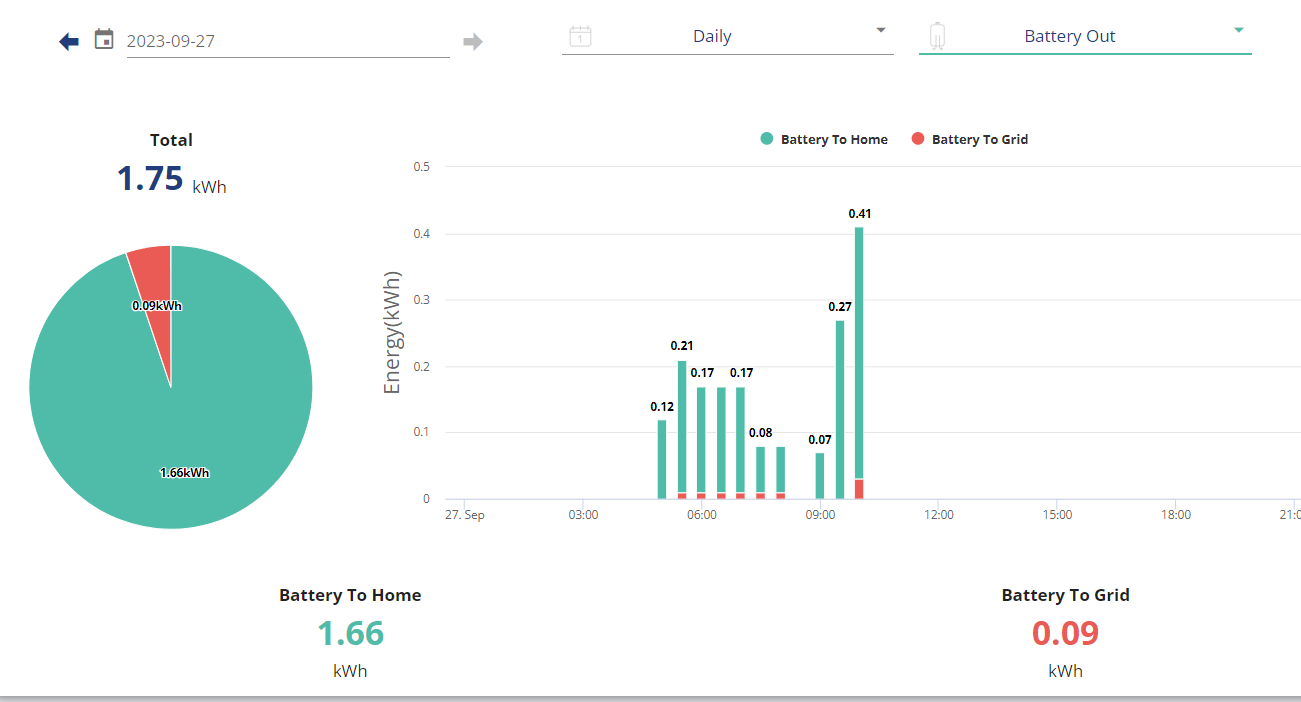
There are often missing bars which I can understand, the ones between 8-9 would be similar trend to the surrounding data so would not significantly increase the output, the totals are not exactly 2.4KwH which I also can understand. However they are significantly off here (.65KwH)
So The question, is this common with people? I suspect it's software rather than hardware but is there a fix coming? As a software developer I find these things infuriating because it causes me to doubt the hardware .
Thanks
--John