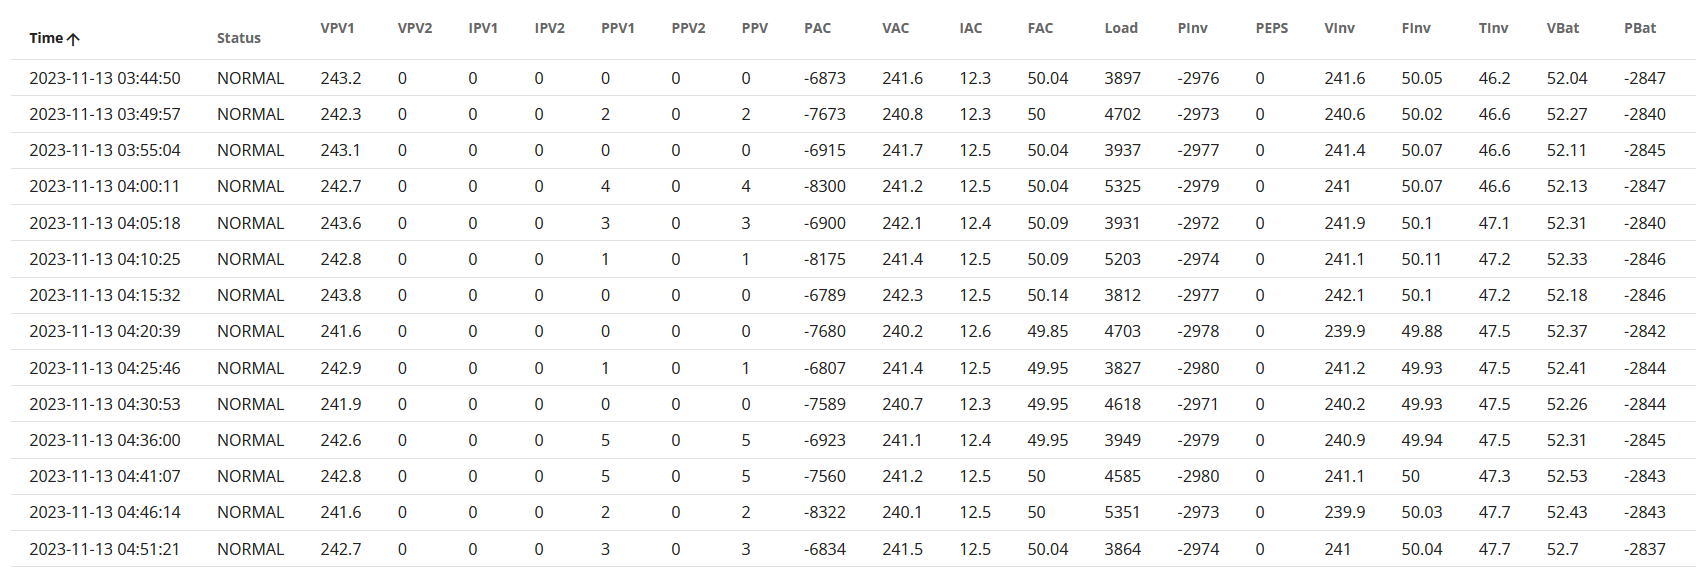
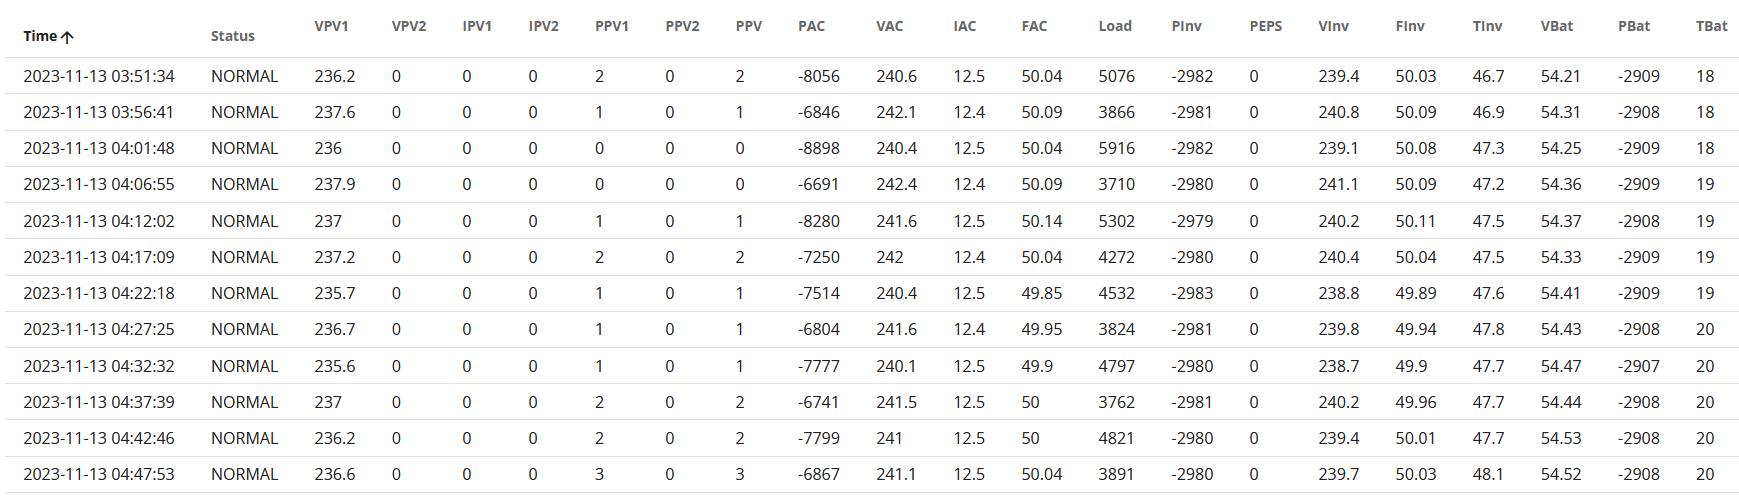
Looking at my portal energy graph for for early yesterday morning when the batteries were charging, the data on the inverter data - system data shows as expected both batteries charging at just under 3kW as I would expect.
However the Energy graph shows grid to battery of 1.3 - 1.4kW and grid to home of 2.2 to 2.3kWh. Neither of these numbers make any sense to me. What are they supposed to be?
My electricity meter readings from energy providers website show consumption of around 7.5kW which is what I would expect for that time - 2 batteries charging at near 3kW and around 1.5kW to the house.
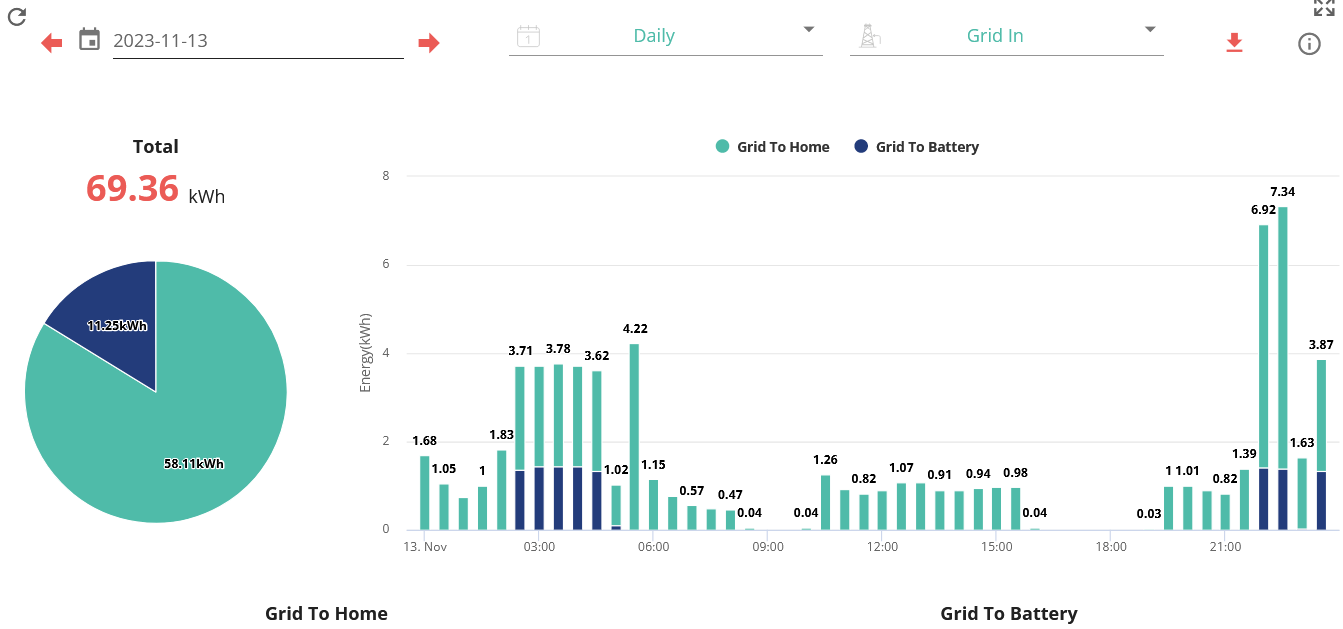

Portal Eneregy graph shows totally wrong data??
those graphs have never been right and they all contradict each other, they are 100% useless especially this one

Unless mums hot tub is on we dont get close to 20 let alone 50kwh a day unless the battery is calibrating.
Ah! so there is no way of getting good power (kWh) numbers for 1/2 hour intervals then? - The numbers in the first 2 tables appear to be spot values, so of limited use in calculating kWh power figures.
Pootle
Read this https://community.givenergy.cloud/d/2881-report-data-download-as-excel-file
Excellent work by Rtidey
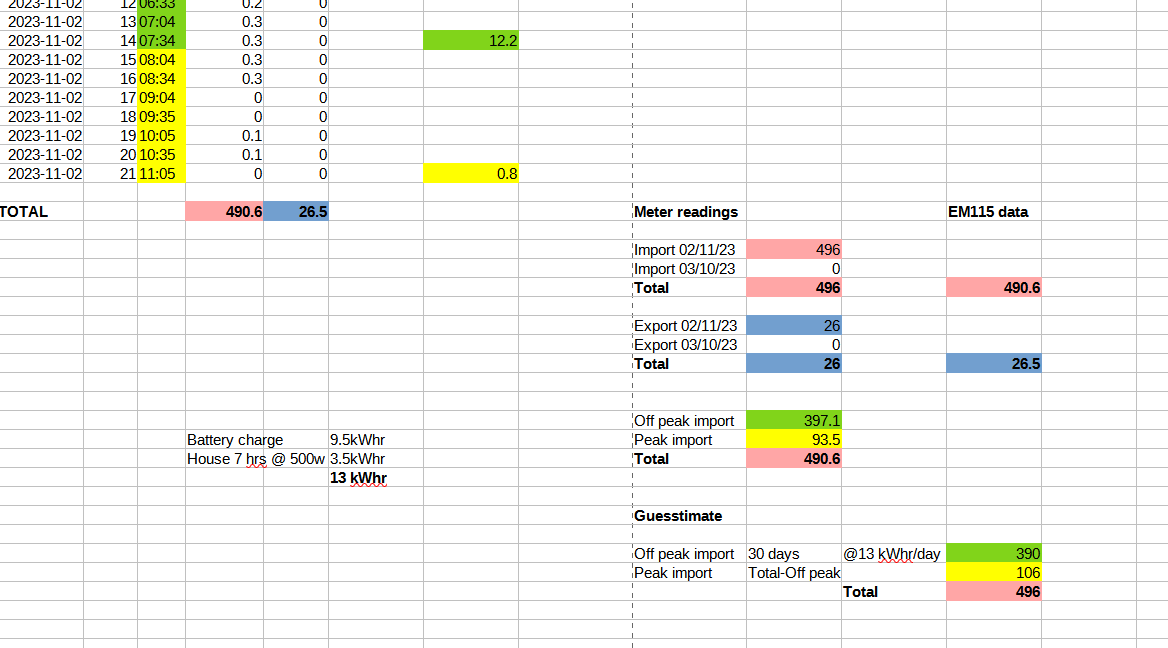
I presented this data to Octo to get my bill sorted. Snip below

Jellybaby That's a bit of an odd graph - it seems to be adding generation/import numbers to export/consumption, which doesn't really give anything meaningful. And without seeing the change in stored energy, can't really infer very much.
But the consumption part doesn't go much beyond 15kWh.