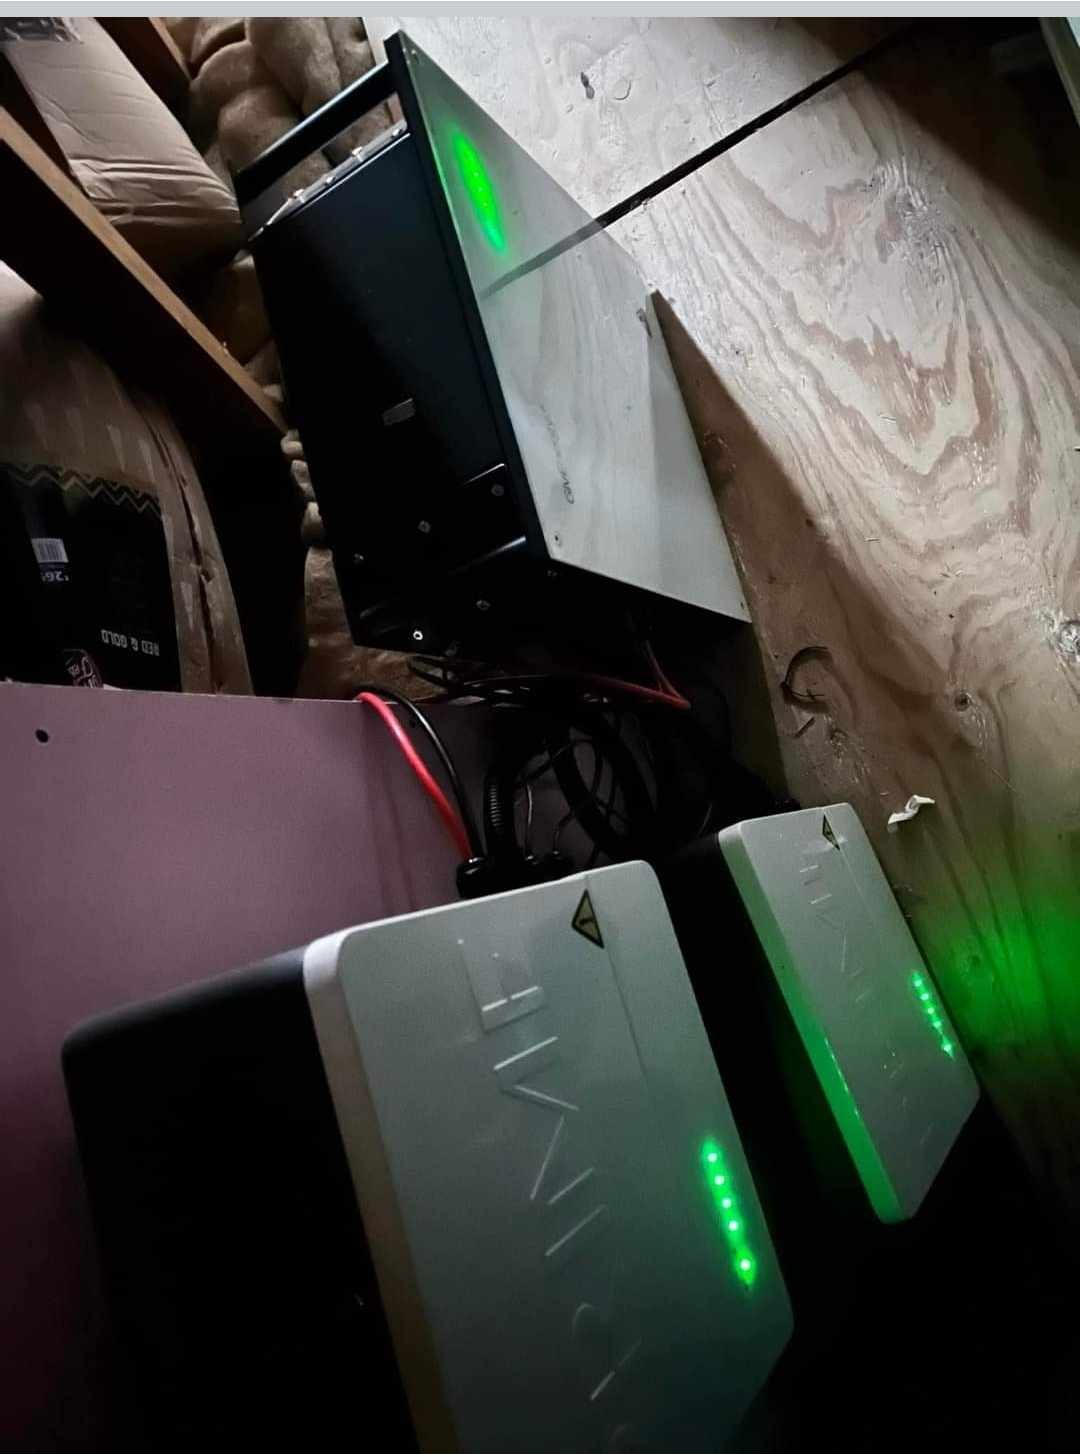
So, I finally bit the bullet and ran the numbers to try and get to the bottom of why the SOC drops keep on happening to me, which means I often get out of the AIO a lot less than the 13.5kWh advertised.
Asked another way
- is this a software issue i.e. the SOC / battery percentage algorithm (i.e. software) is flawed, or
- is this a hardware issue i.e. the AIO cells just aren't delivering as expected.
My source for this analysis was the Inverter data from the GE dashboard.
Notable events./ history for my device
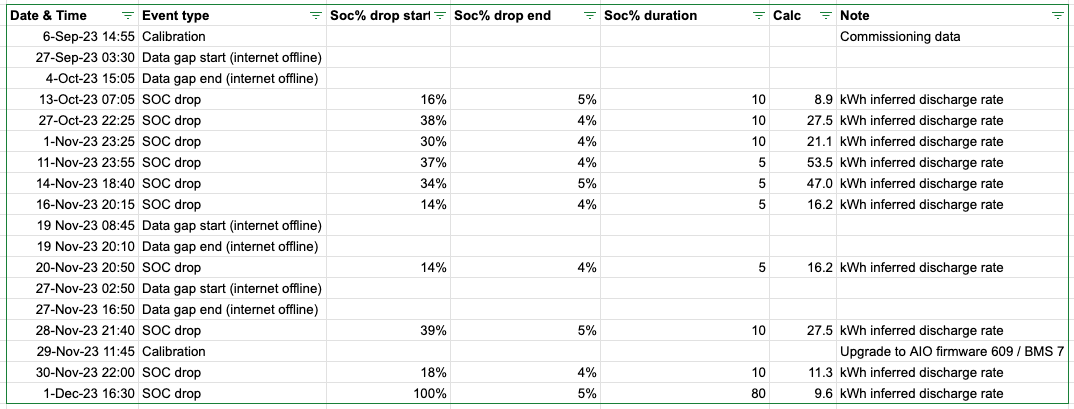
Note:
- On commissioning, the battery calibrated, and I was on AIO firmware 607, BMS 6. I upgraded this week to AIO firmware 609, BMS 7 and the battery calibrated again, but not material improvement.
- I have had a few data gaps due to the internet being offline while I was away from the house (and no local data storage on the AIO).
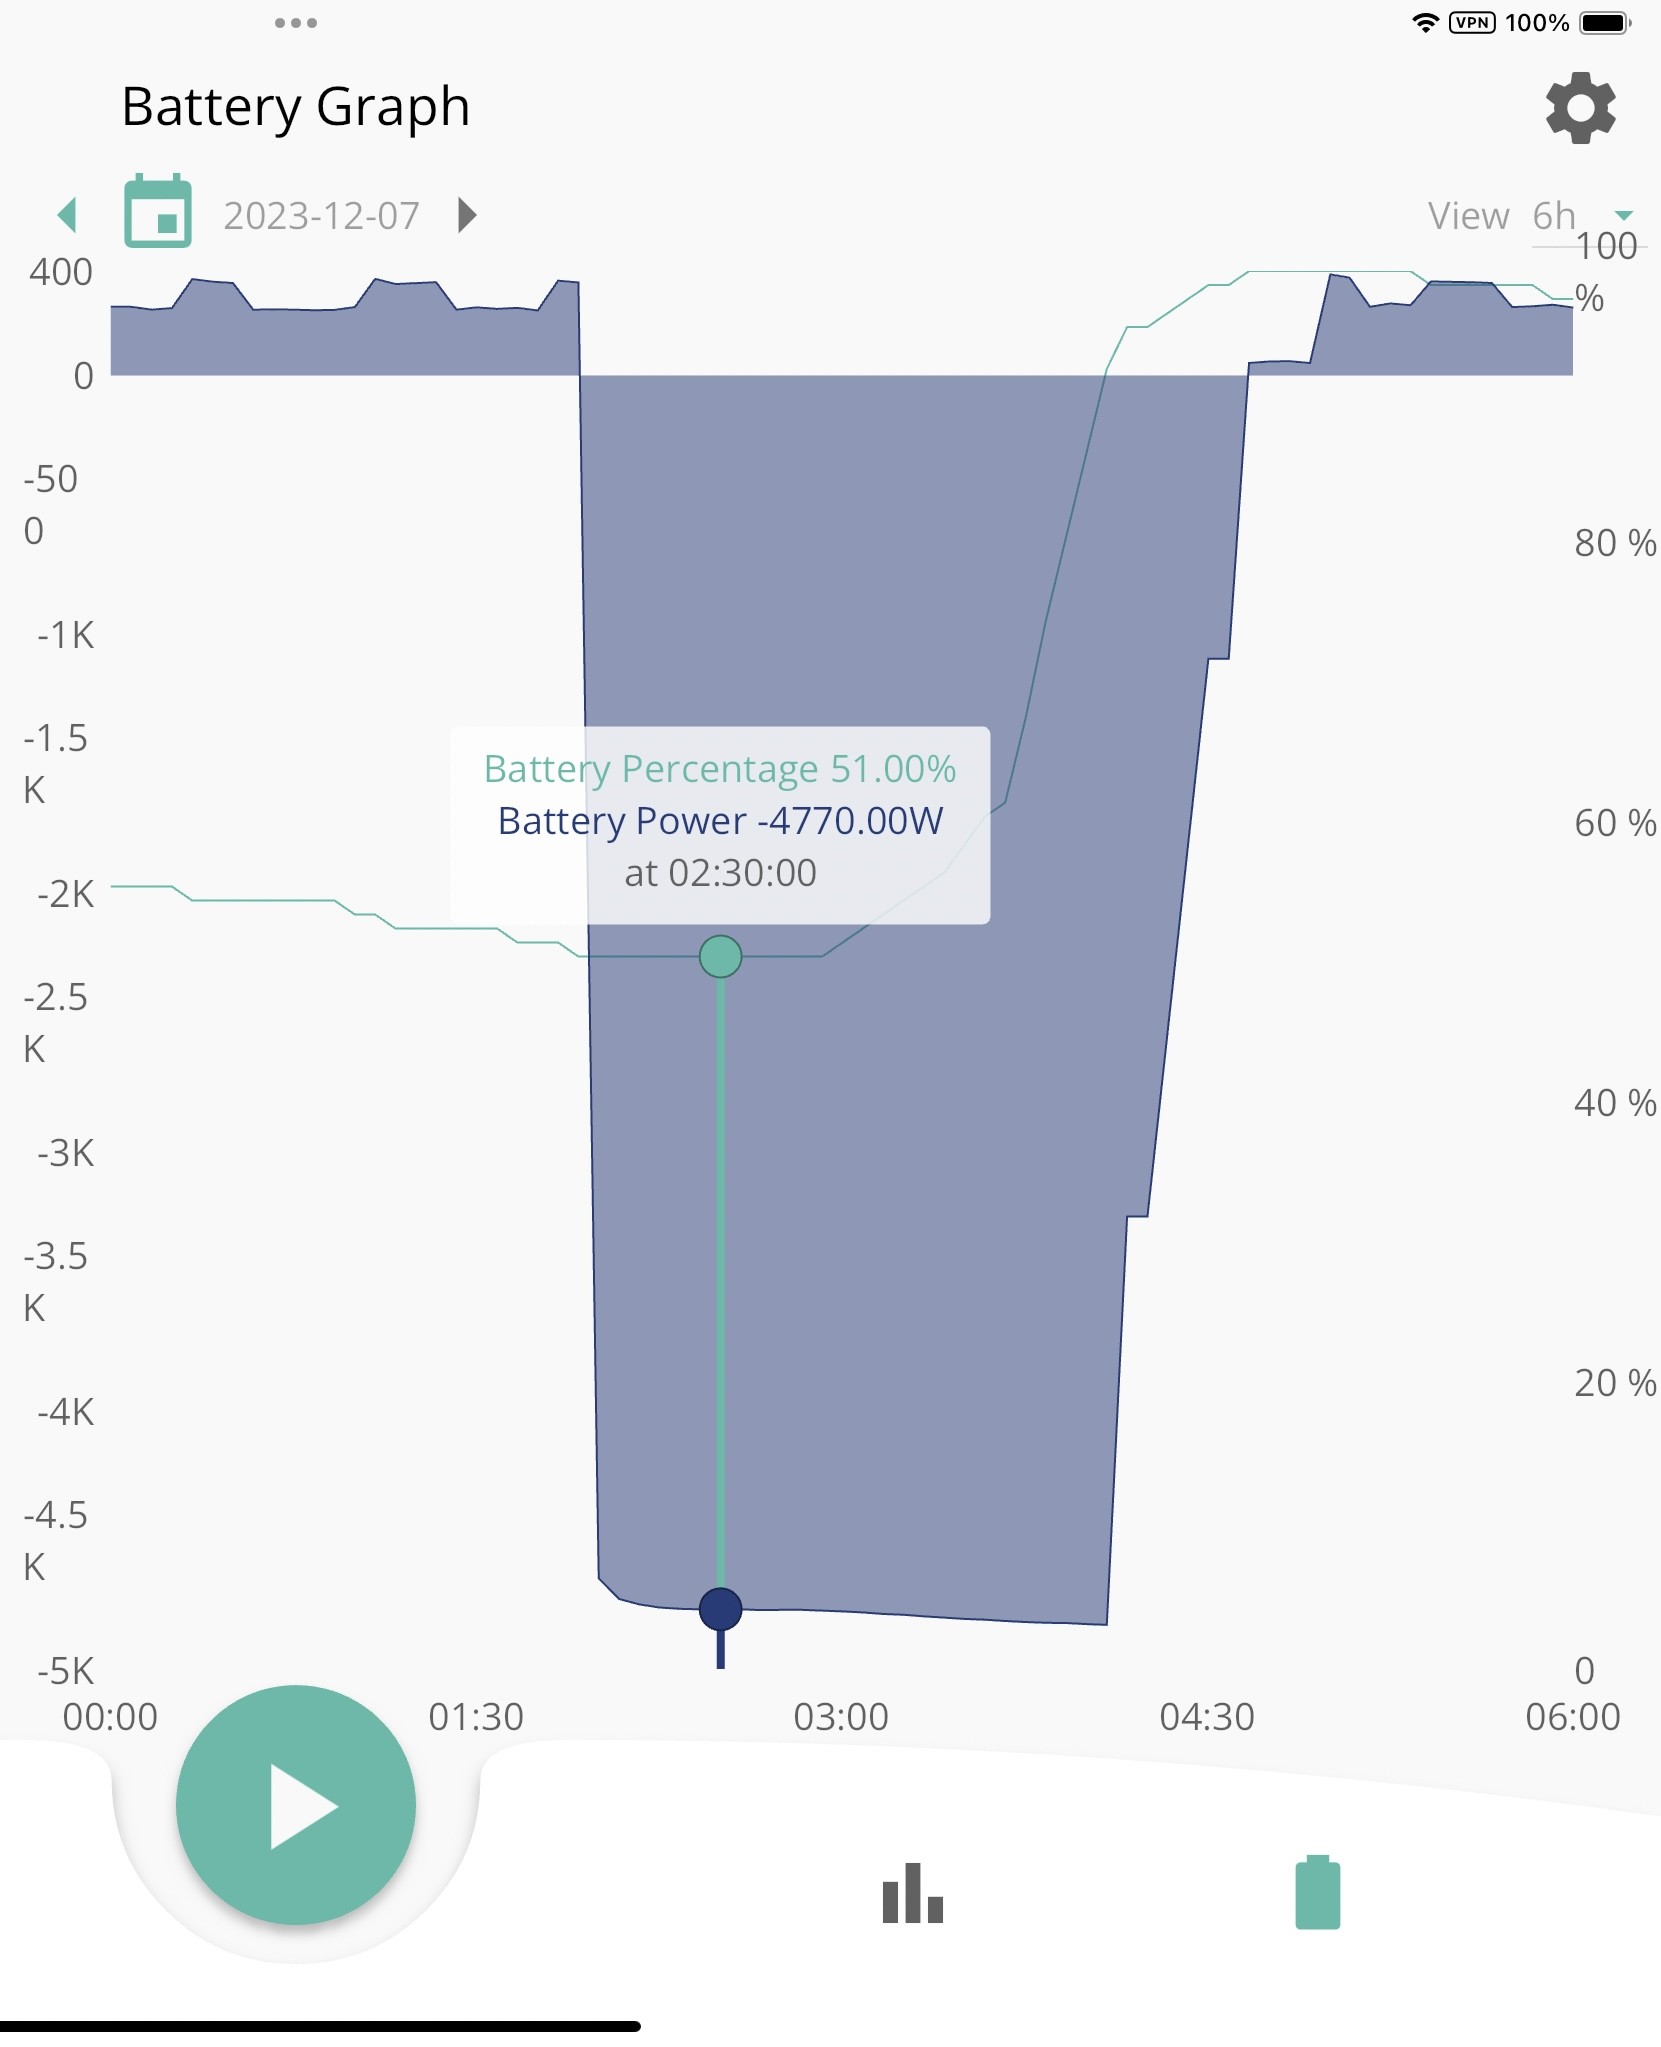
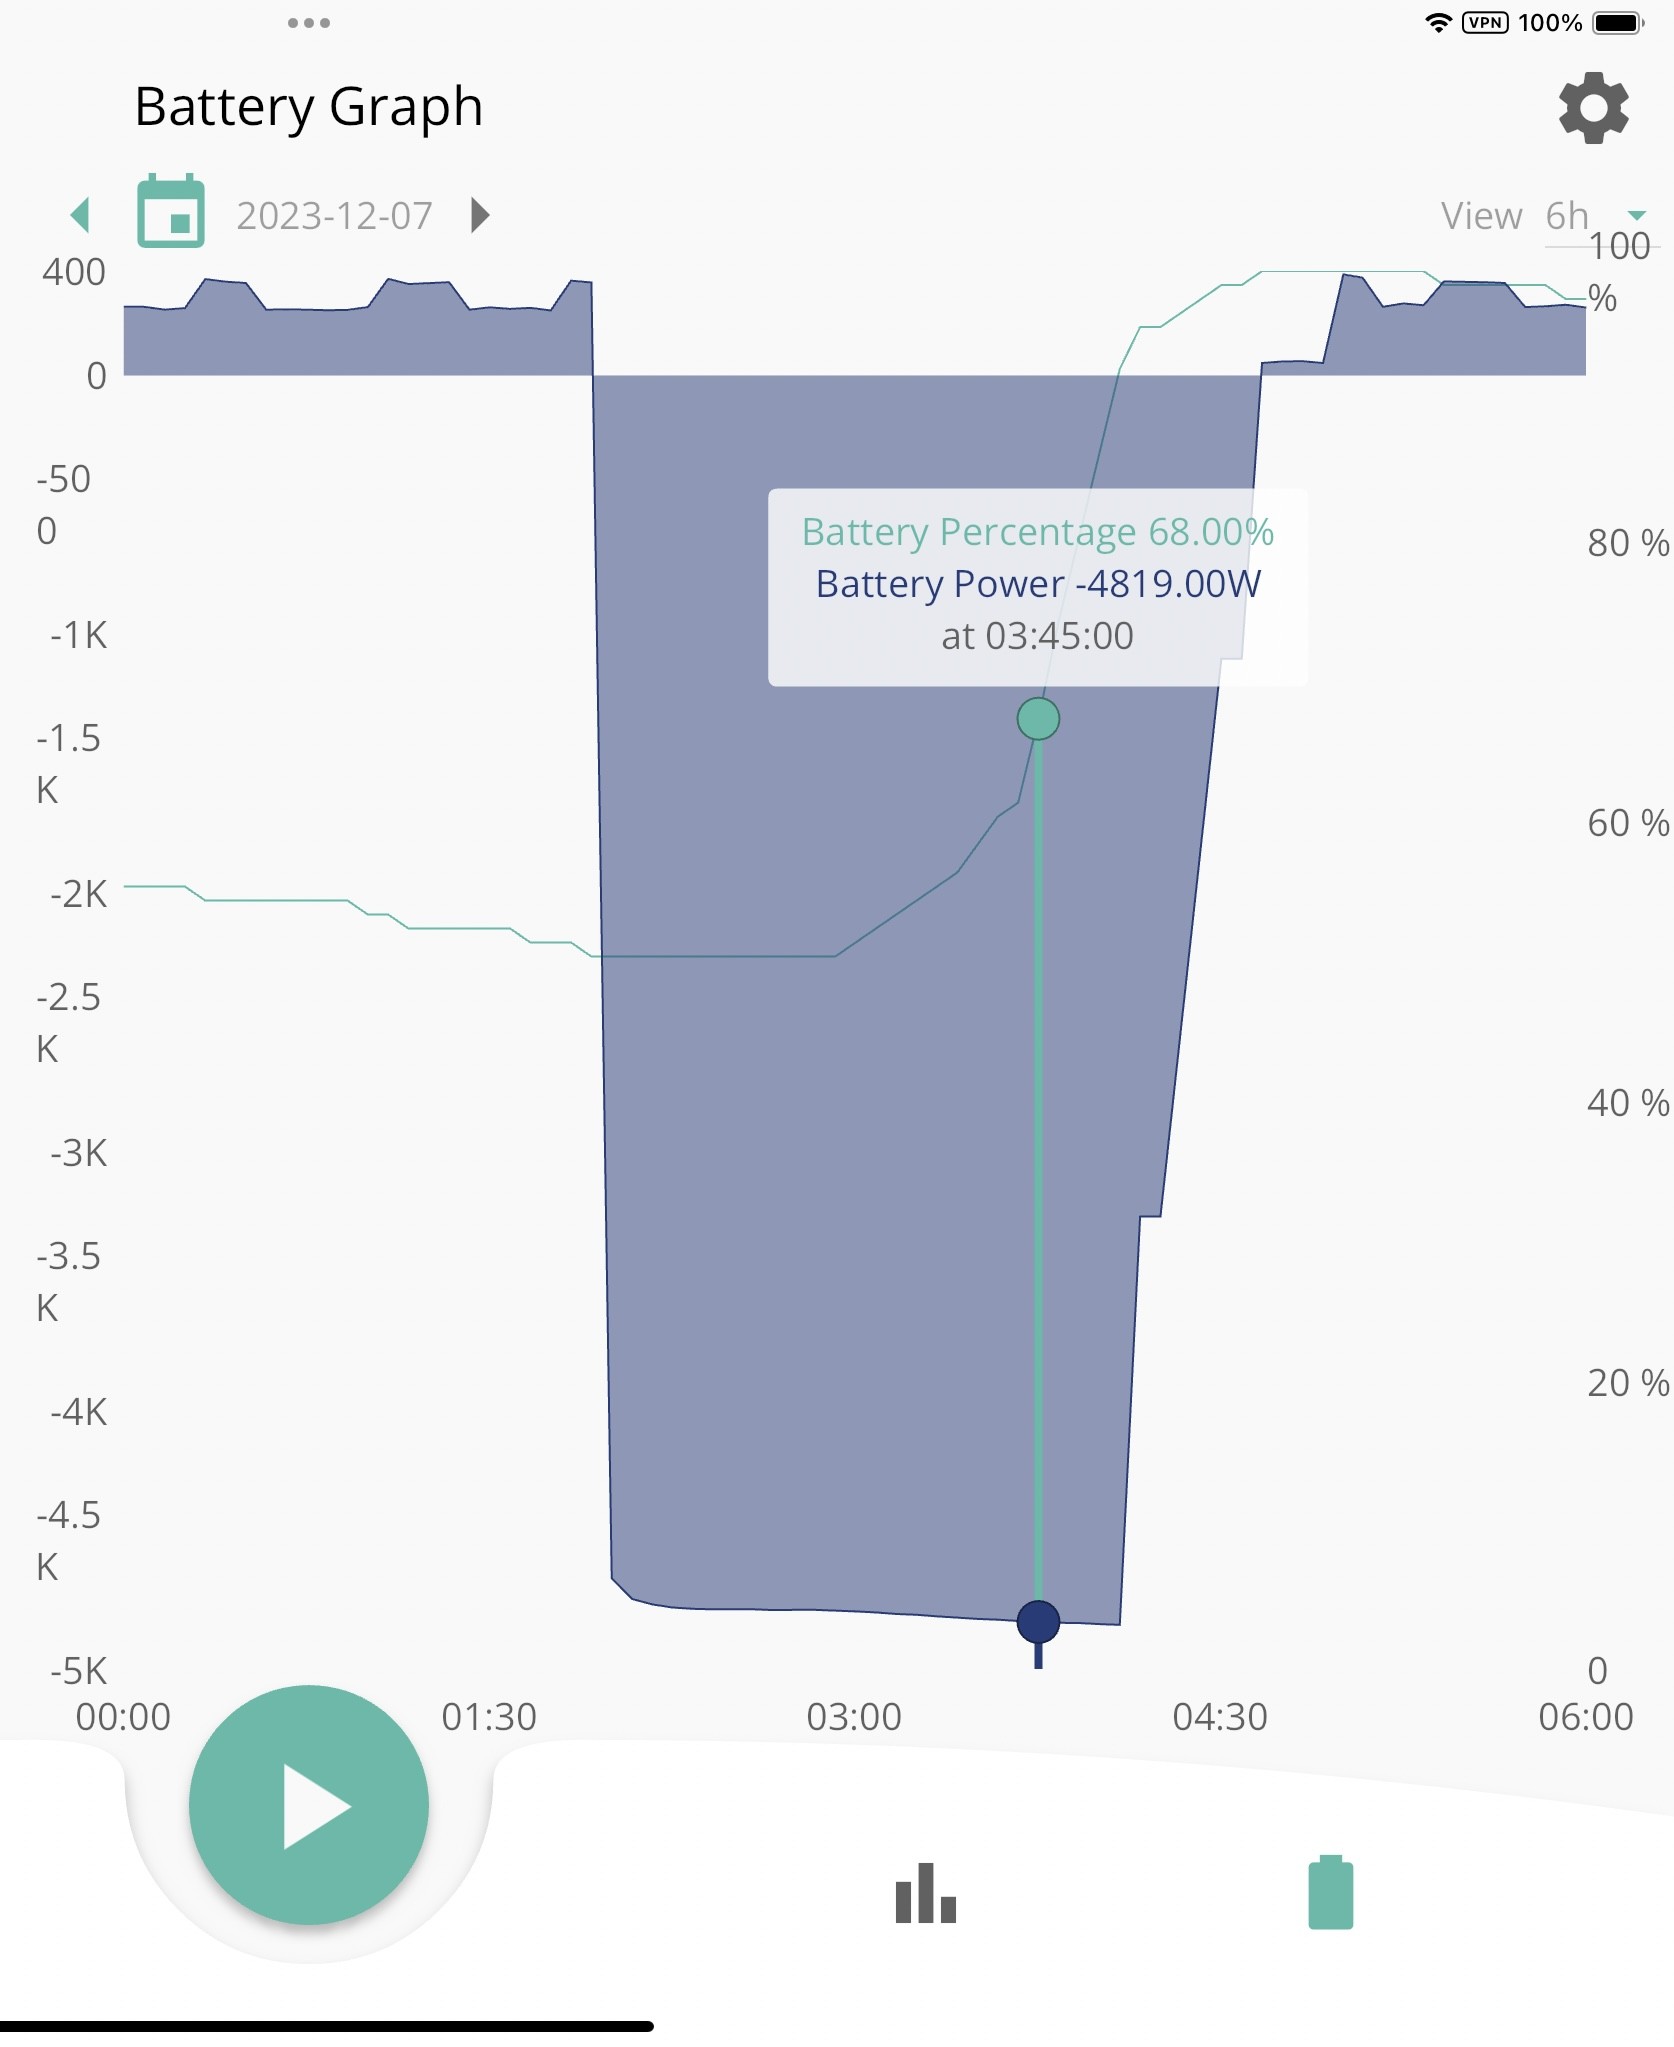
- I have witnessed 10 separate SOC drops, in each case the required power out from the device (based on an expected range of 13.5kWh) would have needed to be considerably more than the 6kW supported. This alone suggests the SOC algorithm is wrong: either the AIO was much closer to empty than the battery percentage expected - or alternatively, due to a flawed SOC, the BMS is stopping the battery from discharging prematurely, because it thinks it's empty when in fact there is still charge remaining.
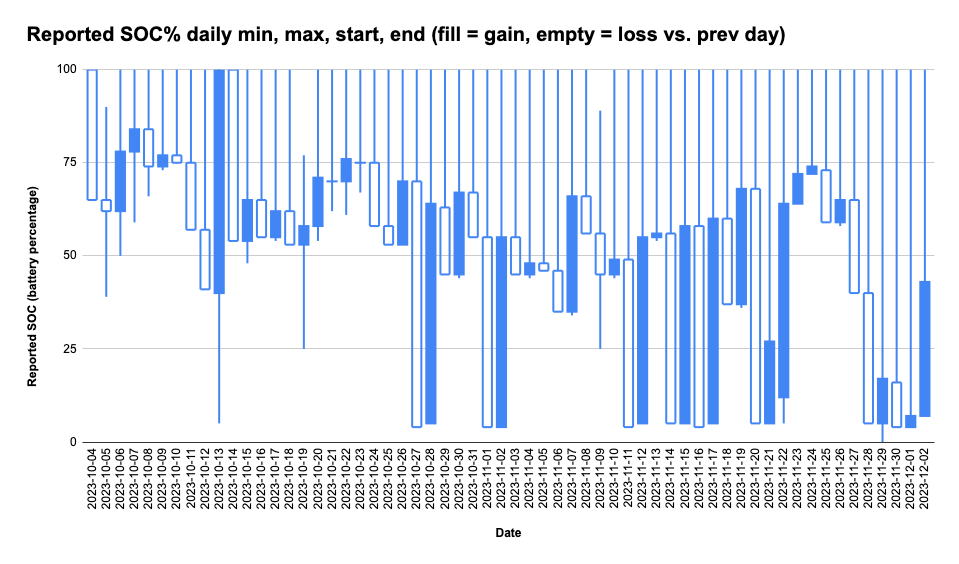
These SOC drops are almost perfectly correlated with when my AIO has got below a reported 25% SOC - see below candle chart which shows the reported SOC range by day, and the reported SOC at start / end of day. At other times the house load or solar production is such that the SOC% stays above 25%.
I then decided to try and calculate the SOC% for myself based on the PBat data field in the Inverter Data history. My maths was a simple approximation based on the area under the graph - effectively take multiplication of the PBat figure x the amount of time since the last data reading (in most cases 5 mins), expressed as a percentage where 100% = 13.5kWh. Over the course of the 2 months, the calculated SOC deviated from the reported SOC a lot. So I anchored the calculated SOC to start at the same figure as the reported SOC at midnight each day.
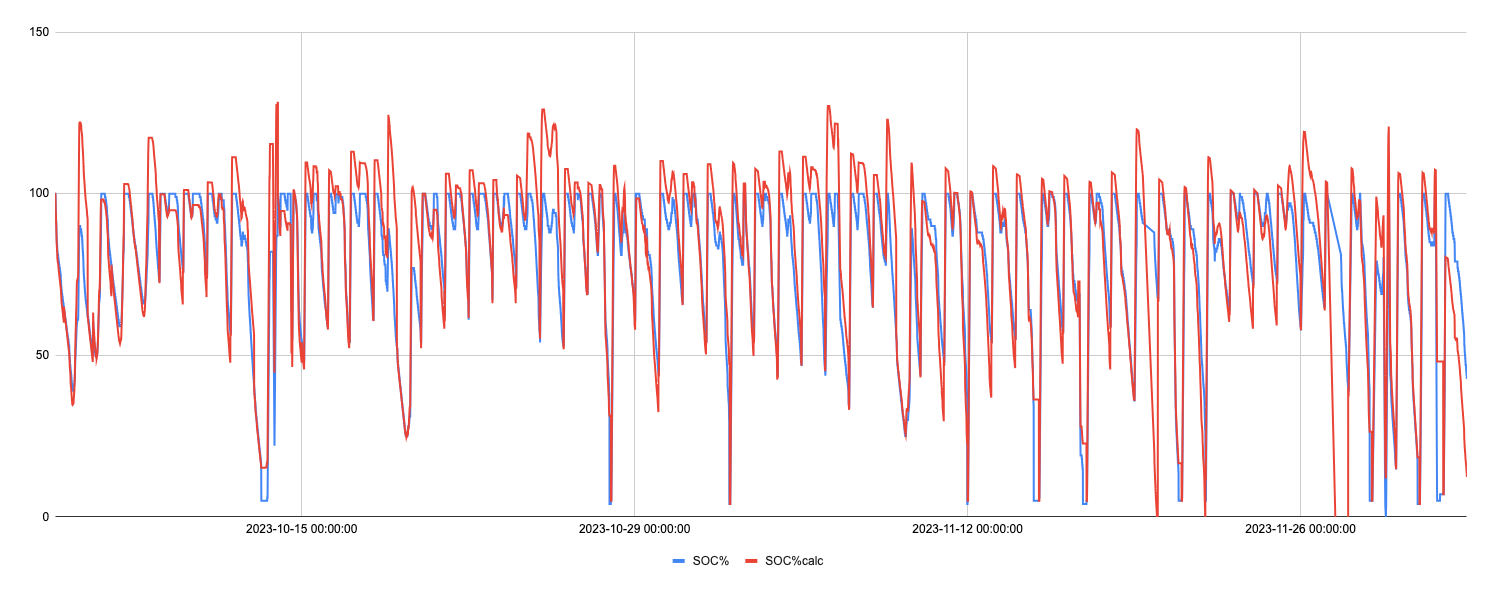
This chart plots both the reported SOC (blue) vs the calculated (red). Using this method, the calculation of SOC regularly overshoots the reported SOC 100% max - in some cases by 20-25%. It is rare that the report SOC blue line is above the calculated SOC in red. This strikes me as a somewhat intuitive result for two reasons:
1) the anchor of the reported SOC at midnight day is wrong
2) depending on how PBat is calculated / measured - there are significant losses in charging the battery - i.e. what goes in when charging is cumulatively more that what it stored / useful when discharging.
To hone in on #2 above, I identified the times when my AIO reported "full" or "empty" when reaching 100% SOC and 4-5% SOC respectively. I then calculated the cumulative change in PBat x time between these peaks and troughs - i.e. how much energy it takes to go from empty to full, and how much it reports going from full to empty.
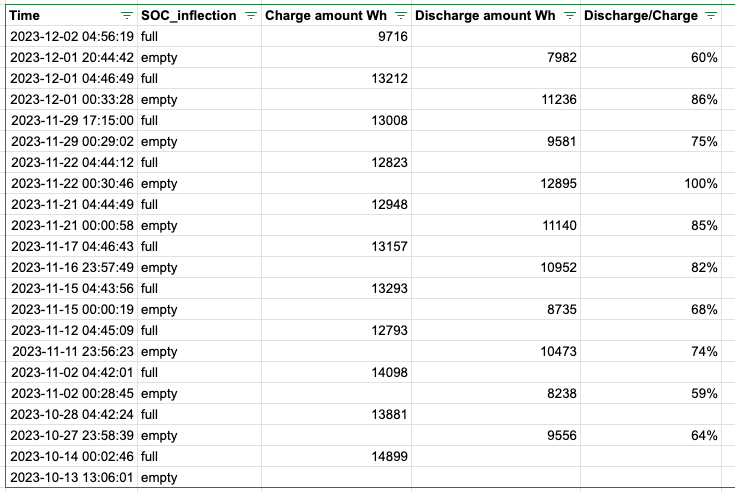
The difference was initially somewhat surprising to me - in most cases the AIO appears to be taking close to a full charge of c 13.5kWh, but what's coming out is often considerably less. This is particularly acute when there are a number of days between full and empty. Again my conclusion here is that the losses from partial charging and discharging are compounded.
And yet the last SOC drop for me was a quick return trip from full to empty during Friday's DFS event - I went from 100% SOC to 5% in just 80 mins - and this was just two days after a firmware update and calibration.
In conclusion
- I'm clearly getting a lot less than 13.5kWh out of my AIO when going from full to empty.
- The SOC% is not accurate.
- The losses from charging / discharging looks to be significant - potentially 20% of more