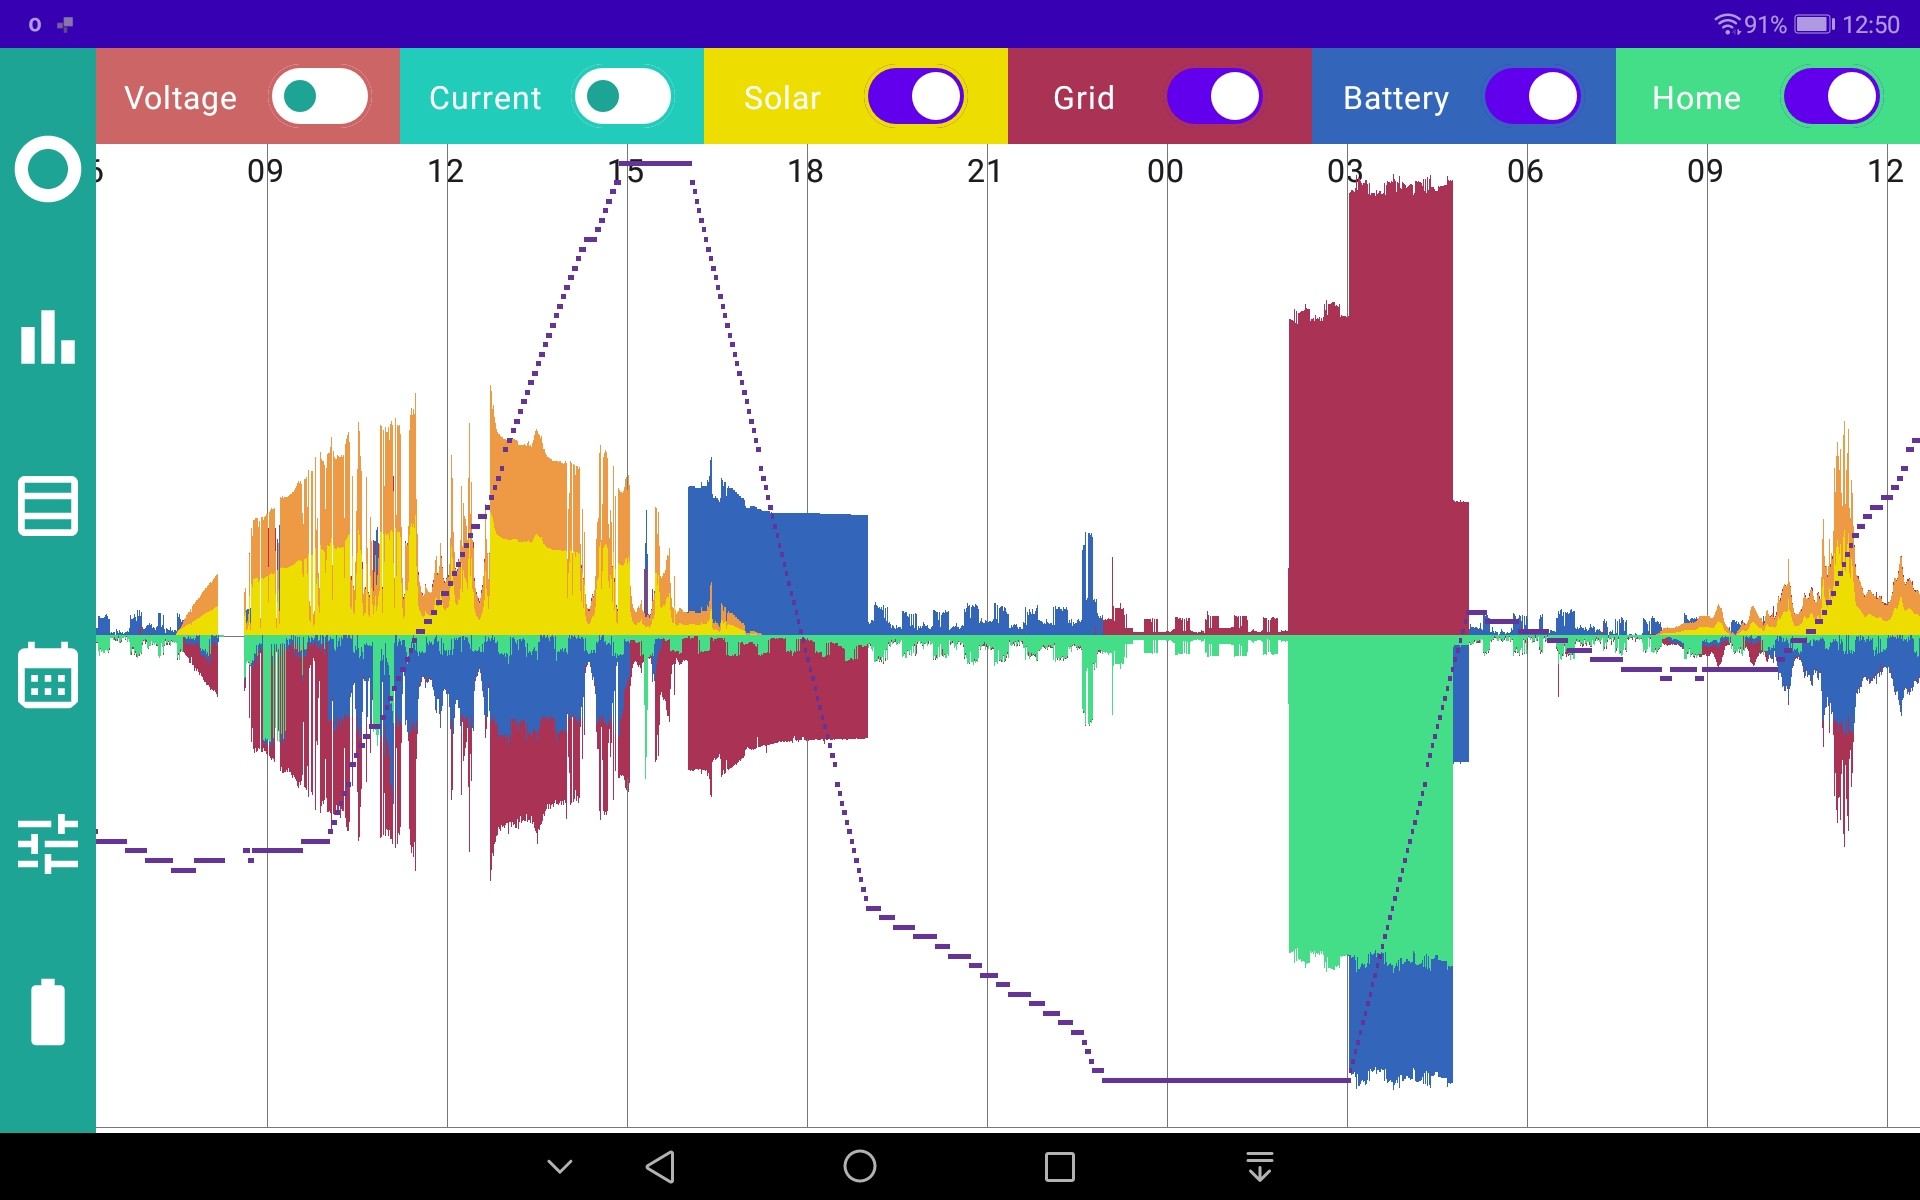
Today was very on and off sun because of fast moving clouds. It really highlighted what a daft scheme plotting five minute samples on the power graph is. Not only were the snapshots not representative but they weren't even self consistent. I.e. it could be exporting more than the solar was generating while the battery was idle.
A much better idea would be to read cumulative energy values every 5 minutes and plot the average power over that time on the power graph. That would give a much more representative and self consistent set of readings and graph. It would also remove the crazy spikes I get when my freezer turns on if it happens to be on a 5 minute sample point.
I don't hold out much hope of GE fixing it. Can it be done via GivTCP? I.e. can you read cumulative energy values?