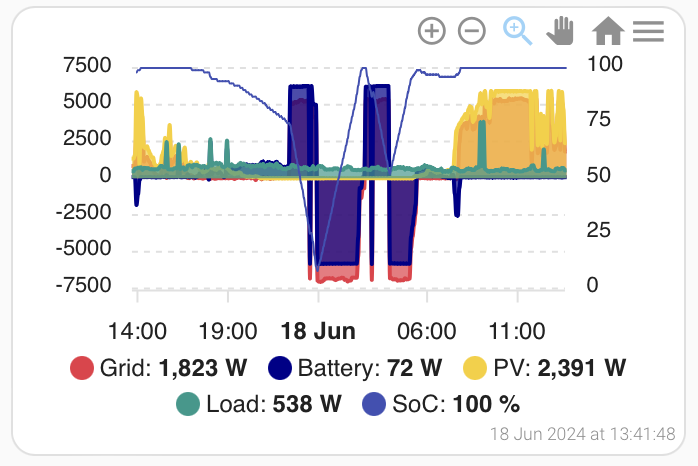
Hope nobody had Solcast info entered into GE portal and used Legacy Dashboard to get round the constant API calls because it seems the smooth dashboard is going and the laggy rubbish main dashboard is going to be forced upon us all.
K
#2killythebid
I have always liked the energy summary chart at the bottom but I don't use anything else on the legacy dashboard.
J
#3Jellybaby
killythebid I find normal one quite laggy on two different machines
C
#4CGoode
Never used the Legacy dash so it's not something I will miss.
S
#5SteveCook
Is there any YAML code out there to reproduce the current GivEnergy dashboard into Home Assistant.
I have tried Grafana but did not get far
#6PianSom
SteveCook
Not quite identical, but this is where I am with mine. Happy to share yaml if you want it? Uses apex charts.
B
#7Brassy
It will be a significant loss. The new dashboard and My Inverter pages do not allow many of the same parameters to be shown on a single graph.
Instead of trashing the old graph, why can't GIV migrate them to the "my Inverter" pages?
T
#8TonyAbse
Its a backward step,why is it being phased out?
#9hoggy
I guess I could resurrect the local dashboard (via API) if there's much of a call for it.
It's long dead now since the GivTCP changes but the original thread is still here and can probably be made to work no bother with just an API key these days as opposed to the old way which needed powershell running in the background.
D
#10Daveb01
I like the What New page (last updated in 2022) 😡🙁🤬
This week we're excited to finally announce the release of our Smart Plugs! These 16A plugs can be controlled via the GivEnergy app (for now, portal control is coming soon!) which can also be used to monitor plug power, energy, and cost (assuming you've set up your smart tariff information). The plugs will be available to buy from the 30th September - get in touch with our wholesaler Segen or give our support team a call to find out more.
A few months ago we spoke about releasing the GivEnergy Alexa skill, which can be used to monitor your system's power and energy. Unfortunately at the time we ran into some unforseen snags with Amazon's approval process which meant we had to delay the skill until we had everything figured out. During that time we planned on releasing our Smart Plugs which we wanted to integrate into the Alexa skill which delayed the release even more. Well, it's finally time to announce that the skill has been approved and is available to download now from the Alexa Skills store! Simply search 'GivEnergy' on the Alexa app or ask Alexa to enable the GivEnergy skill. Alexa will prompt you to link your GivEnergy account which you can do via the Alexa app.
D
#11Daveb01
20/09/2021 - Hello World!
Hi everyone! This is the first of a (hopefully) weekly blog brought to you by the developer team here at GivEnergy. We'll be using this space to keep you updated on anything new that we add, fix or change that may impact how you use the new portal.
S
#12SteveCook
PianSom
Yes please. I would love your YAML and and some help of what to do with it - no pun intended
Then, in HA, edit a dashboard of your choice (pencil icon top right of Overview, for example), then hit the blue "+Add Card" bottom right. Scroll down to the "Custom: ApexCharts Card" item and click it. Take the code from below and edit it to have your serial number in instead of XXXXXXX (5 times). In the custom card, replace the code on the left side with your code just edited. Hit "Save" (bottom) and then "Done" (top).
Play with the various parameters in the code until you are happy/bored.
Enjoy!
type: custom:apexcharts-card
experimental:
  color_threshold: true
header:
  show: false
  floating: false
  title: Last 24h
graph_span: 24h
show:
  last_updated: true
  loading: true
apex_config:
  chart:
    zoom:
      type: x
      enabled: true
      autoScaleYaxis: false
    toolbar:
      show: true
      autoSelected: zoom
    xaxis.type: datetime
series:
  - entity: sensor.givtcp_XXXXXXXX_grid_power
    type: area
    name: Grid
    yaxis_id: power
    color: EA3546
    group_by:
      func: last
      duration: 5m
    stroke_width: 2
    extend_to: now
    show:
      extremas: false
      header_color_threshold: true
  - entity: sensor.givtcp_XXXXXXXX_battery_power
    type: area
    name: Battery
    yaxis_id: power
    color: darkblue
    group_by:
      func: last
      duration: 5m
    stroke_width: 2
    extend_to: now
    show:
      extremas: false
      header_color_threshold: true
  - entity: sensor.givtcp_XXXXXXXX_pv_power
    type: area
    name: PV
    yaxis_id: power
    group_by:
      func: last
      duration: 5m
    color: f9ce1d
    stroke_width: 2
    extend_to: now
  - entity: sensor.givtcp_XXXXXXXX_load_power
    type: area
    name: Load
    yaxis_id: power
    group_by:
      func: last
      duration: 5m
    color: 1B998B
    stroke_width: 2
    extend_to: now
  - entity: sensor.givtcp_XXXXXXXX_soc
    type: line
    name: SoC
    yaxis_id: soc
    color: 3f51b5
    group_by:
      func: last
      duration: 5m
    stroke_width: 1
    extend_to: now
    show:
      extremas: false
      header_color_threshold: true
yaxis:
  - id: power
    align_to: 500
    min: ~-7500
    max: ~7500
    apex_config:
      tickAmount: 6
  - id: soc
    min: 0
    max: 100
    opposite: true
    apex_config:
      tickAmount: 4
If like me you have your GivTCP sensors configured to kW rather than W, change the yaxis code at the bottom to the following. If need be, change min and max to your inverter output, mine is 5kW, an AIO is 7.5, etc
Just for those that don't know - the "~" in front of the min/max fields means "use this value for setting the axis value but if the actual data value being shown is smaller/bigger then use that (rounded) instead".
What this means in practise for me is - most of the time I have a +/- 7.5kW left y-axis graph. But occasionally (eg when I have a Power-up) I could be importing say 10kW and in that case it would use 7.5kW to -10kW left y-axis.
S
#16SteveCook
PianSom
Thanks for sharing. Grandparent duties tomorrow, so give me a few days and i will do it.
Ta Steve
J
#17Jellybaby
Can GivTCP still not show the battery voltage on AIO's?
#18PianSom
Jellybaby
The beta can show voltages for individual cells. See here for an example
A
#21Ange
killythebid I like the energy summary at the bottom too. Lets me see all my data in one place. I would be interested to know if anyone can tell me how else I can do this (easily!), thanks.