D
#1 Daveb01
Hi all, I have started this post as there are a few new things available plus it would be good to compare what others have in there settings.

Hi all, I have started this post as there are a few new things available plus it would be good to compare what others have in there settings.
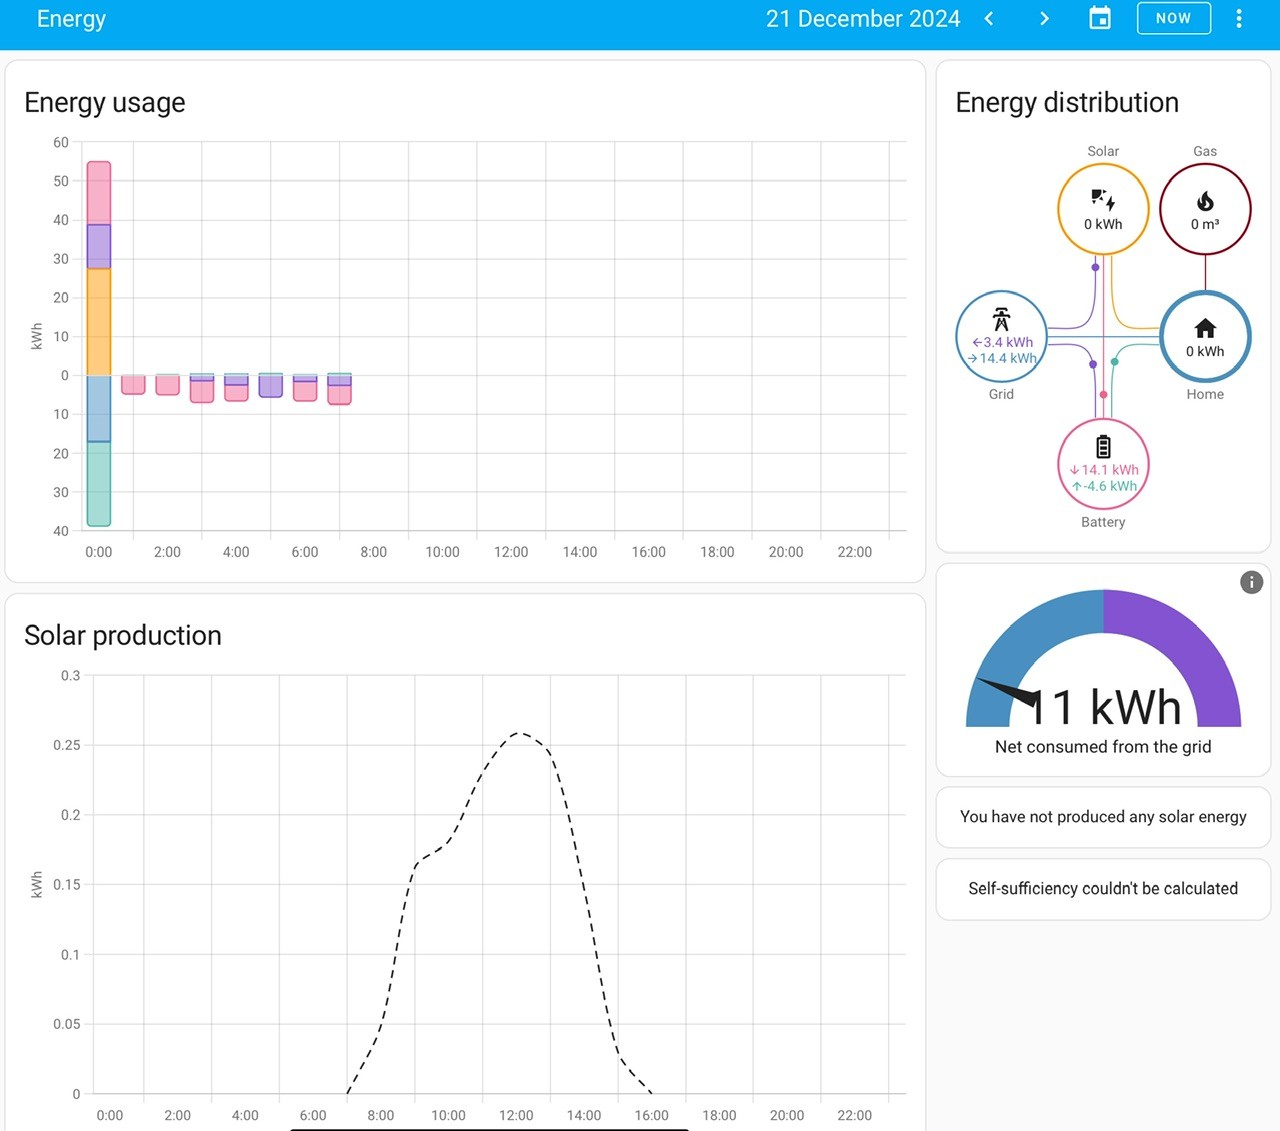
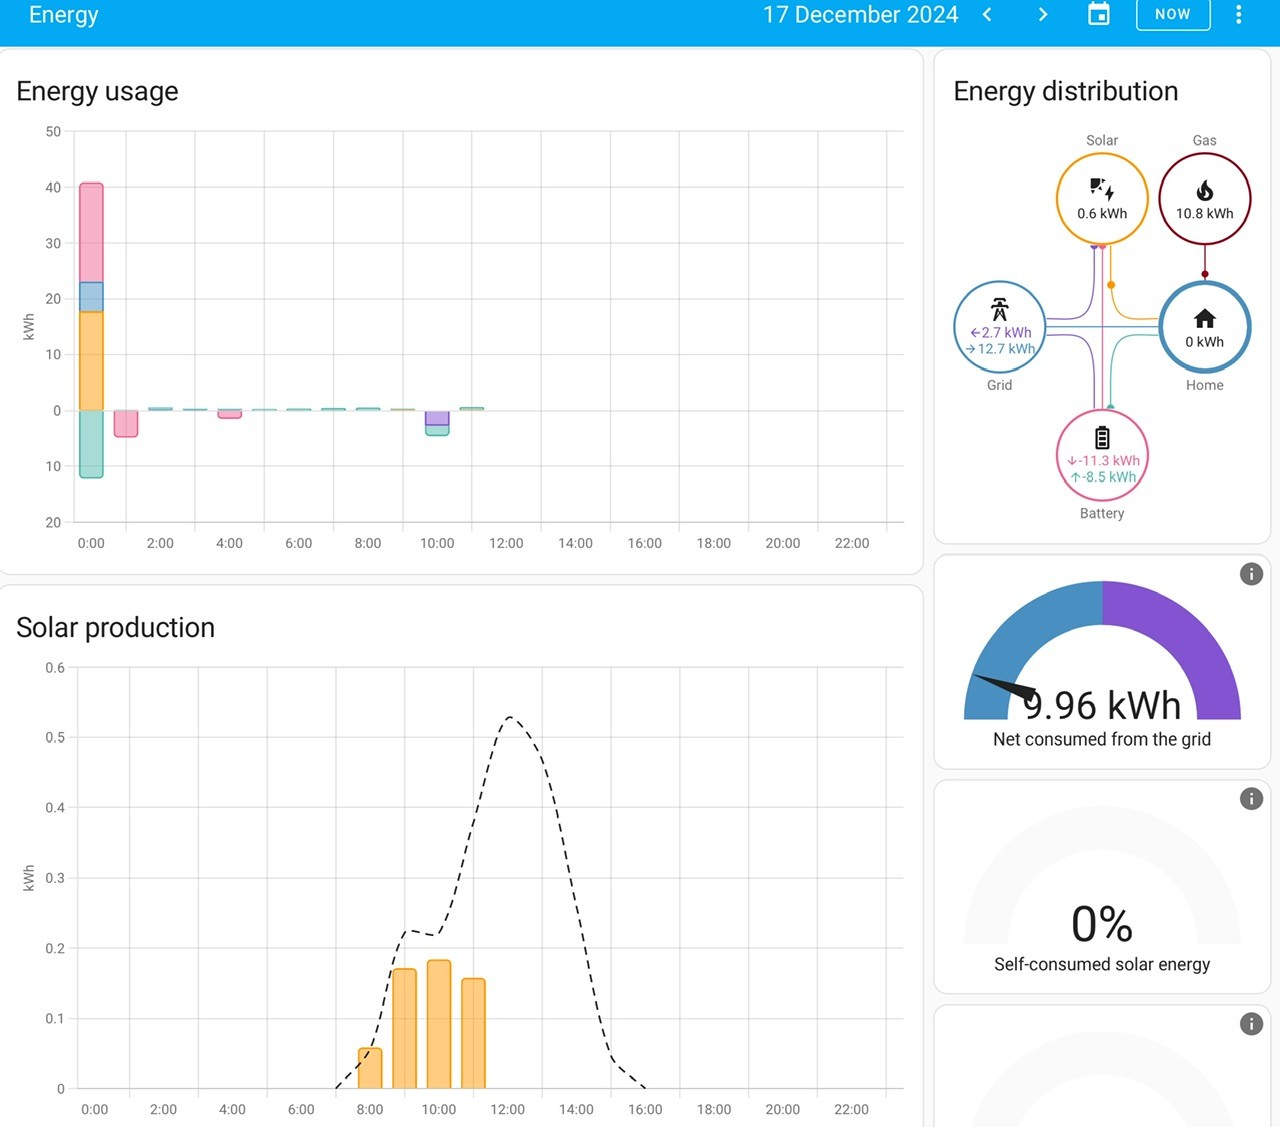
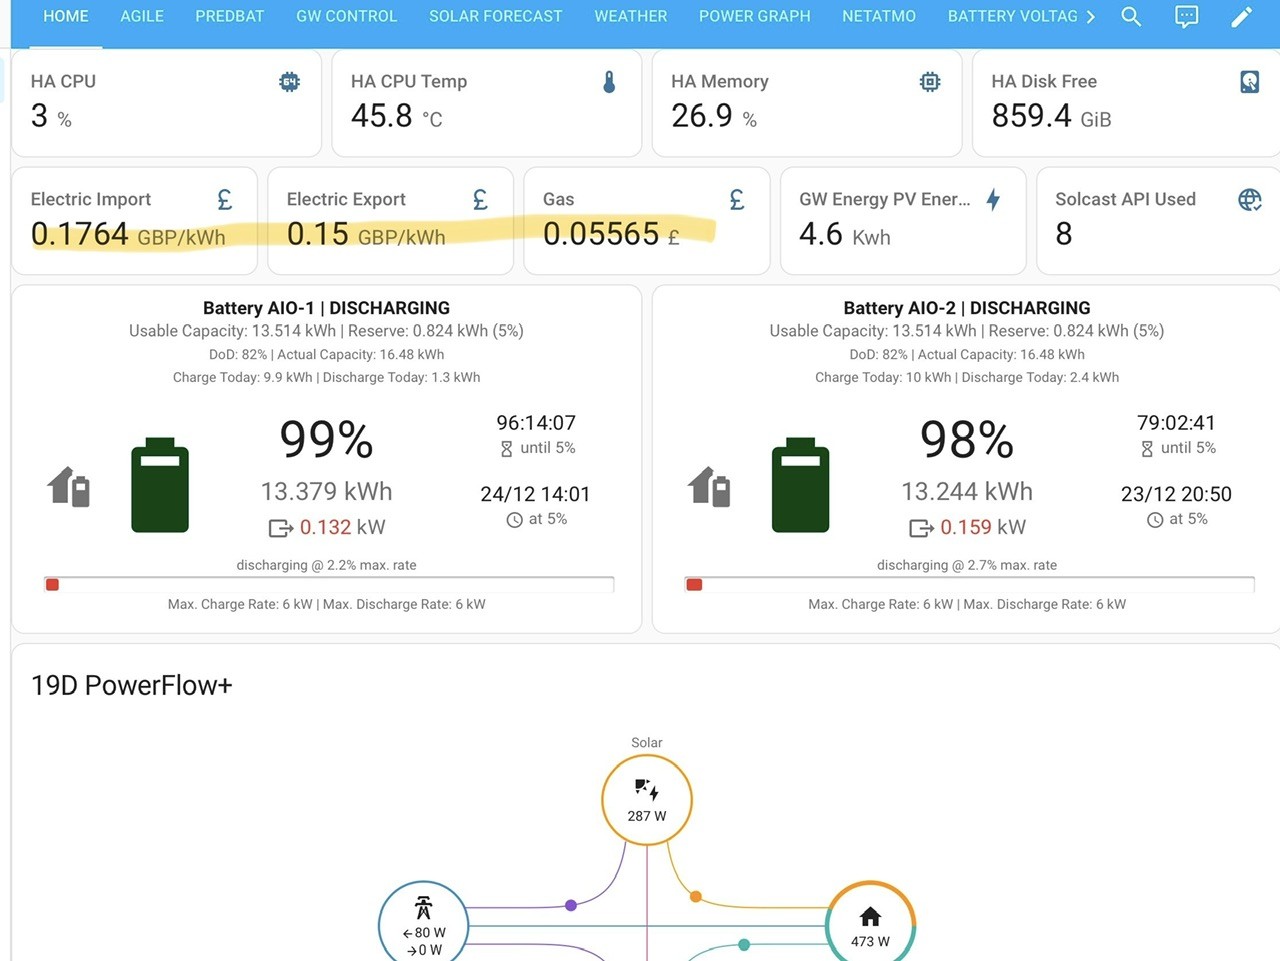
Here is my Cards.
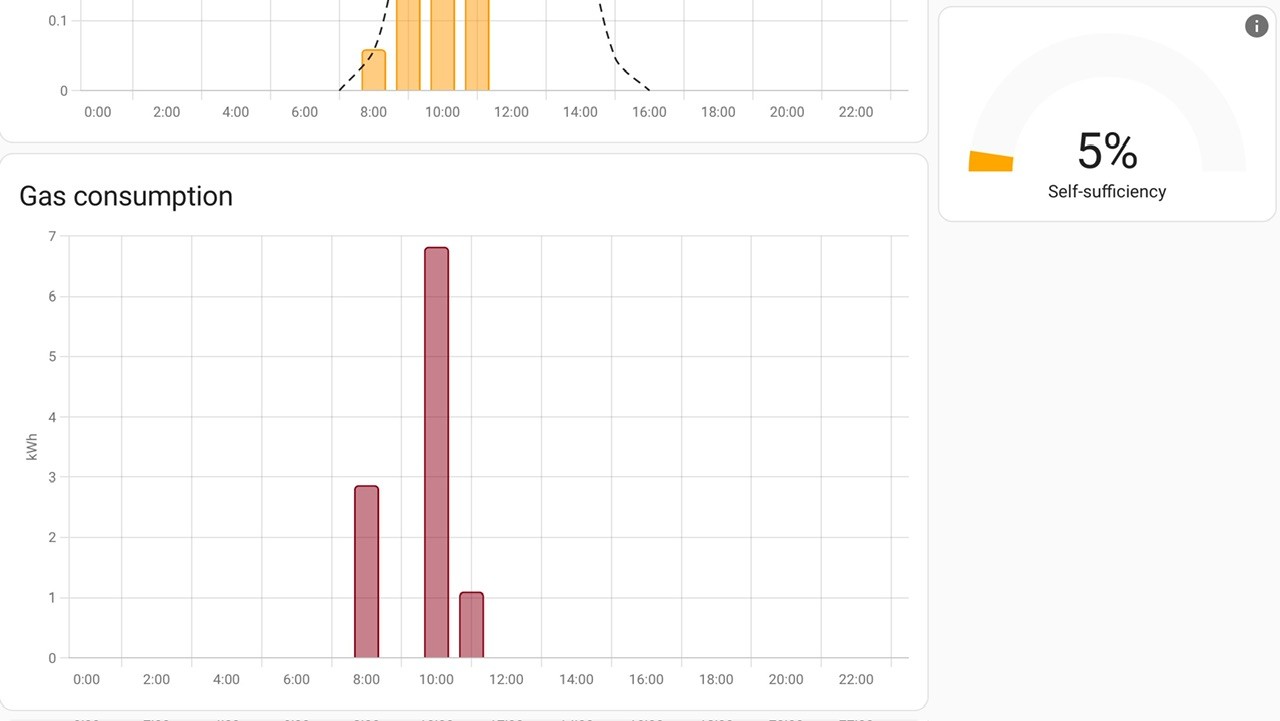
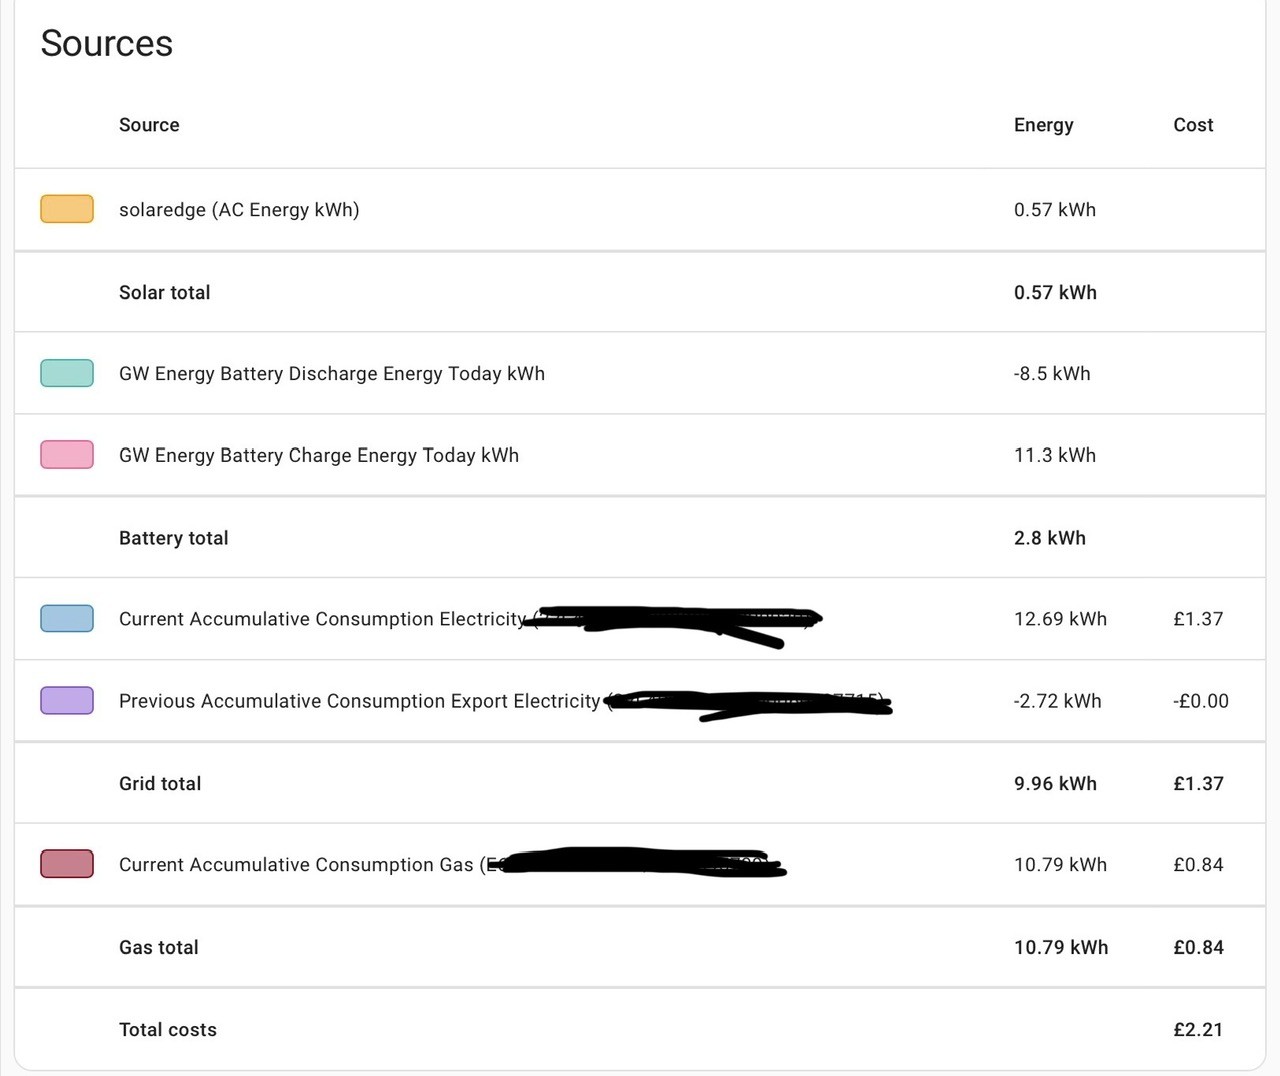
Sorry I forgot to add these bits in as well.
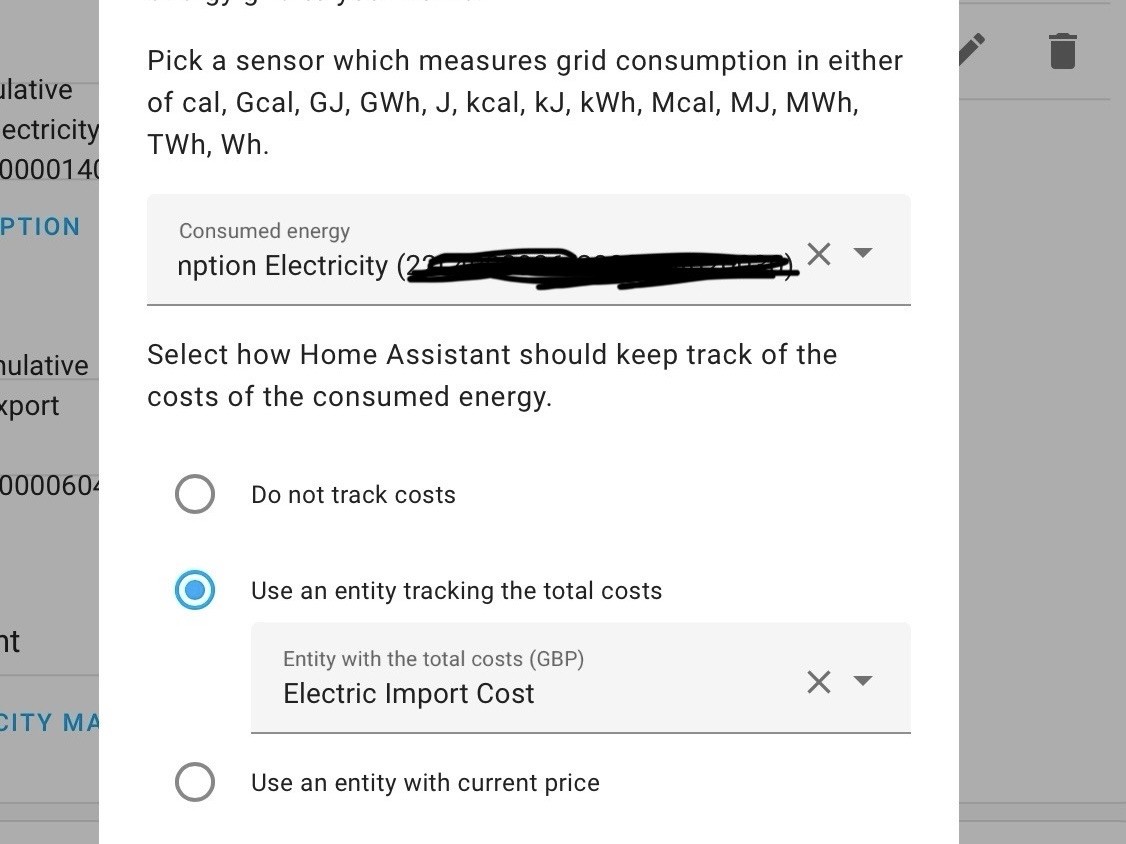
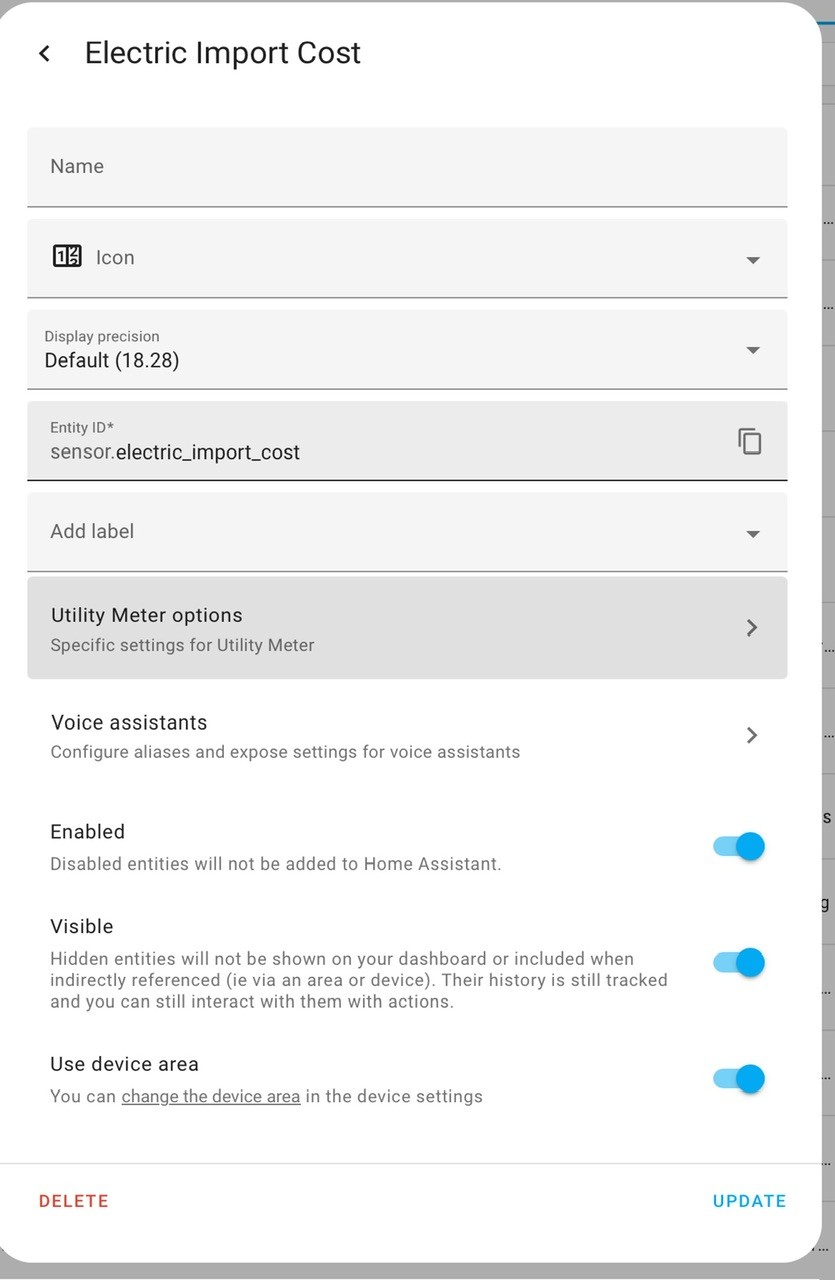
So what I would like to achieve is the readings and graphs match what Octopus says in there app.
I have sorted the Solar as that matches PV generation exactly
I have sorted the Battery as that matches (probably because it comes from the GW)
My logic was if I used the meter sensors It would match Octopus, but it seems I have got something wrong.
Daveb01 There’s a couple of things I can see wrong with your energy card.
Firstly, swap to using the ‘total’ energy kWh sensors instead of the today charge/discharge and solar generation sensors, this will prevent the ‘midnight jump’ you see in your energy dashboard.
See https://community.givenergy.cloud/d/5384-spurious-givtcp-readings-in-ha-energy-dashboard/2
Secondly, we can improve on your import and export in the energy dashboard. The energy dashboard guide at the Octopus Energy integration gives you the steps to follow https://bottlecapdave.github.io/HomeAssistant-OctopusEnergy/setup/energy_dashboard/ but now I look at what I wrote I can see that it can be simplified further (and it doesn’t cover export).
You need a mechanism to record your import and export energy. If you have an Octopus Home Mini or Pro that will do the import (and will match your Octopus account readings), but it doesn’t cover export.
In the guide I propose that you use the GivTCP inverter import and export meters, in my experience these are accurate enough and updated every 30 seconds rather than relying on the vagaries of Octopus processing the smart meter readings. It also means your energy dashboard will be independent of Octopus if you move to a different supplier.
You’ll notice that the guide proposes creating a utility meter for the consumption sensor but now that we know that the dashboard will take either today or total sensors, this utility meter isn’t necessary.
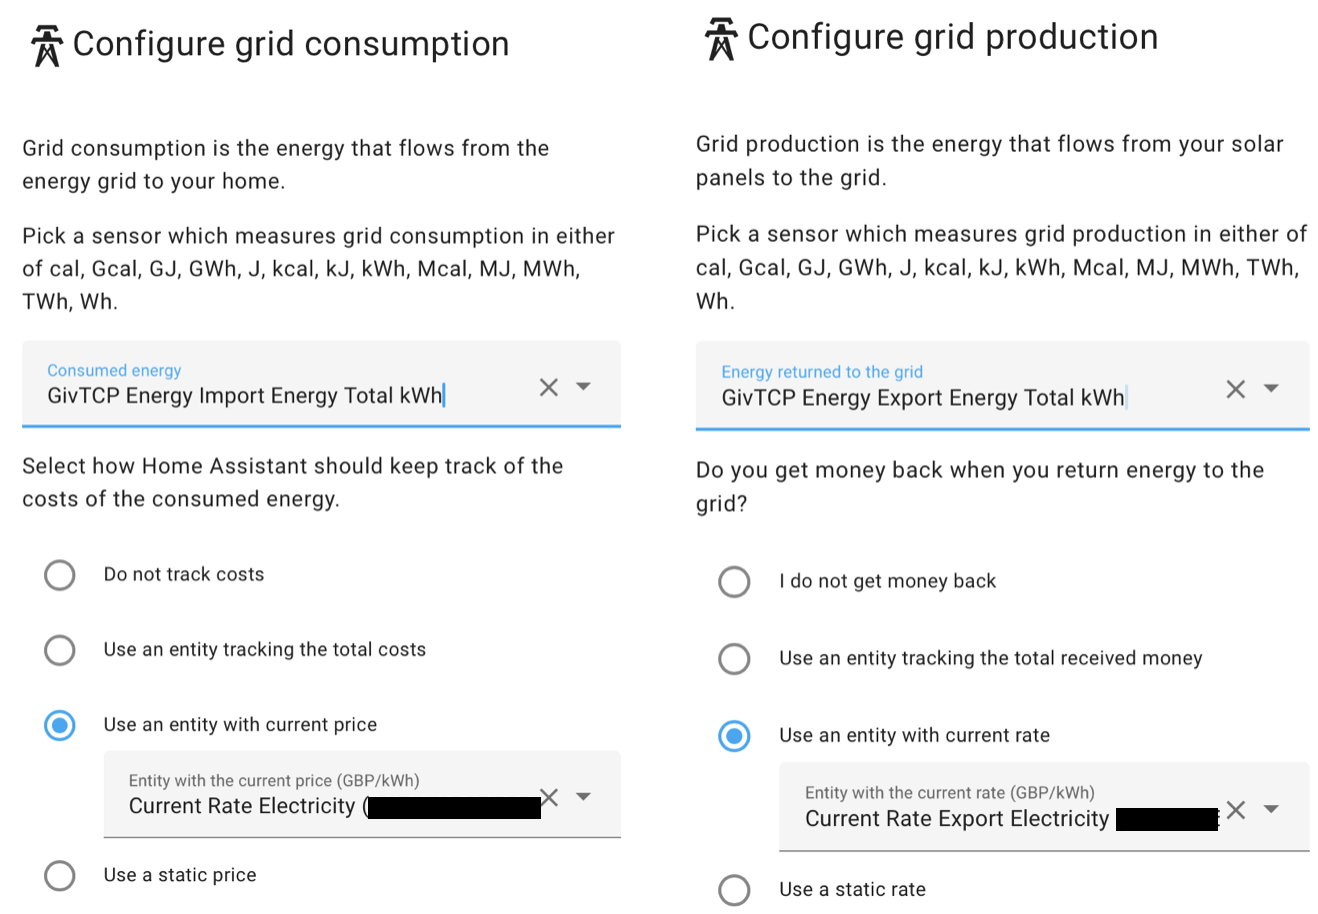
For import you can use sensor.givtcp_xxxx_import_energy_total_kwh (or _today_kwh) as the input sensor and “current rate electricity” as the entity giving current cost. You can use the cost sensor as-is, it doesn’t need a utility meter wrapping round it as you have.
For export you are at the moment using the Octopus ‘previous accumulative consumption’ sensor which is only updated when Octopus receive your smart meter export readings on the day afterwards. So it’ll be a day wrong.
Instead you can use sensor.givtcp_xxxx_export_energy_total_kwh (or _today_kwh) as the input sensor and “current export rate” as the cost.
Sorry for the delay, I have been busy with other jobs and Christmas lunches out.
I have hopefully done what you have advised. Part one (see pics)
I had set it up the same as Speak to the Geek. It did not do what I wanted, so I changed it to what I thought was correct (a newbie mistake) now I have been promoted to Rabbit I do not want to be sent back down the hole 😀)
I have deleted the Helpers and started again, no helpers created this time.
Q1. I have set it up but not configured the Cost bit. Have you done this? If yes what do I add in this section please for Import and export)
Q2. I am now not sure about the Gas config, where can I find this setting (yes I have an Octopus Mini).
Very sorry I should have RTFQ, you have said what to set in the cost bit doh
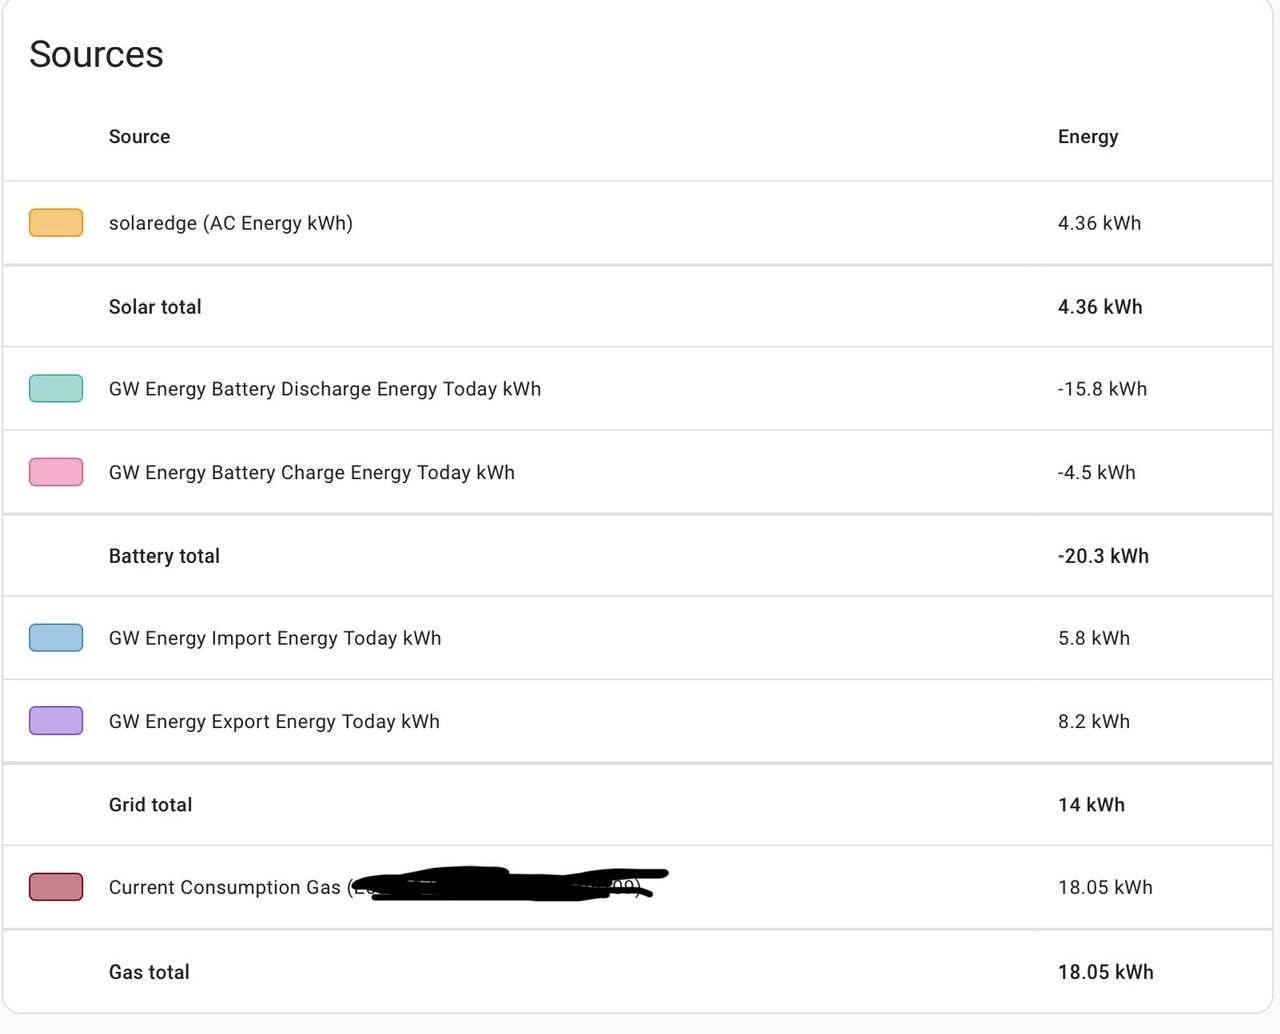
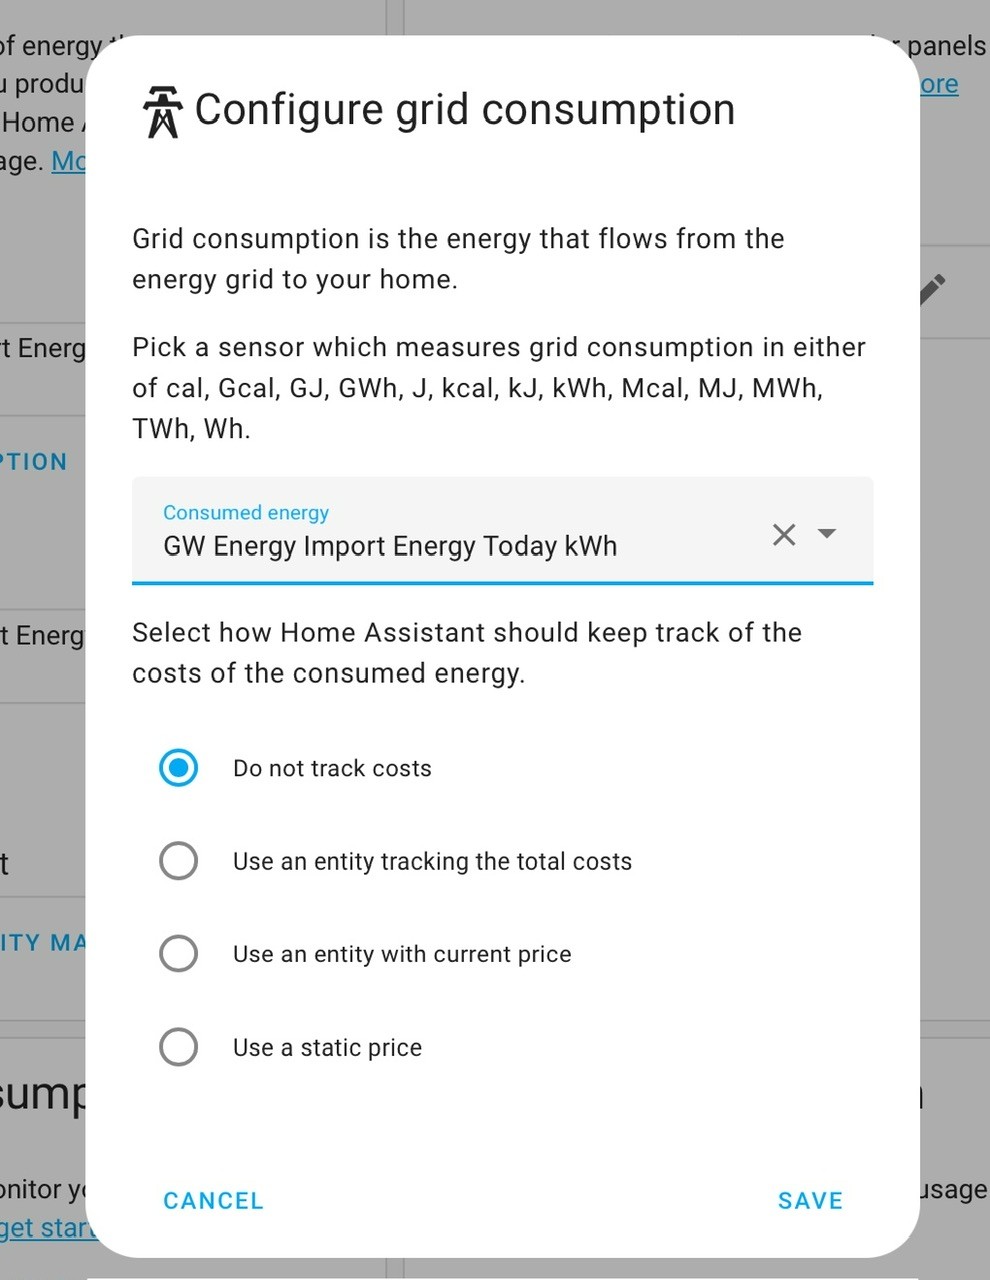
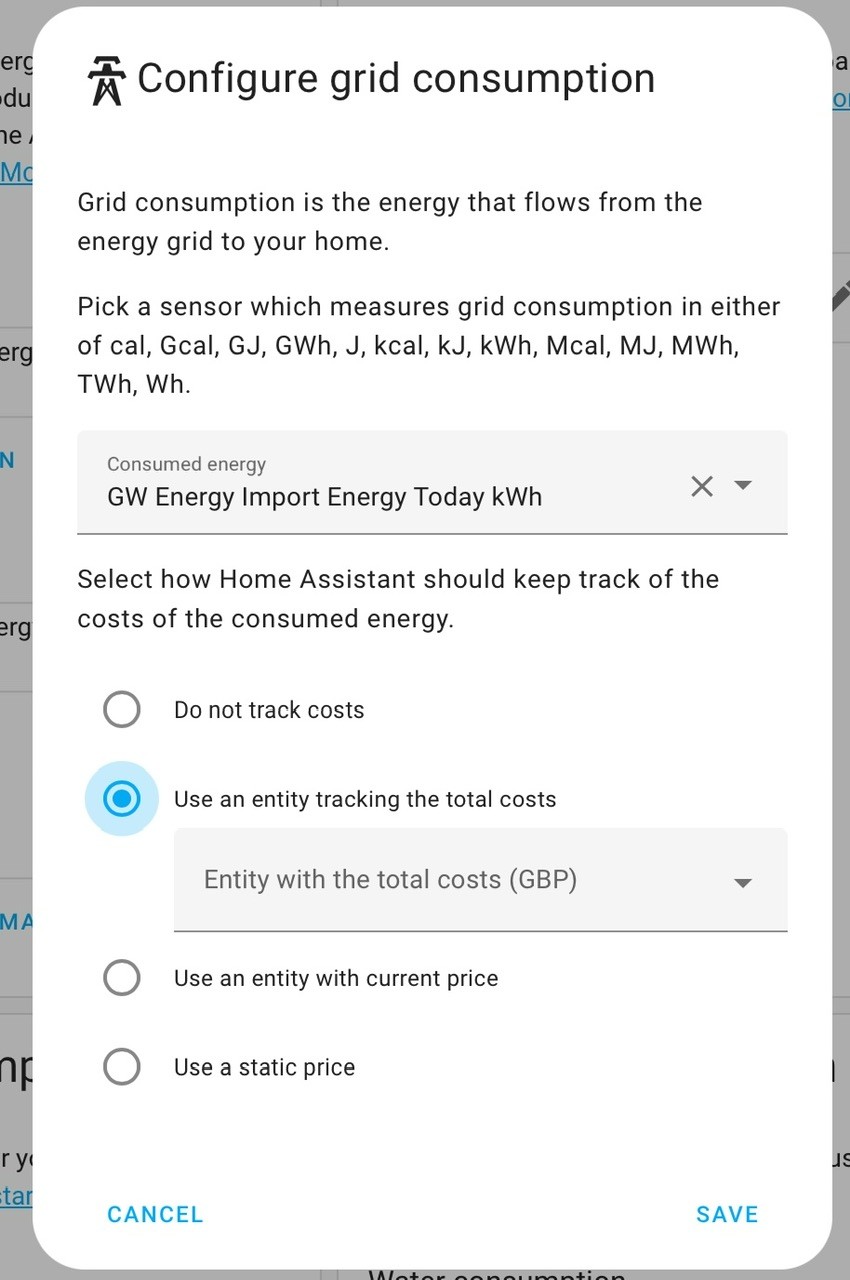
My last request (but no hurry), I would like to set up a card to display my current Cost per Month for Import/Export/Gas in £ that match the Octo app please.
My initial thought is I will have to create a helper?
Daveb01 Q1. I have set it up but not configured the Cost bit. Have you done this? If yes what do I add in this section please for Import and export)
Q1 I think I have answered in the original post geoffreycoan, simplest option (which I use) is to use the ‘current rate electricity’/‘current export rate’ sensor
Q2. I am now not sure about the Gas config, where can I find this setting (yes I have an Octopus Mini).
I don’t have gas so no personal experience, but the instructions in the Bottlecap dave documentation cover what entities to use if you have an Octopus Mini and a Smart Gas meter https://bottlecapdave.github.io/HomeAssistant-OctopusEnergy/setup/energy_dashboard/#for-gas
Daveb01 My last request (but no hurry), I would like to set up a card to display my current Cost per Month for Import/Export/Gas in £ that match the Octo app please.
The wrinkle here is that there whilst the ‘current accumulative cost electricity/gas’ sensors in the Octopus integration track your daily cost, they reset at midnight. And the export sensor (previous accumulative cost export electricity) is only populated the day afterwards when the smart meter data reaches Octopus.
So wrapping a utility meter around these won’t work.
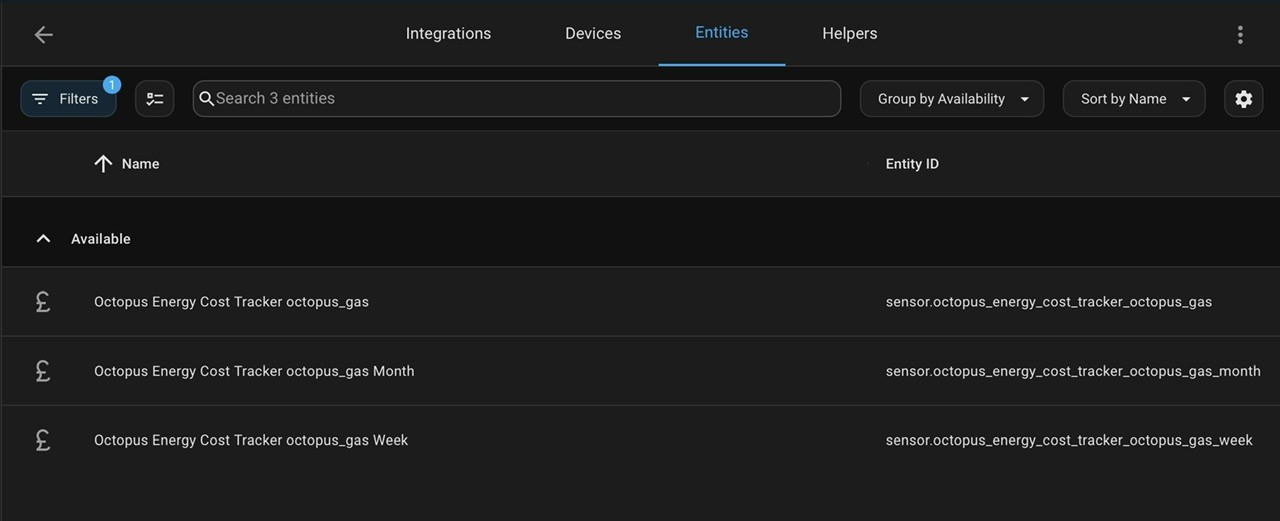
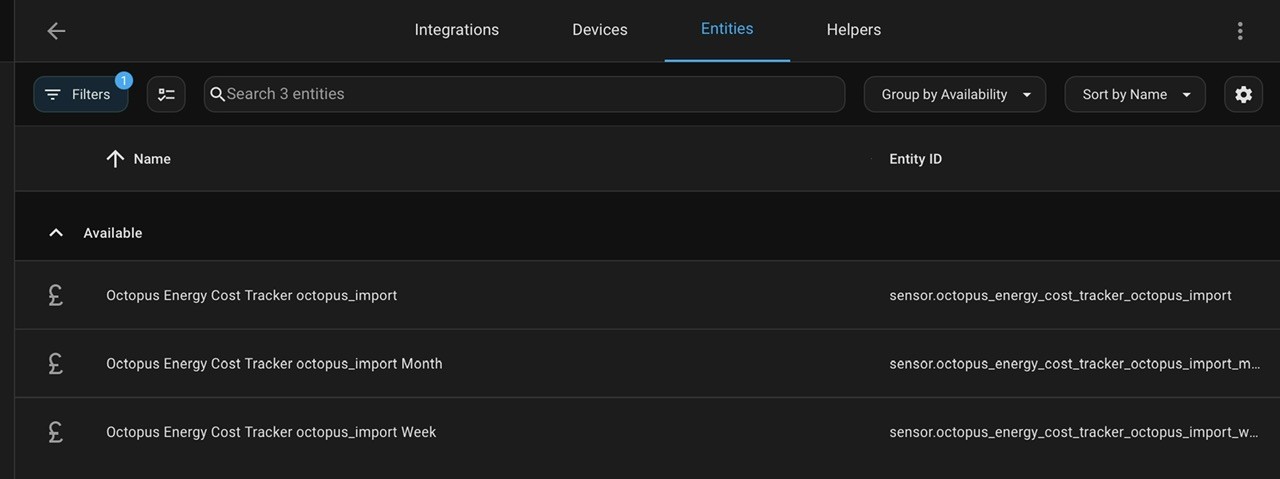
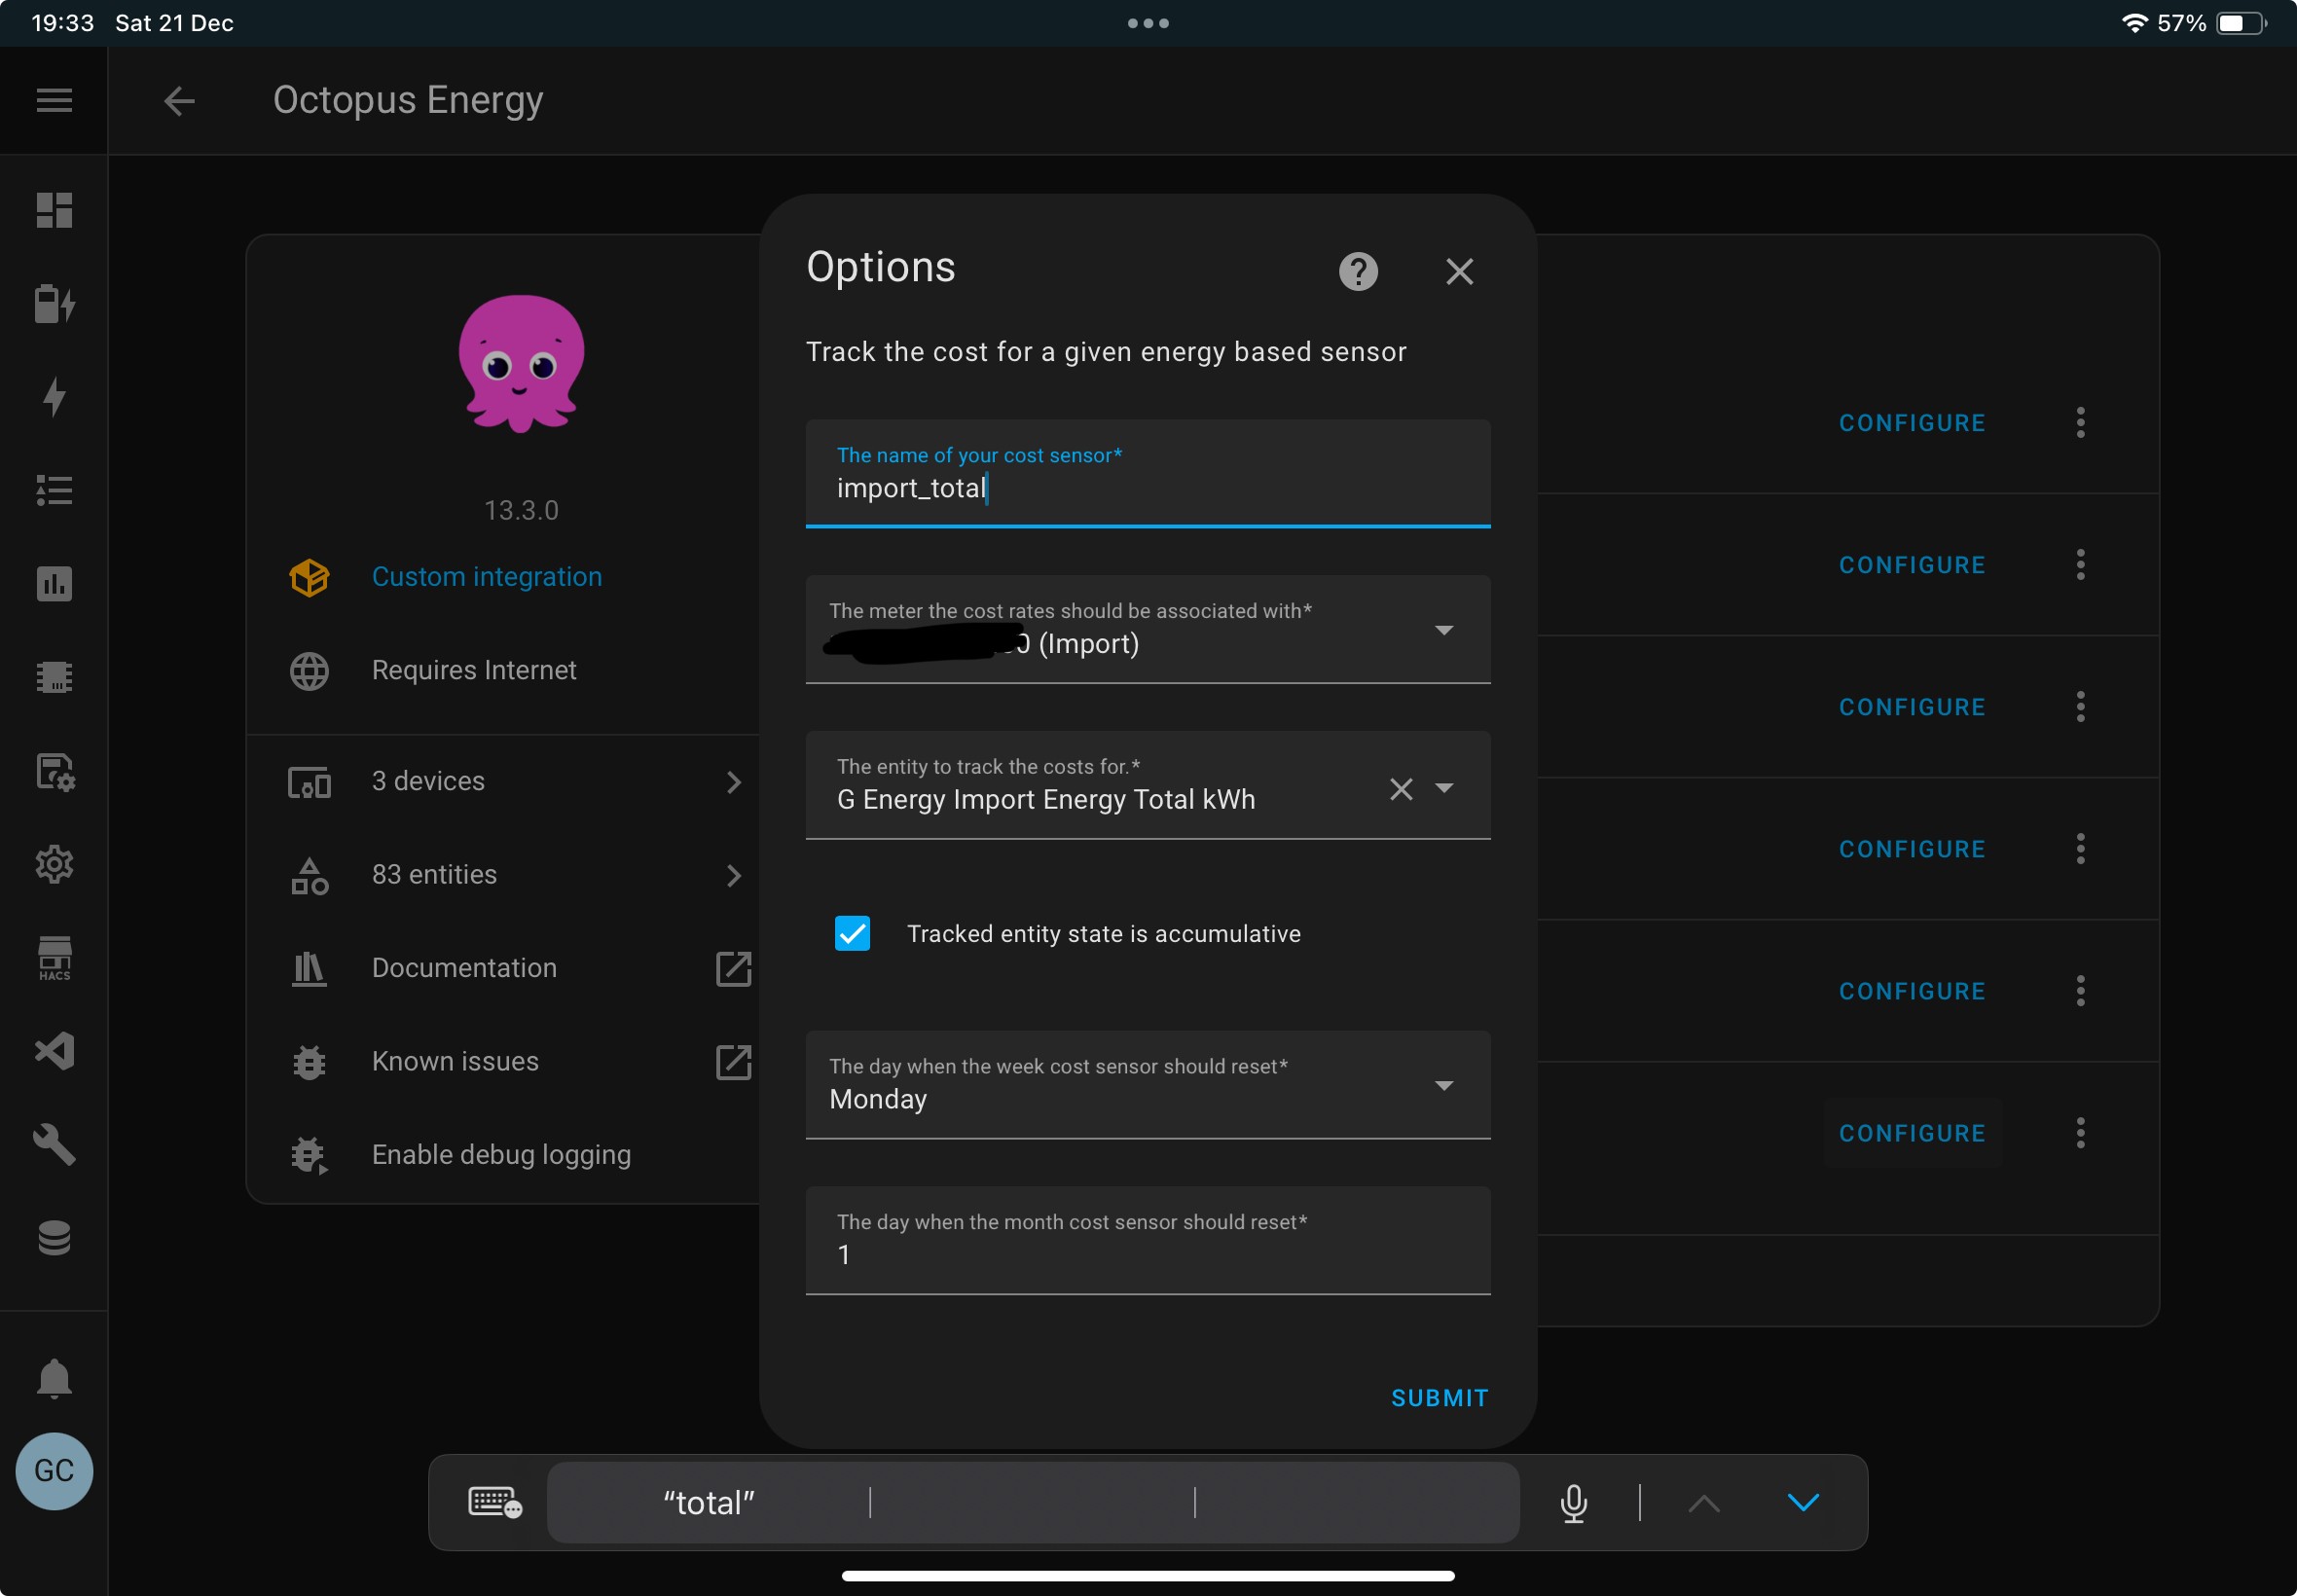
Instead I think you will need to create a cost tracker entity using the Octopus integration
https://bottlecapdave.github.io/HomeAssistant-OctopusEnergy/setup/cost_tracker/
This isn’t something I have personally ever done, I just use the Energy dashboard and set the time period to ‘current month’
Steps to follow:
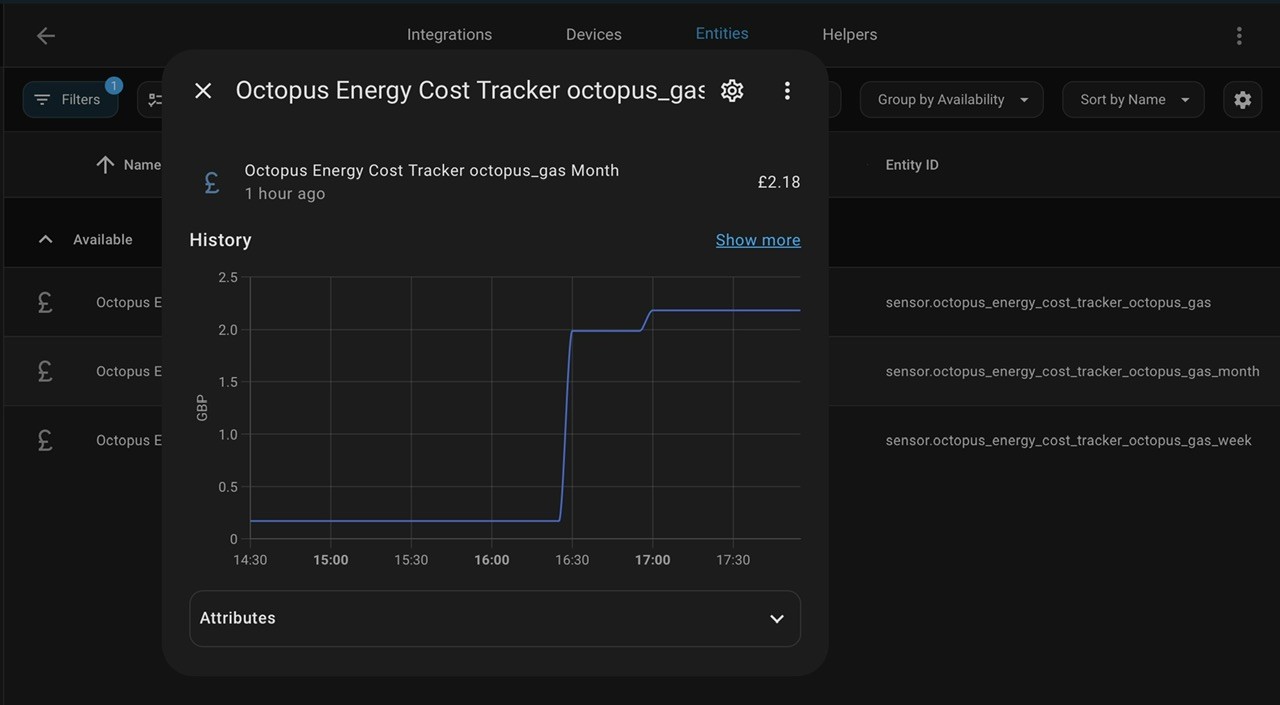
This will create sensor.octopus_energy_cost_tracker{{COST_TRACKER_NAME}} for today’s accumulated cost and sensor.octopus_energy_cost_tracker{{COST_TRACKER_NAME}}_week/month for the weekly/monthly costs
The sensors will only accumulate forwards so week/month to date won’t be correct until from the start of next month
Thank you 🎄🍺
Daveb01 Let me know if changing to total works for you because it didn't for me
Daveb01 That looks like the jump you can get with by using the today sensors not the total sensors. Sometimes the nightly reset doesn’t occur precisely at midnight and so HA gets confused. Does this spike happen for just today, what about other days going back in time?
Other possible thing, did you reboot HA around midnight, sometimes this can spike the sensors.
The config above is similar to my own that’s working fine:
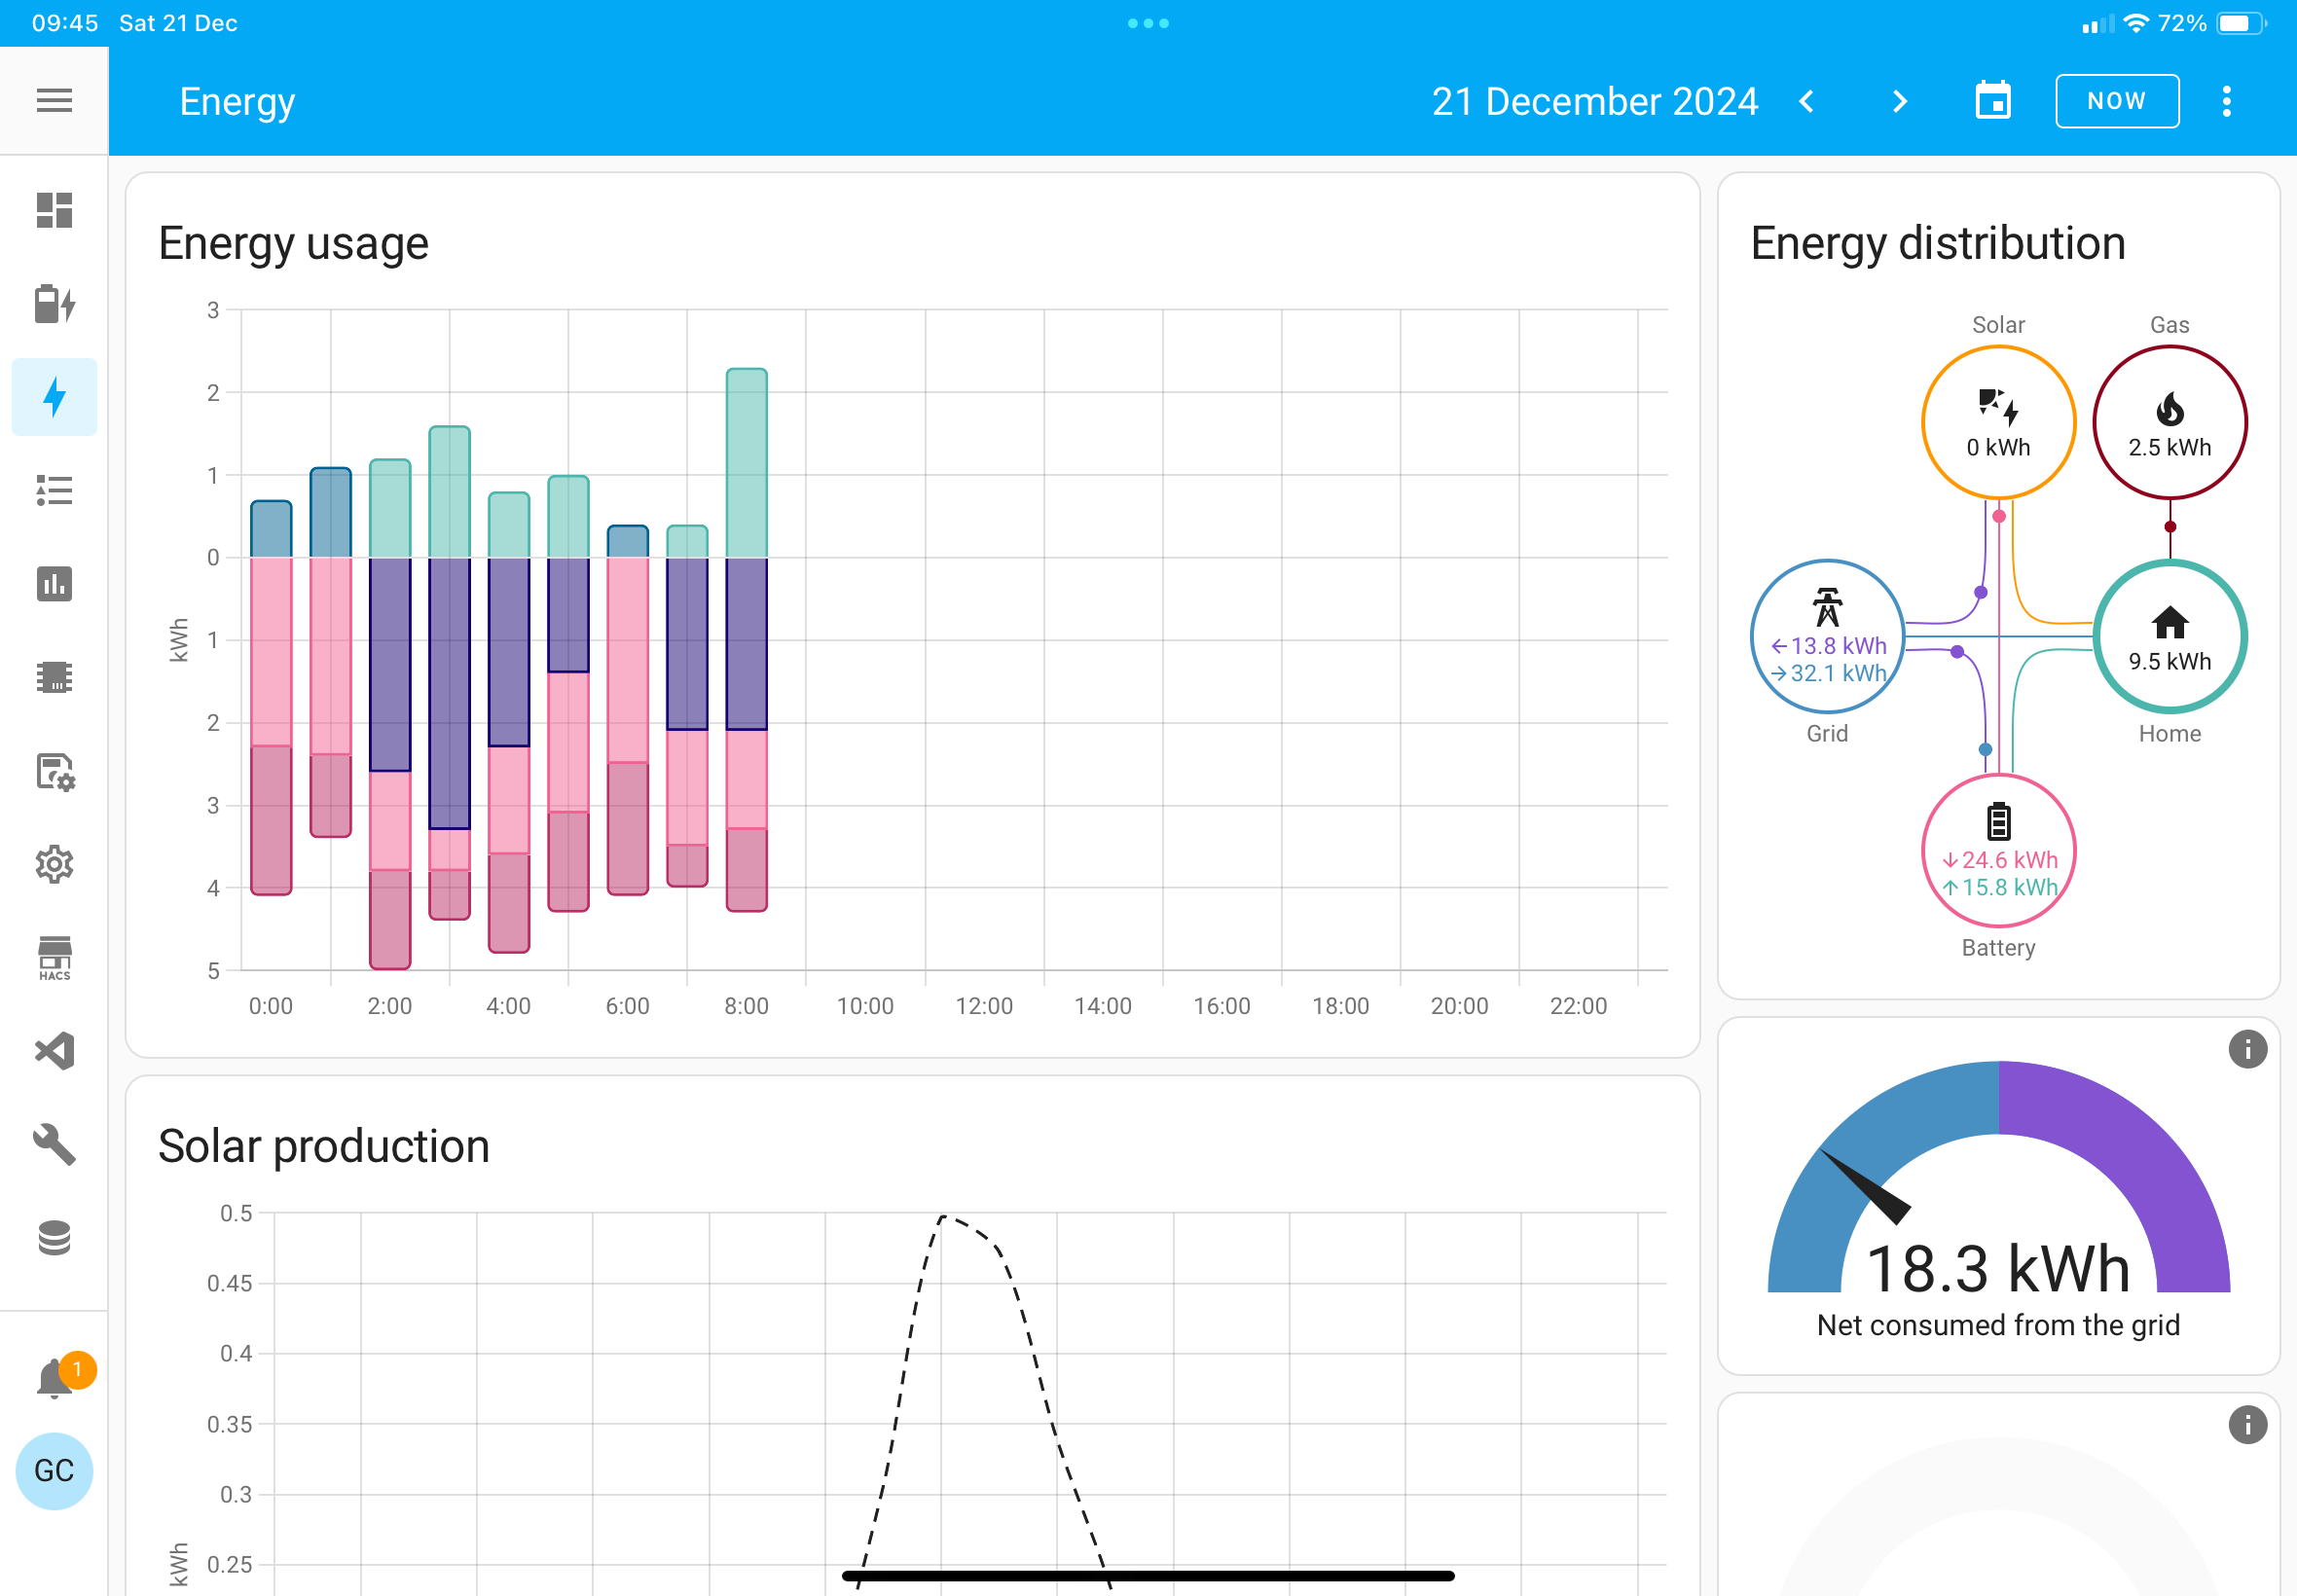
Thank you for your screenshot, mine seems to still be doing the spike at midnight. ha was not rebooted.
These are the settings I now have.
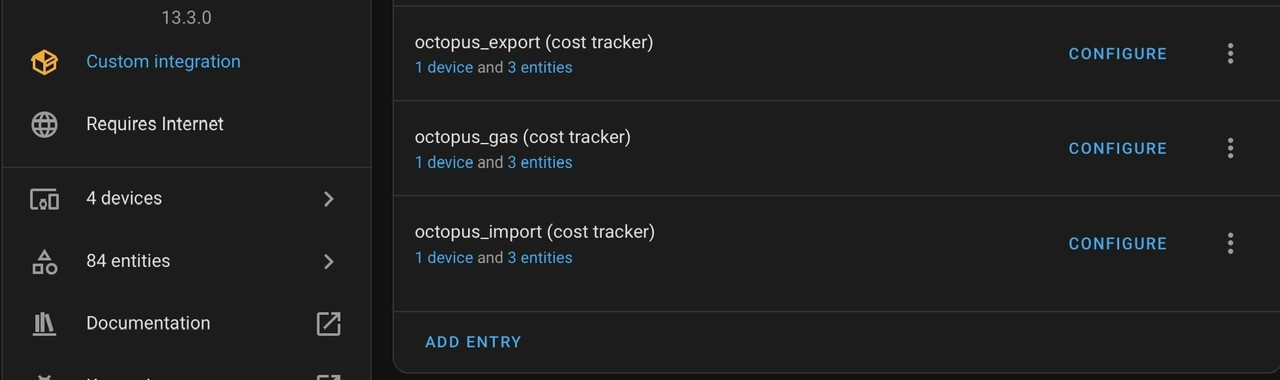
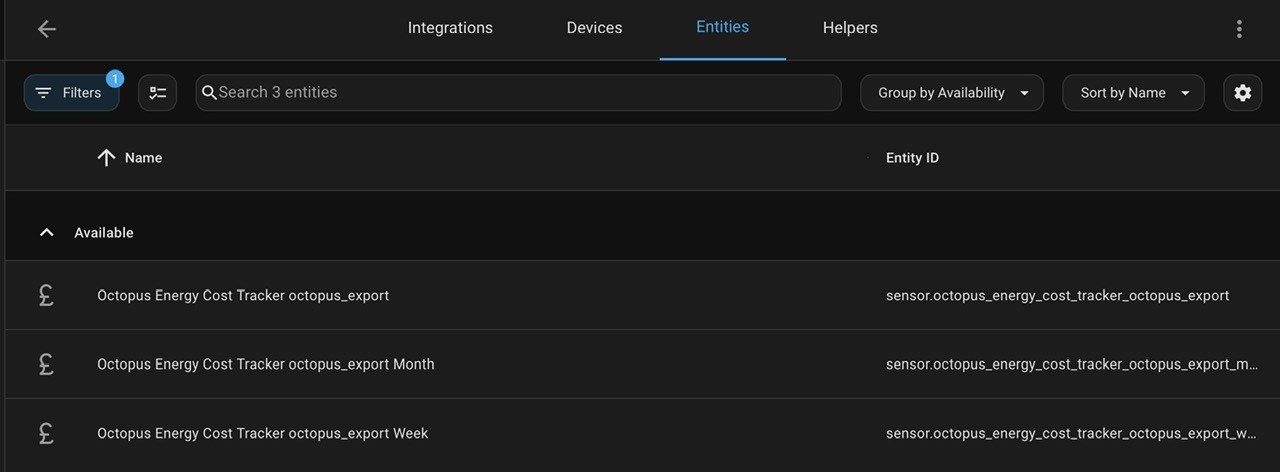
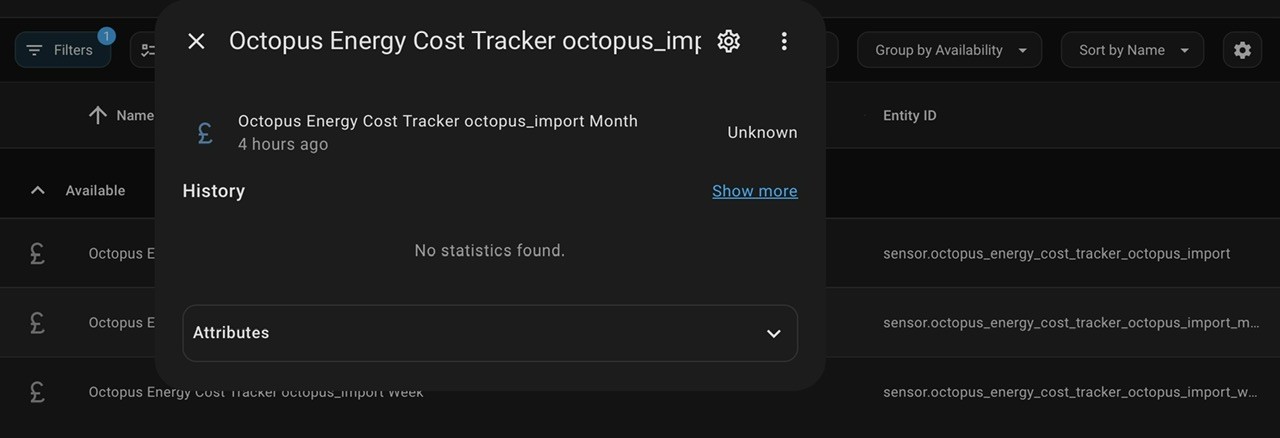
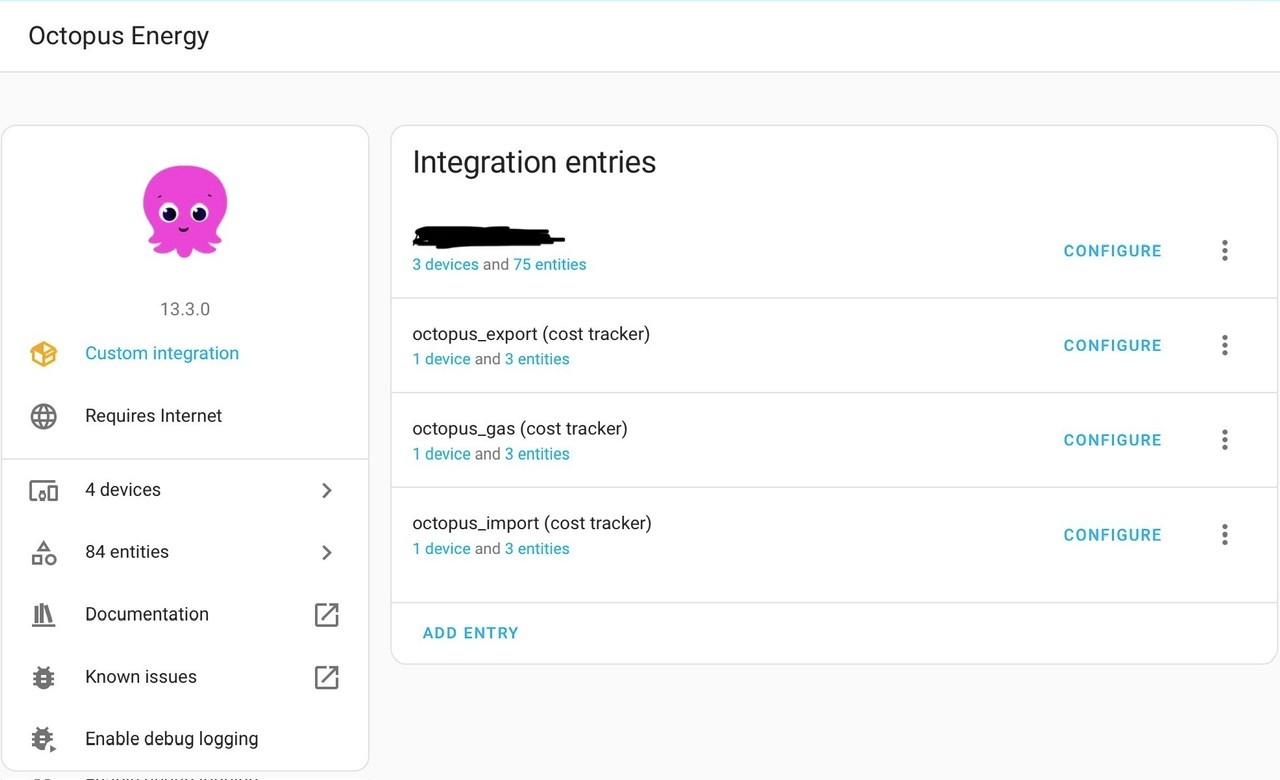
Followed the instructions however it does not seem to be working yet (but Gas is)
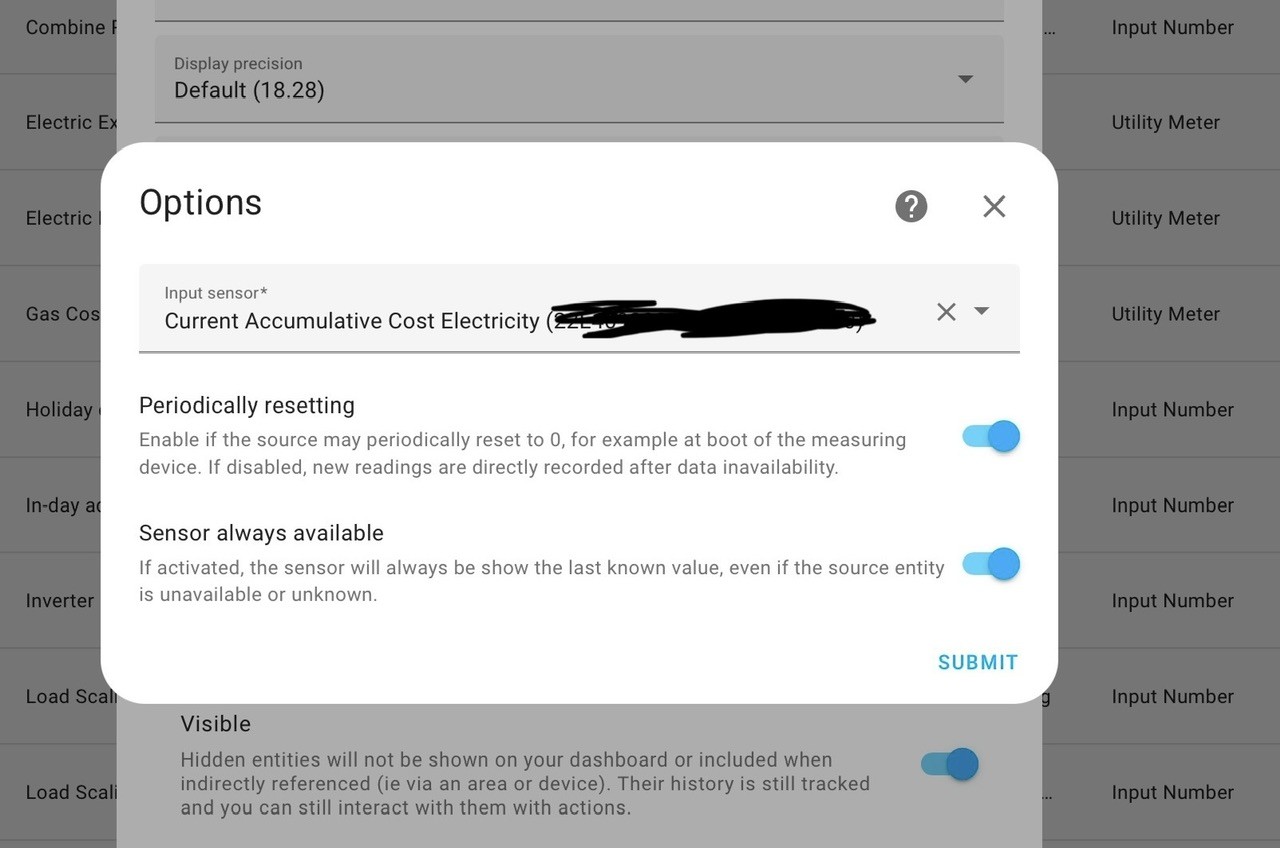
I was thinking I was going to select the new identity with the new name octopus_import, however that is not display, so had to pick the one on the picture.
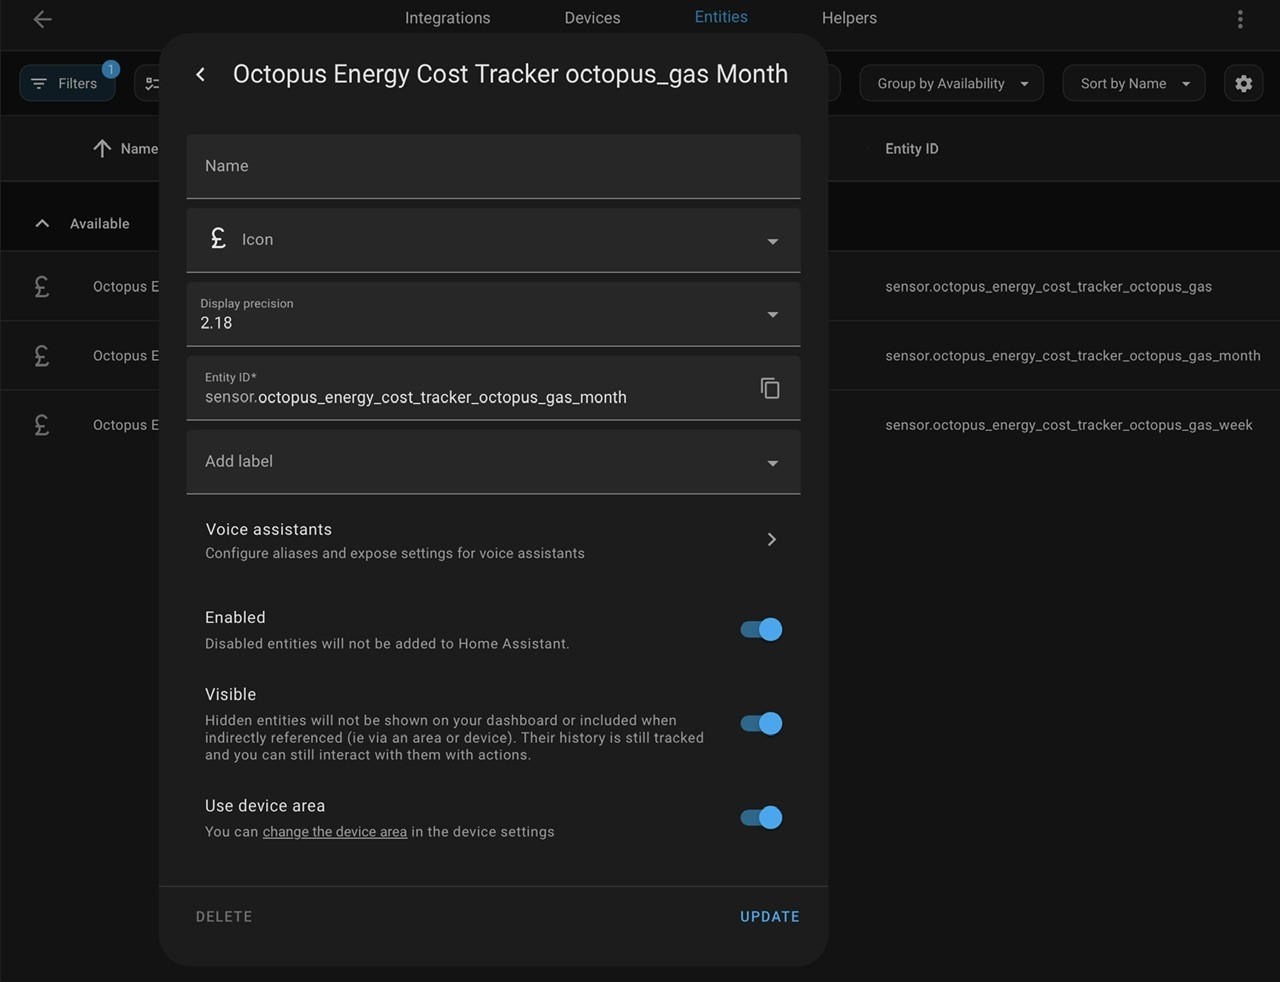
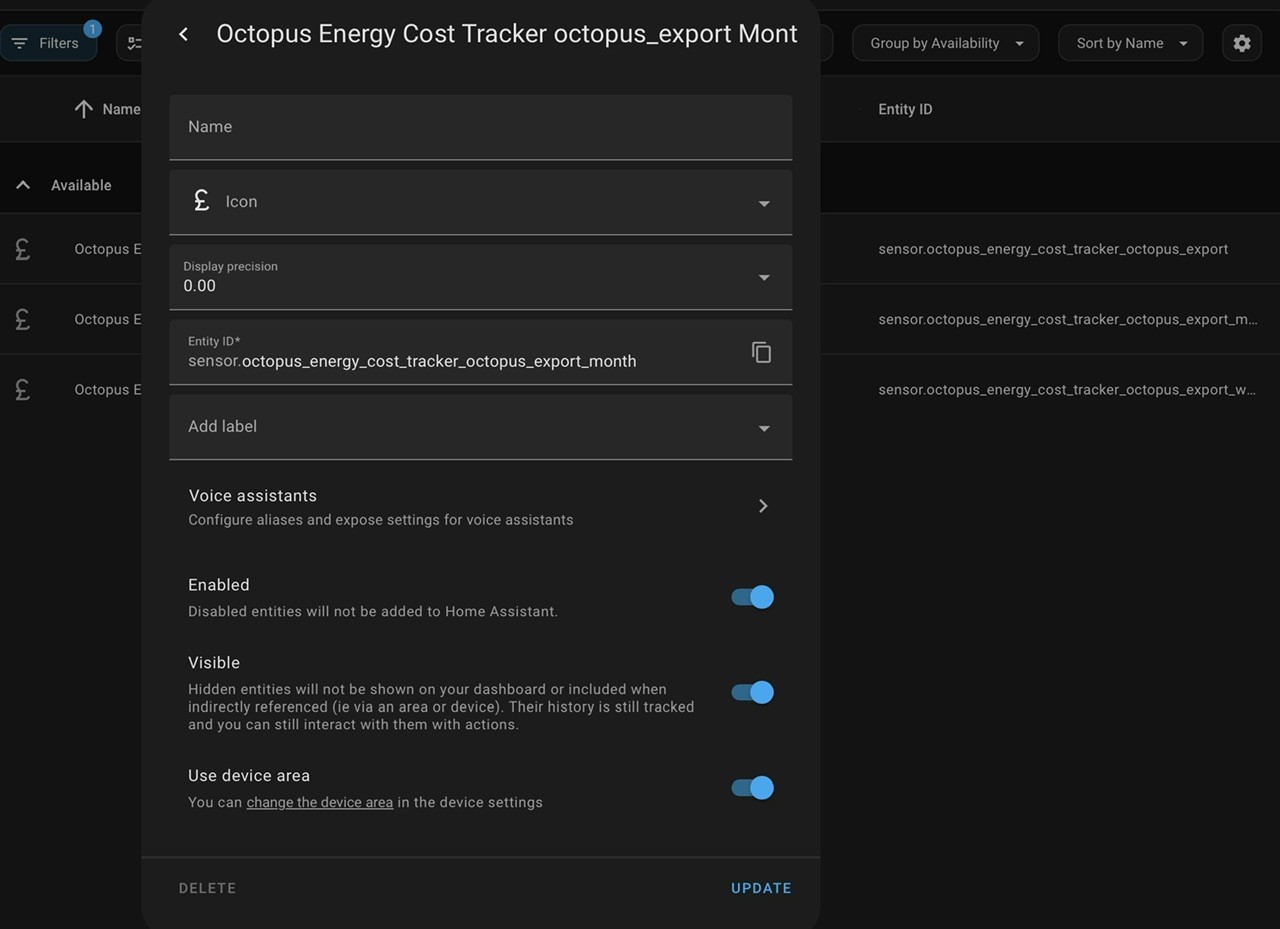
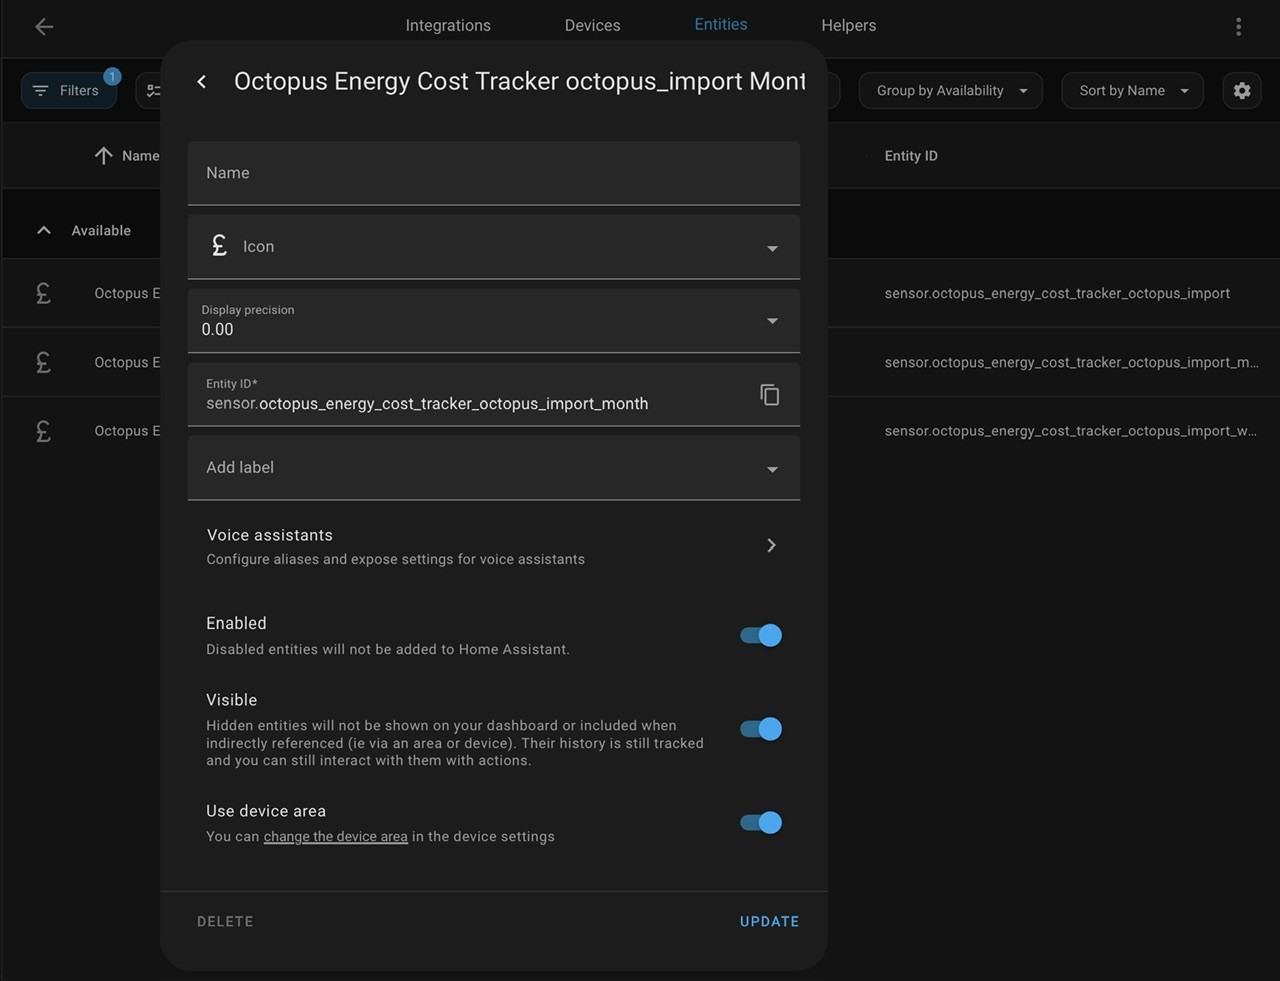
I sorted the decimal places
Any advice please?
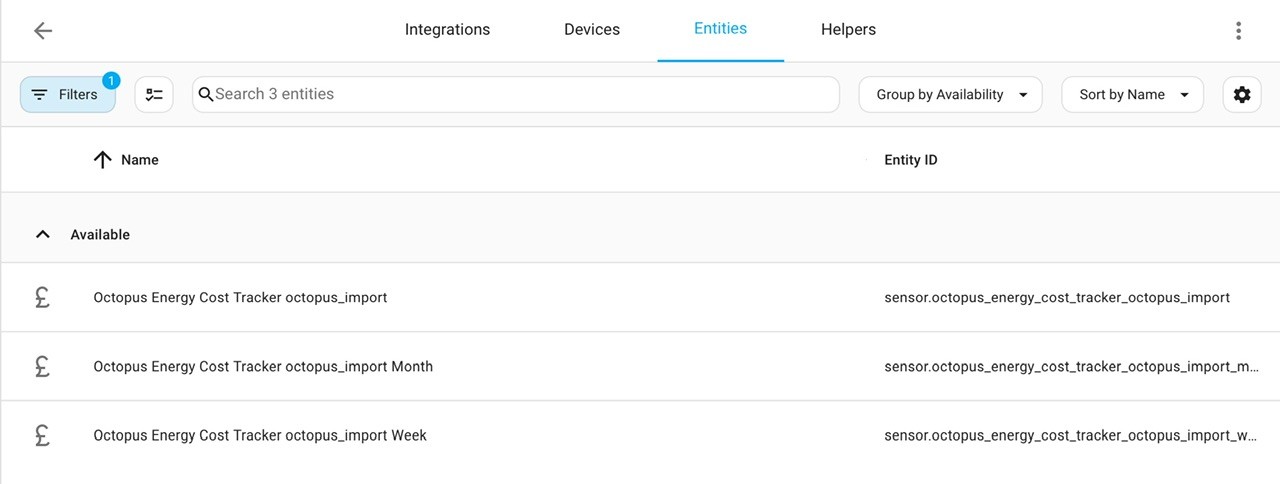
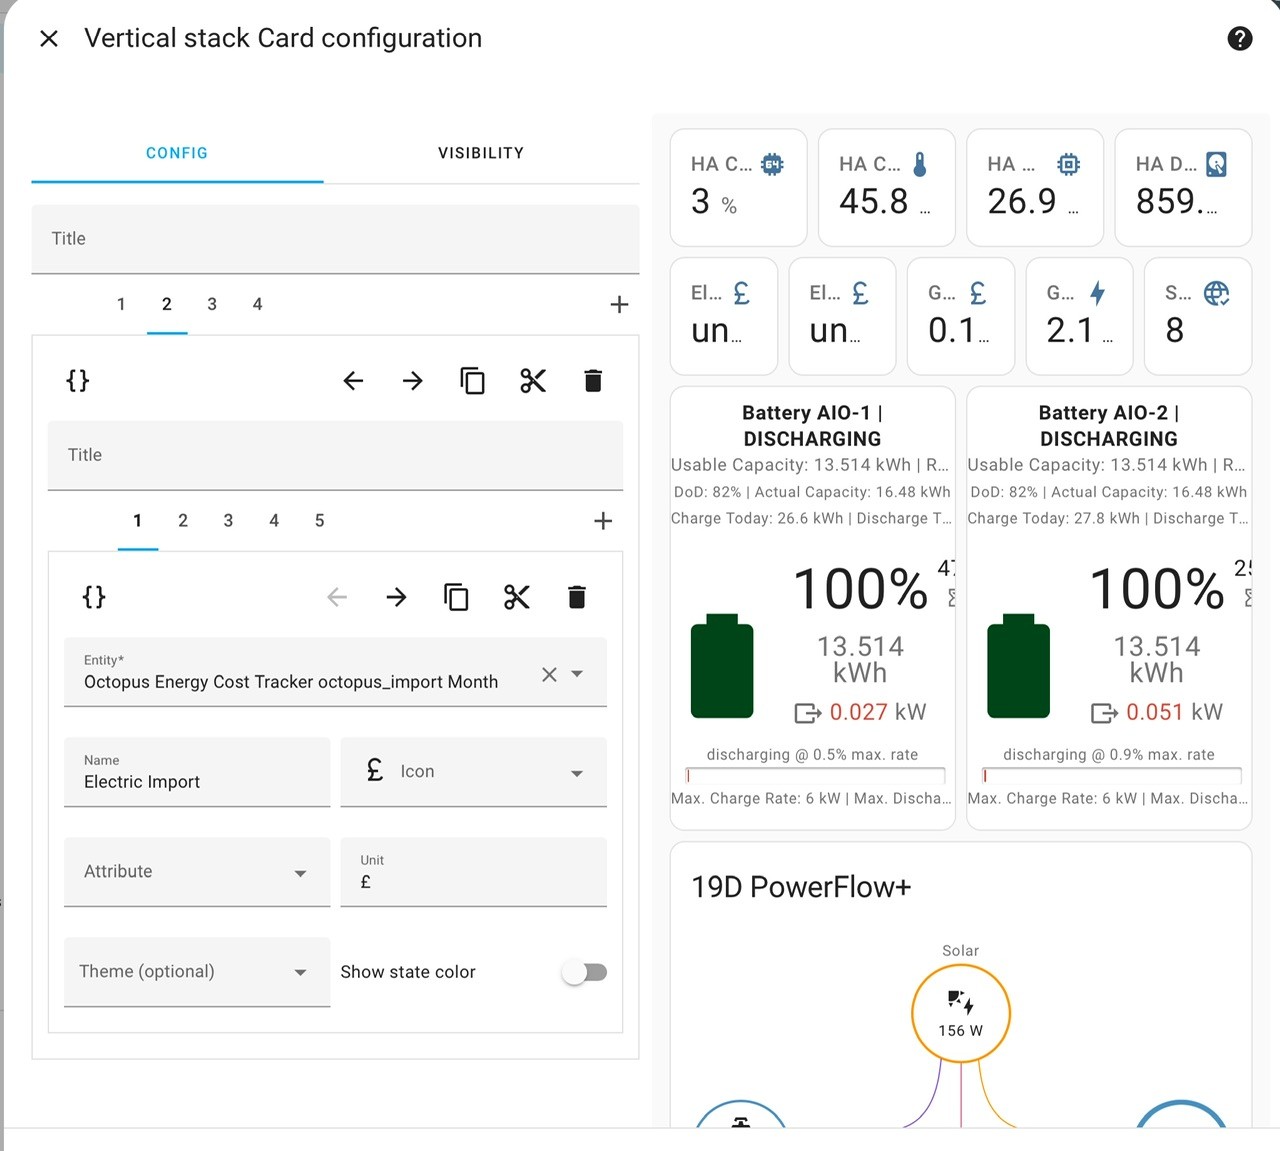
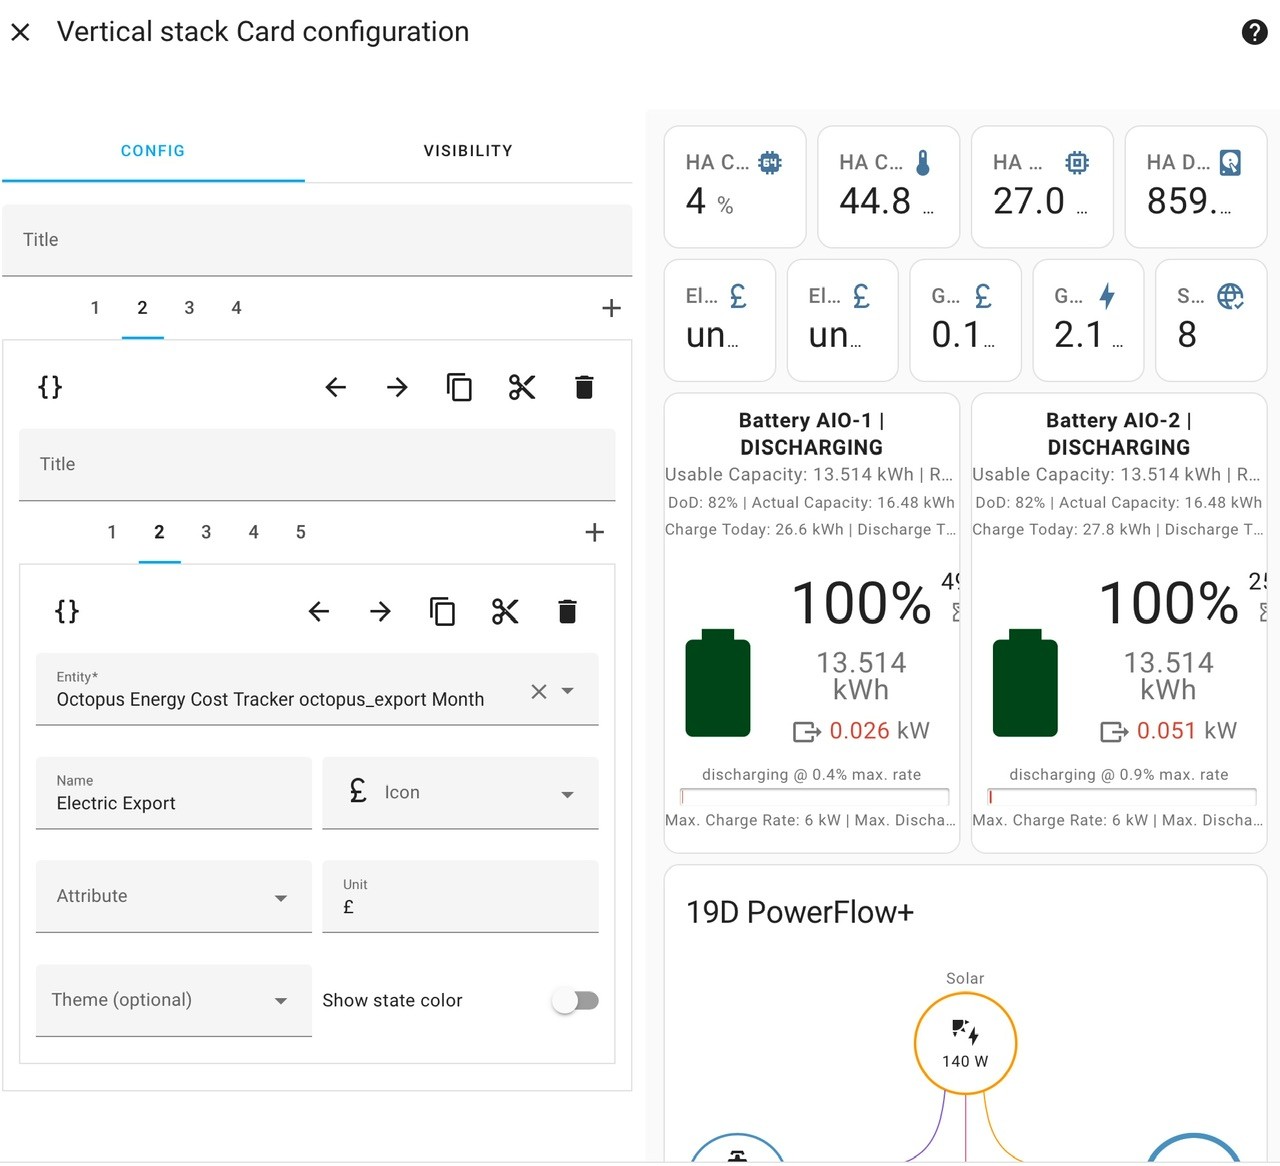
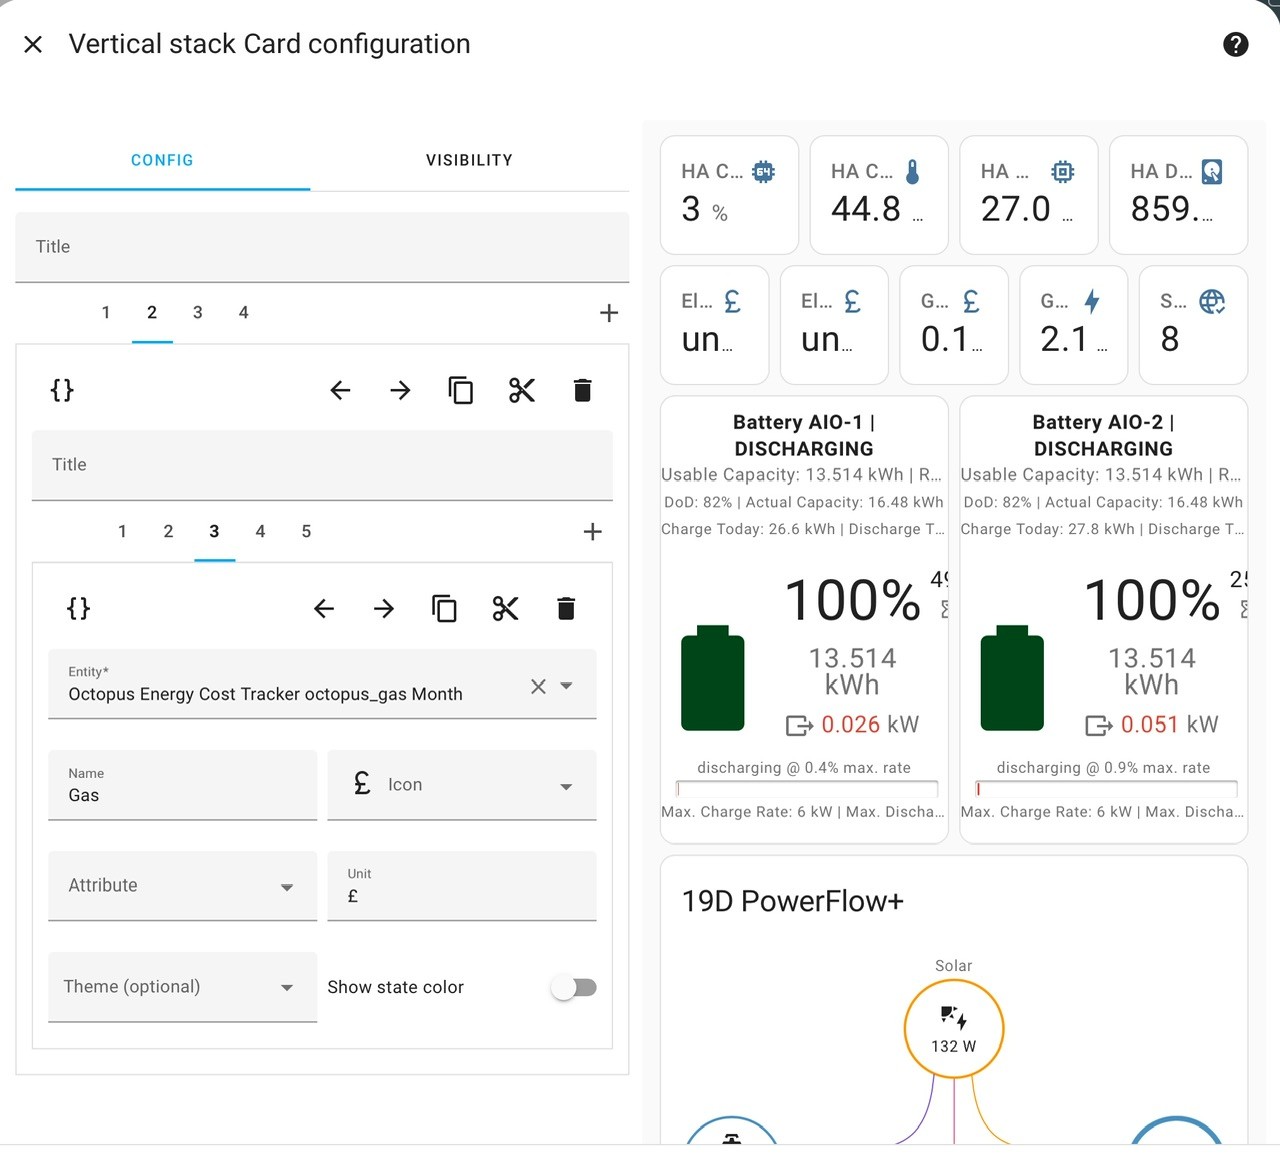
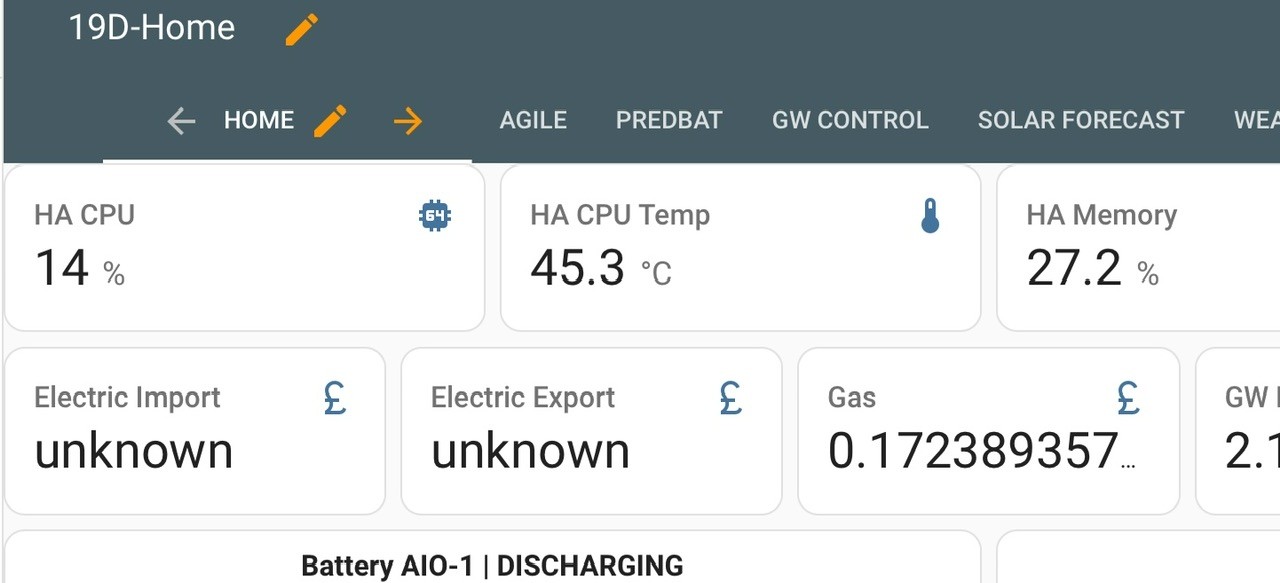
Daveb01 Thank you for your screenshot, mine seems to still be doing the spike at midnight. ha was not rebooted.
As I have explained already twice now, the reason you are getting a spike at midnight is that you are using the givtcp_xxx_import_energy_today_kwh sensors not the total sensors and the today sensors (with GivTCP 3) don’t always seem to zero precisely on midnight which causes the energy dashboard to see the consumption/generation/battery activity suddenly changing at 00:00:15 (for example). The fix for this is as above (twice) …
Daveb01 Followed the instructions however it does not seem to be working yet (but Gas is)
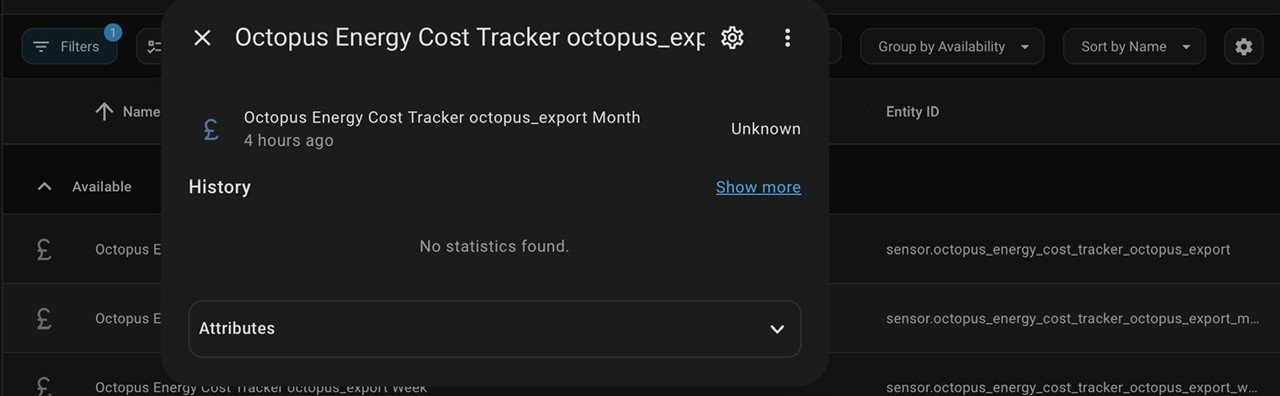
I’d need to see the configuration of the octopus_import and octopus_export cost trackers you have created. From the dashboards it looks like the state is unknown. It may be that it doesn’t start working until midnight as you are using a total sensor as the input to track, but strange that gas is working.
I was thinking I was going to select the new identity with the new name octopus_import, however that is not displaye, so had to pick the one on the picture.
It looks OK to me. You have 4 entries under the integration now, the configuration of your octopus account and 3 cost trackers. You configure the cost trackers and the main integration account details separately.
I could not find how to set the decimal places either e.g the Gas setting.
just configure the sensor config as normal in HA. Settings / Devices and Services / Entities / search for the entity name, select it, hit the cogwheel at the top right, then change the number of decimal places to display
I am so sorry, for some reason i thought i had done it and your right I have put the same setting back. I have changed it double checked it and it looks like it is now working.
So that’s this bit done. If we ever meet up I definitely owe you a few beers.
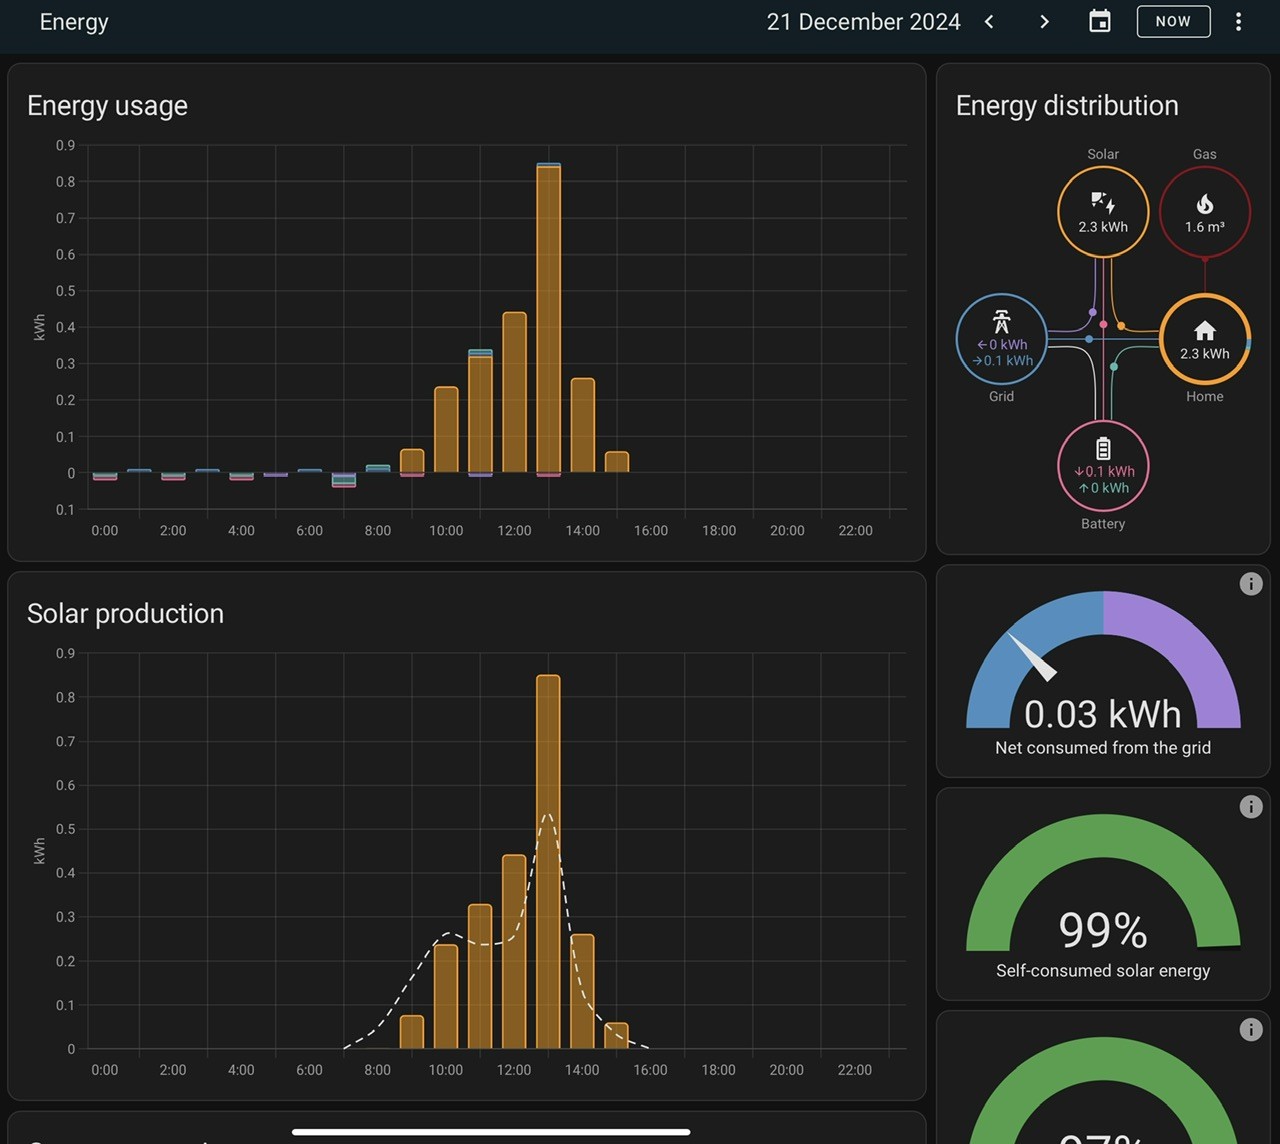
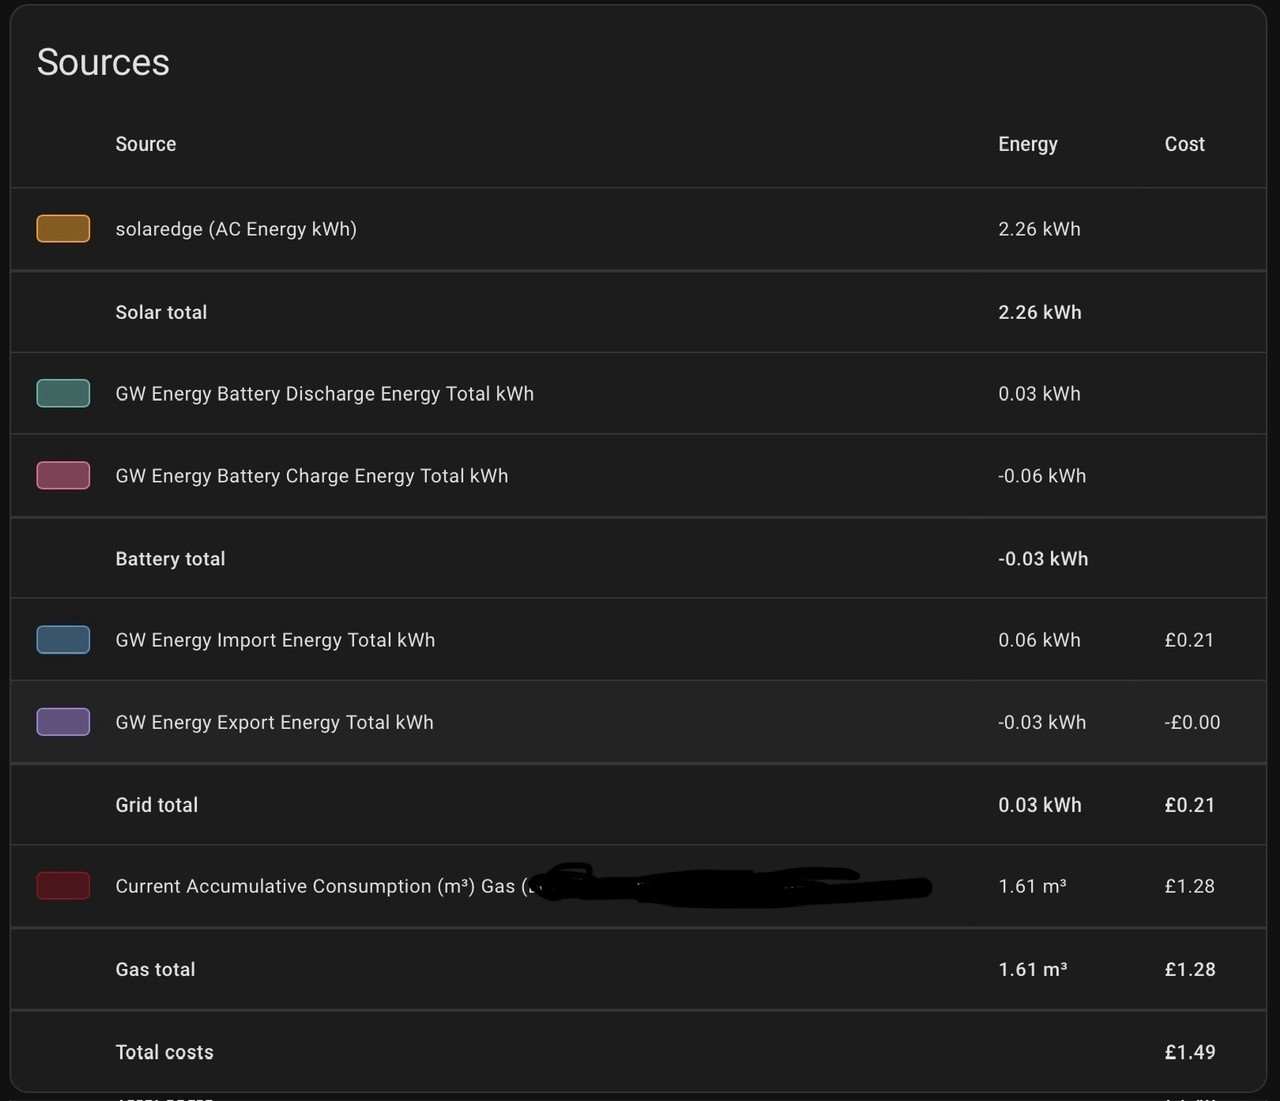
I will try to get to grips with all this Energy stuff over Xmas period.
Something that I have neglected in the past but I need to keep my fellow rabbit company with the challenges of the energy dashboard.
Rob
Daveb01 I am so sorry, for some reason i thought i had done it and your right I have put the same setting back. I have changed it double checked it and it looks like it is now working.
one down, one to go …
Daveb01 The Import and Export are the same no data yet.
I didn’t have any experience in setting up these cost trackers because as I said I use the Energy dashboard.
But in the interests of solving this for you I have setup 3 sets of import cost trackers, linked to givtcp_xx_import_today_kwh, _import_total_kwh and octopus current accumulation consumption kwh.
Apart from having a bit of trouble with the configuration validation when I used upper case and spaces in the name which it rejected, I configured these 3 cost trackers and each created 3 sensors.
All of these cost trackers are working, tracking against import activity. The one linked to import_total seems to be giving correct answers:
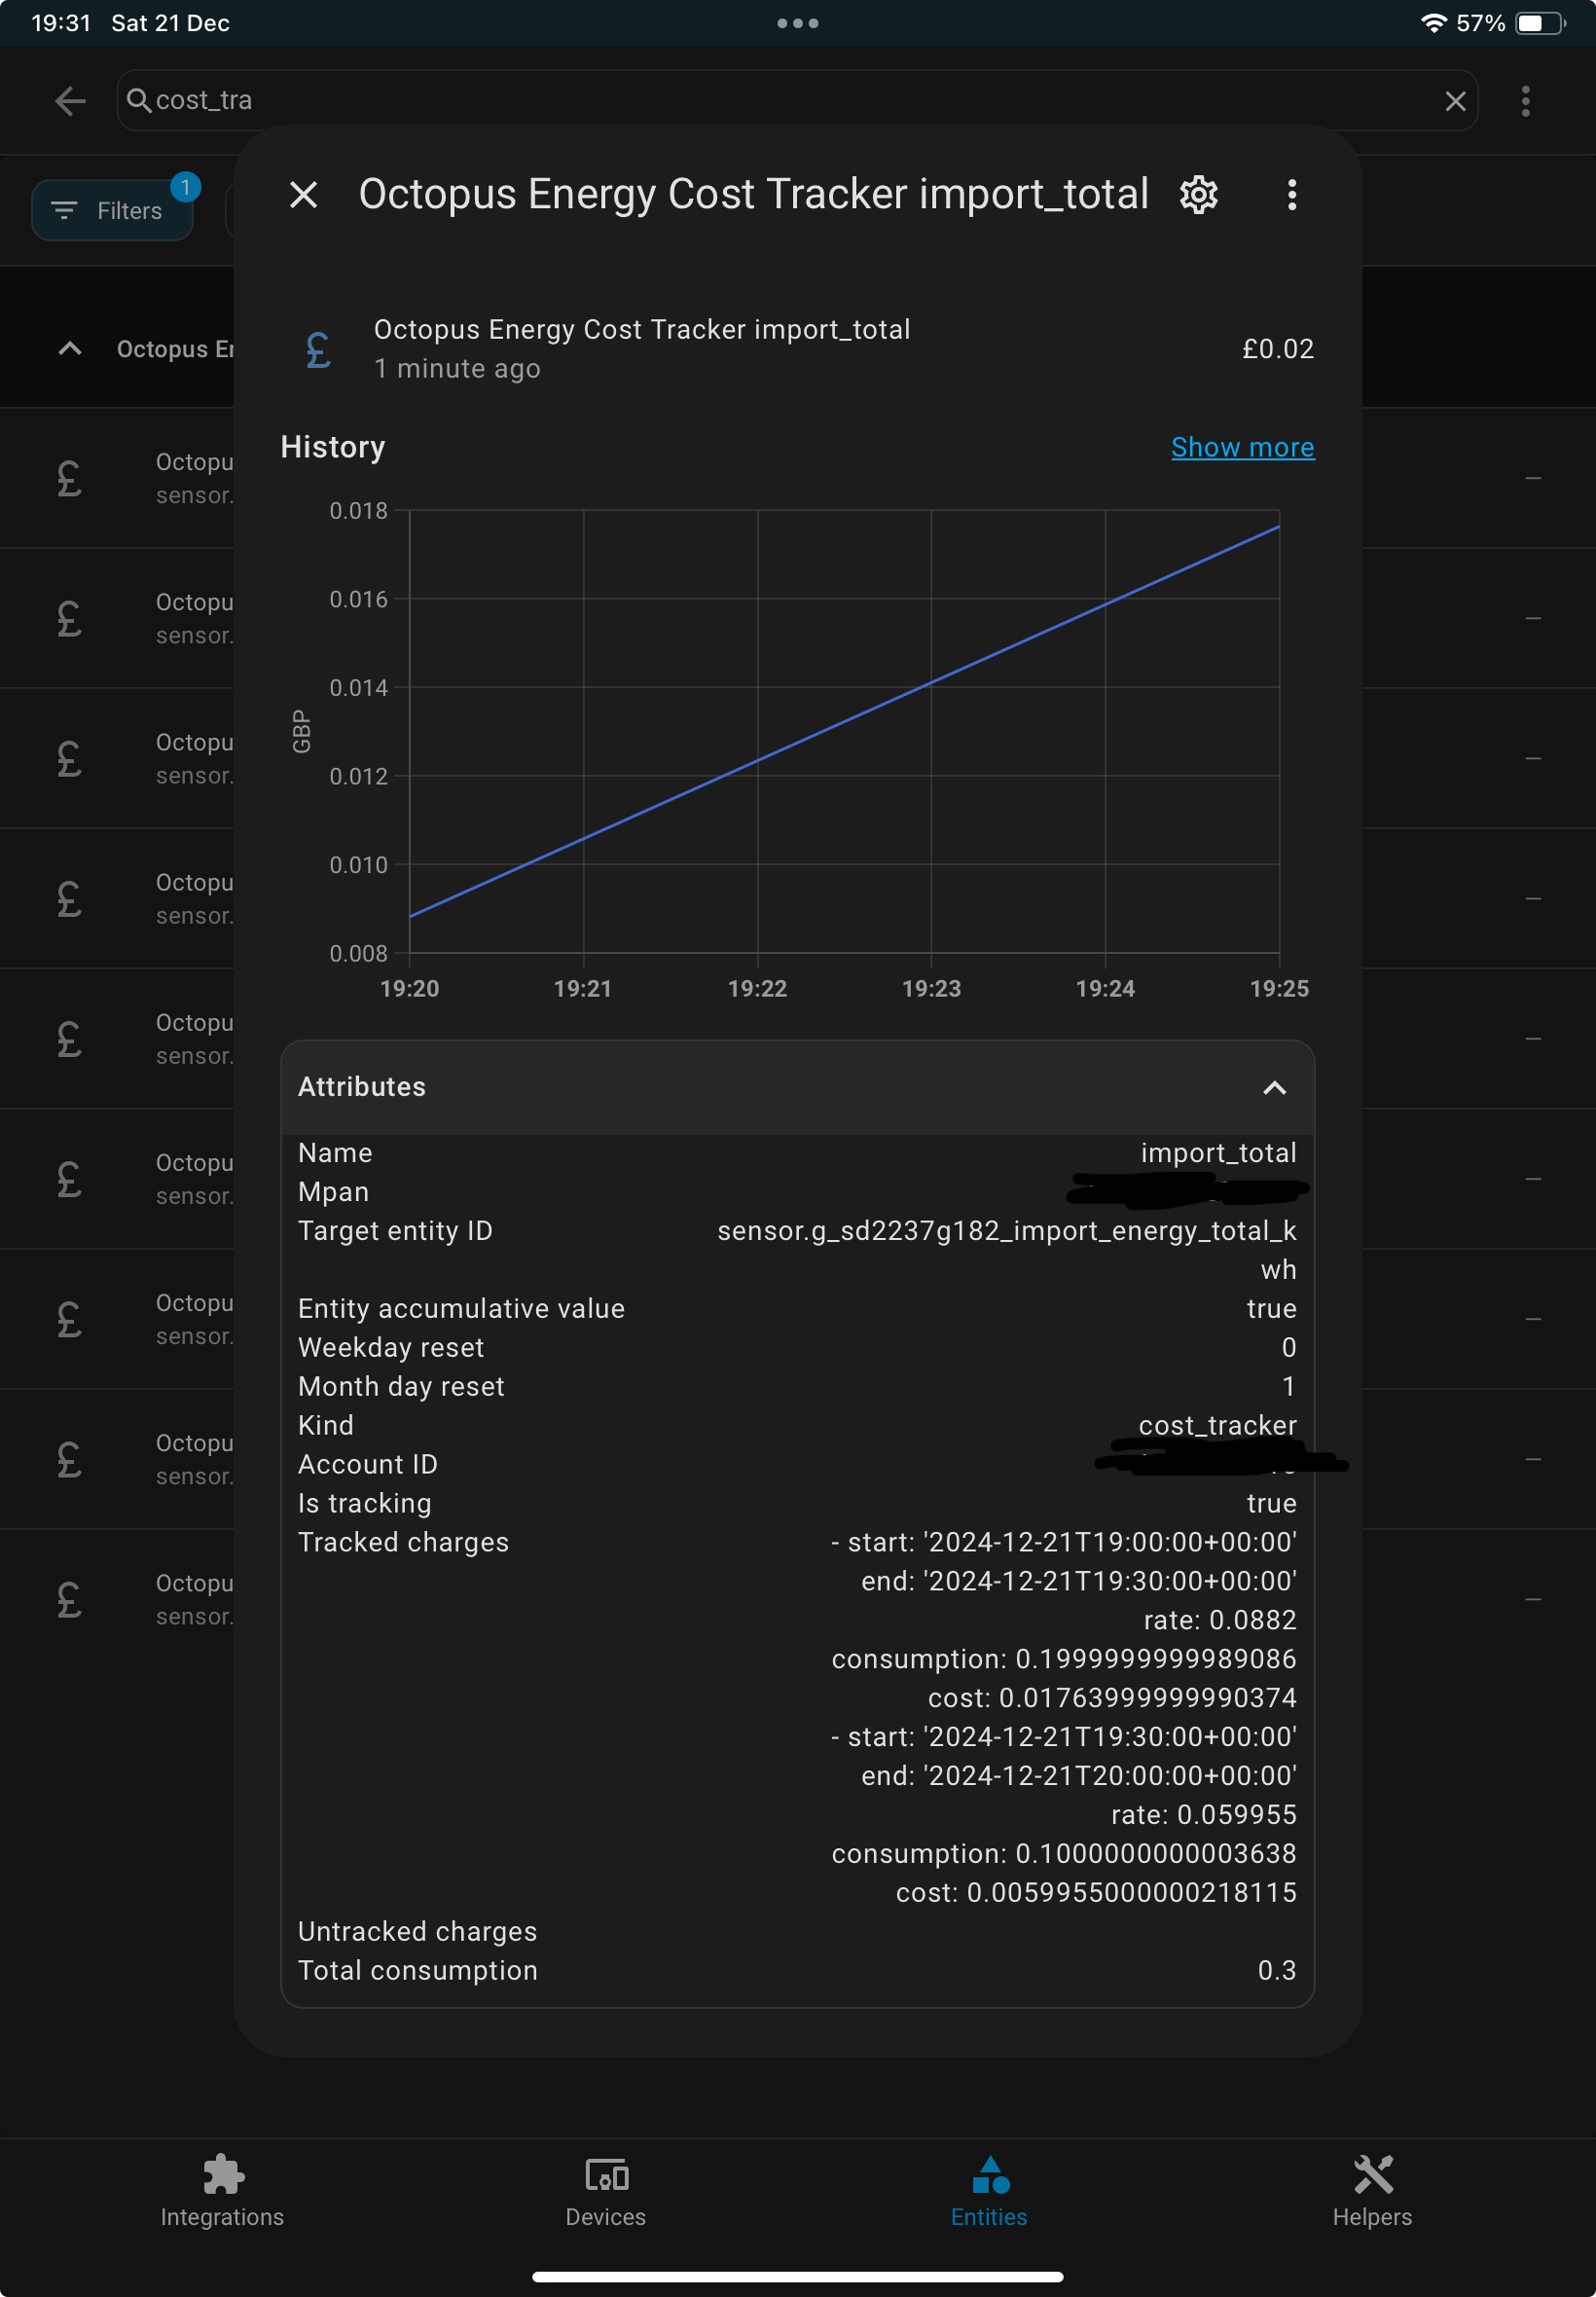
And here’s the configuration of it in the Octopus integration:
The cost trackers linked to GivTCP import_today and Octopus Integration current accumulative consumption which are both sensors that measure today’s kWh import are working but import_today cost tracker is saying £23 and current_accumulative £37! Today’s actual import is 56kWh but the total cost is only £2 so not quite sure why this is so far out. Maybe it will reset at midnight?
Anyway they all are at least tracking. I can only suggest double checking your config or deleting and setting up again
I thought I would leave it over night to see if the new entity’s kicked in. And they have but not as expected. I will now read your comments above and set up three and see what results I get.
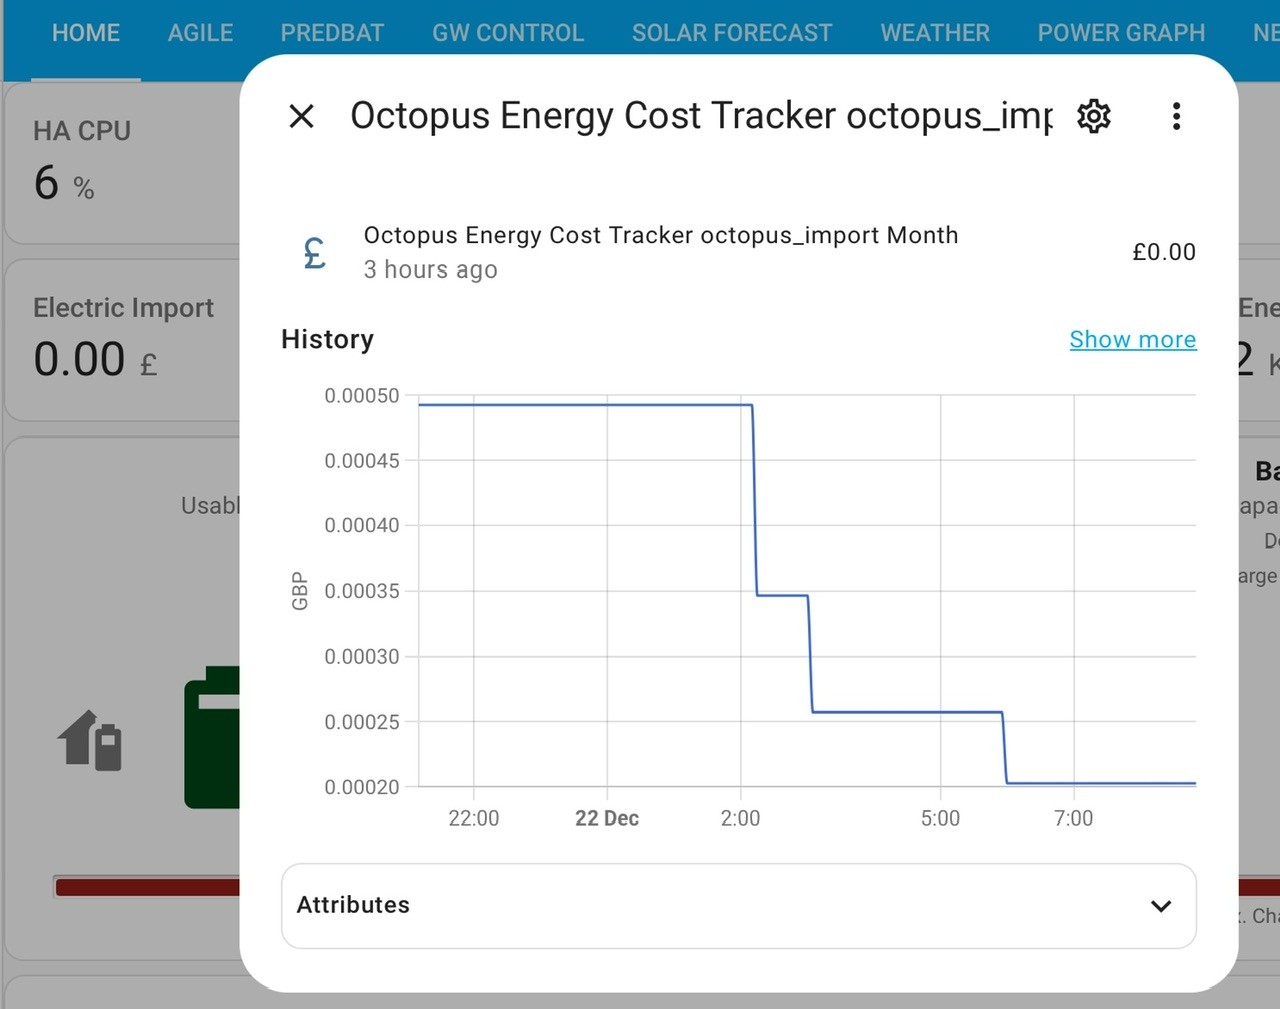
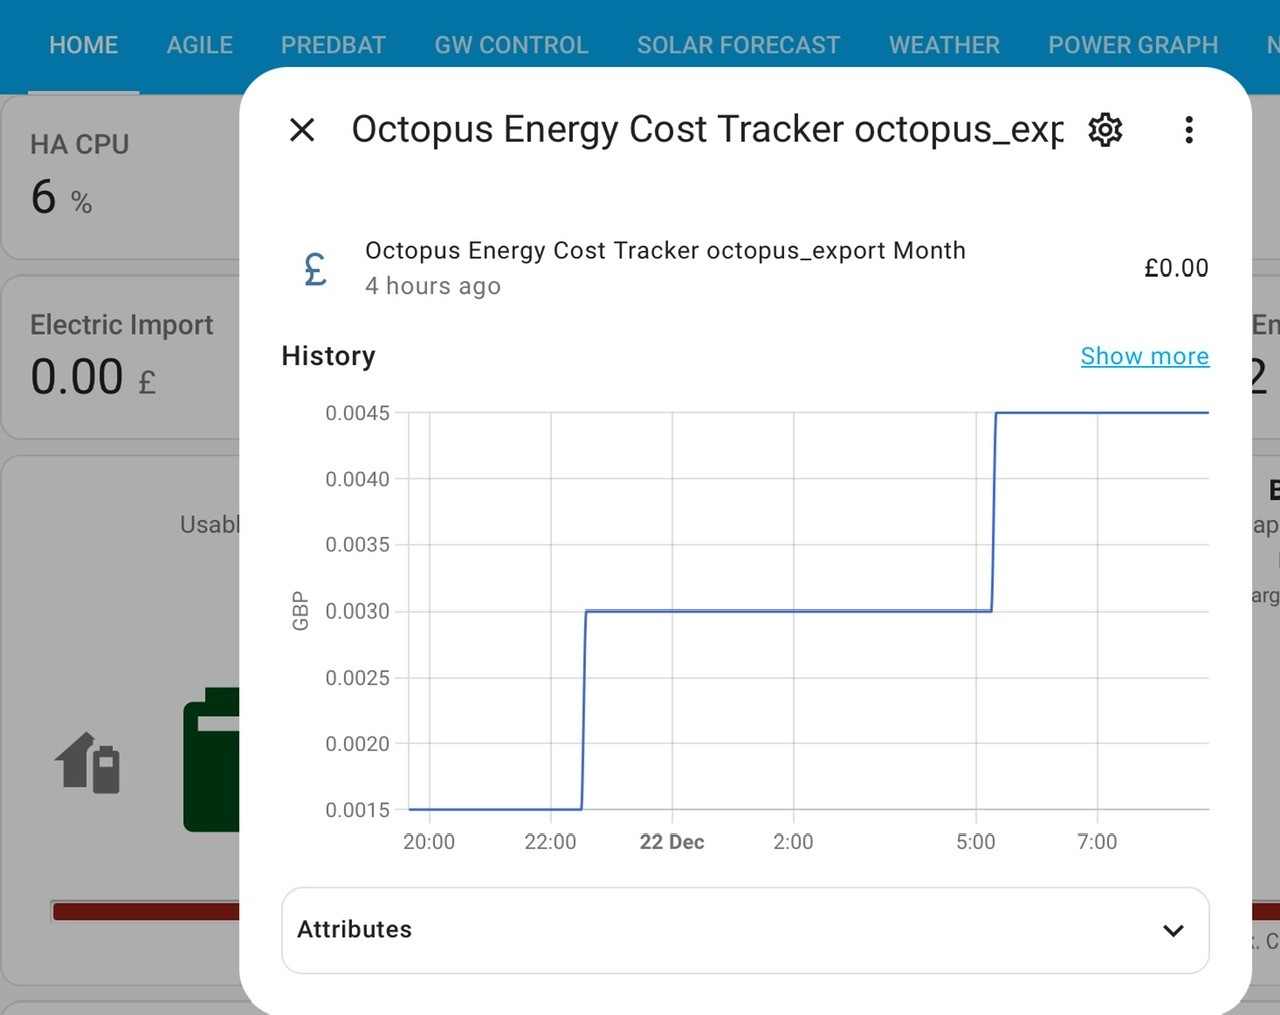
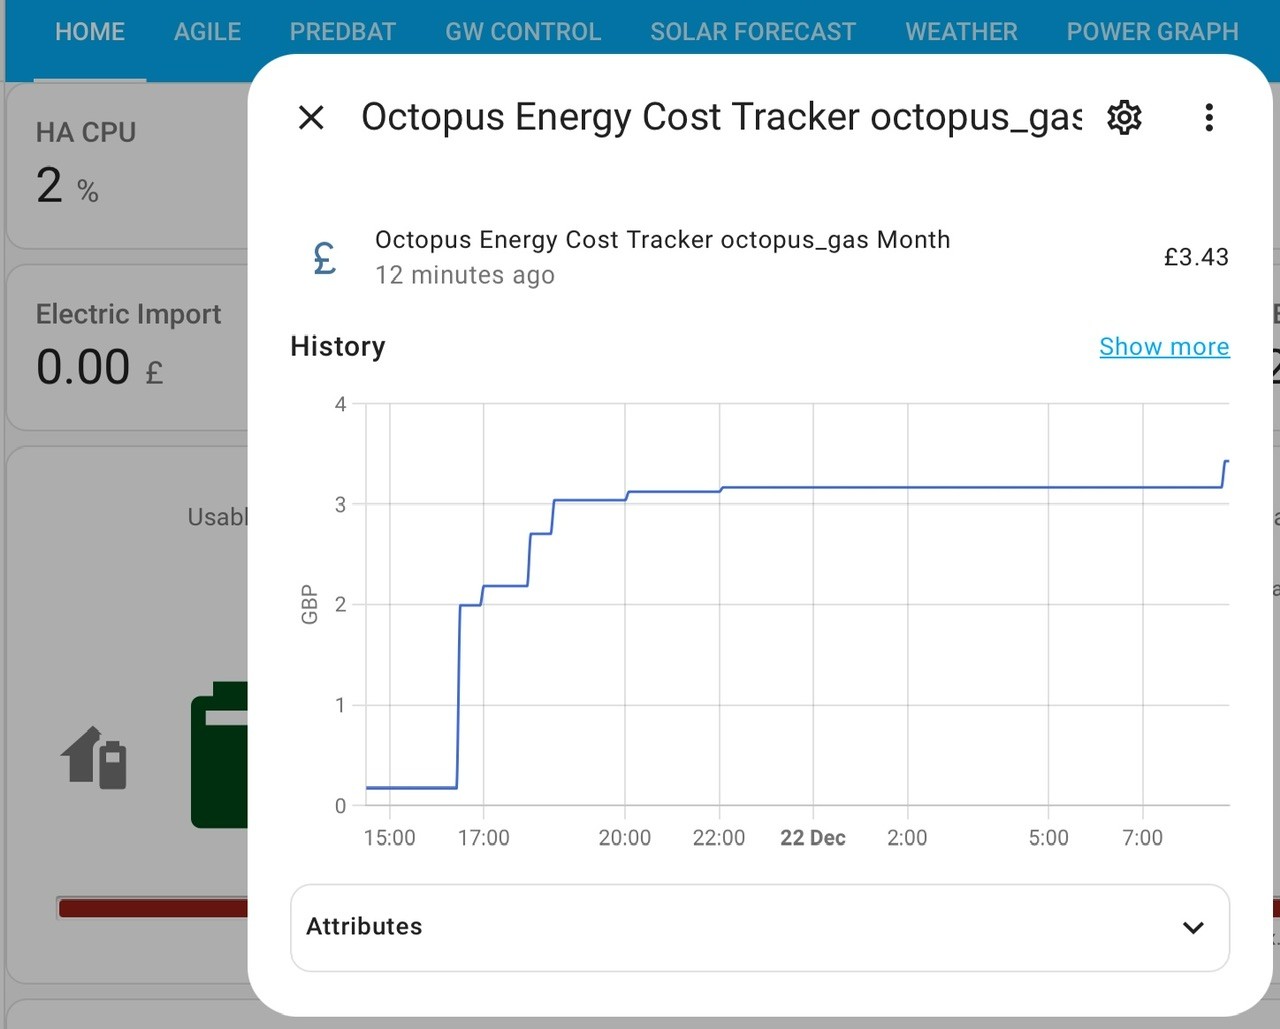
@Daveb01 I figured out why the costs on the accumulative_import and import_today cost trackers were so wacky when the import_total looked fine
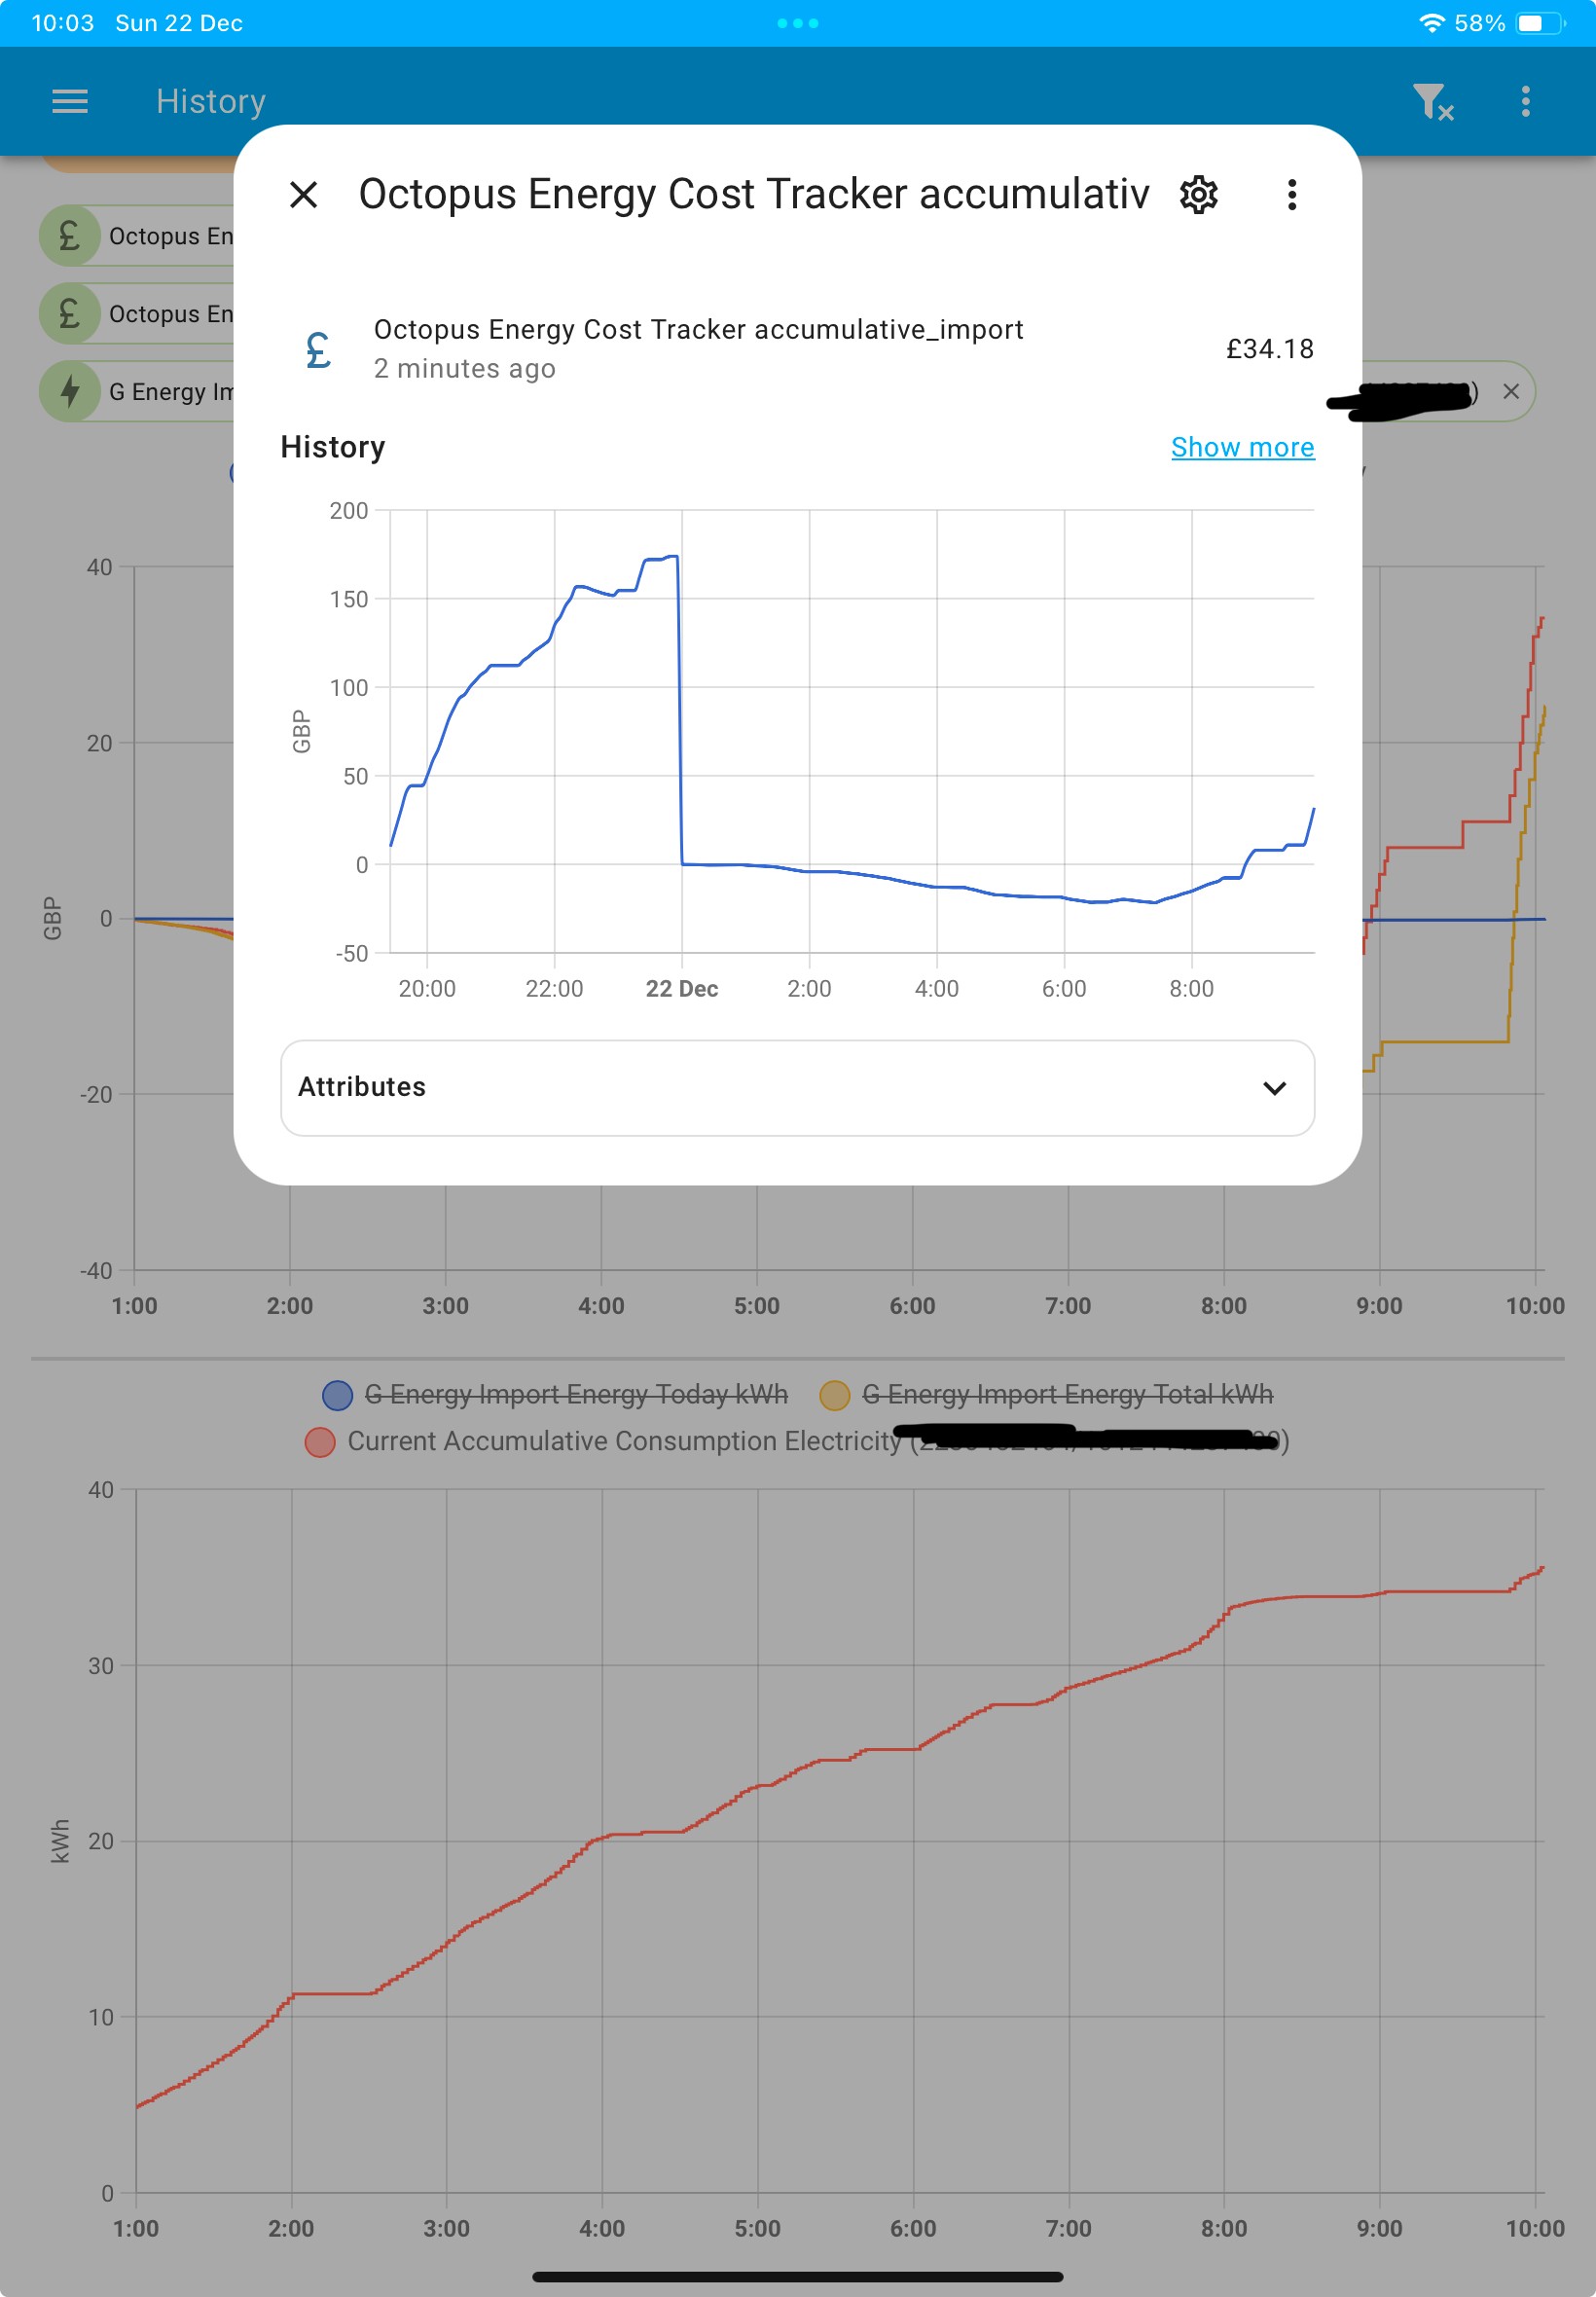
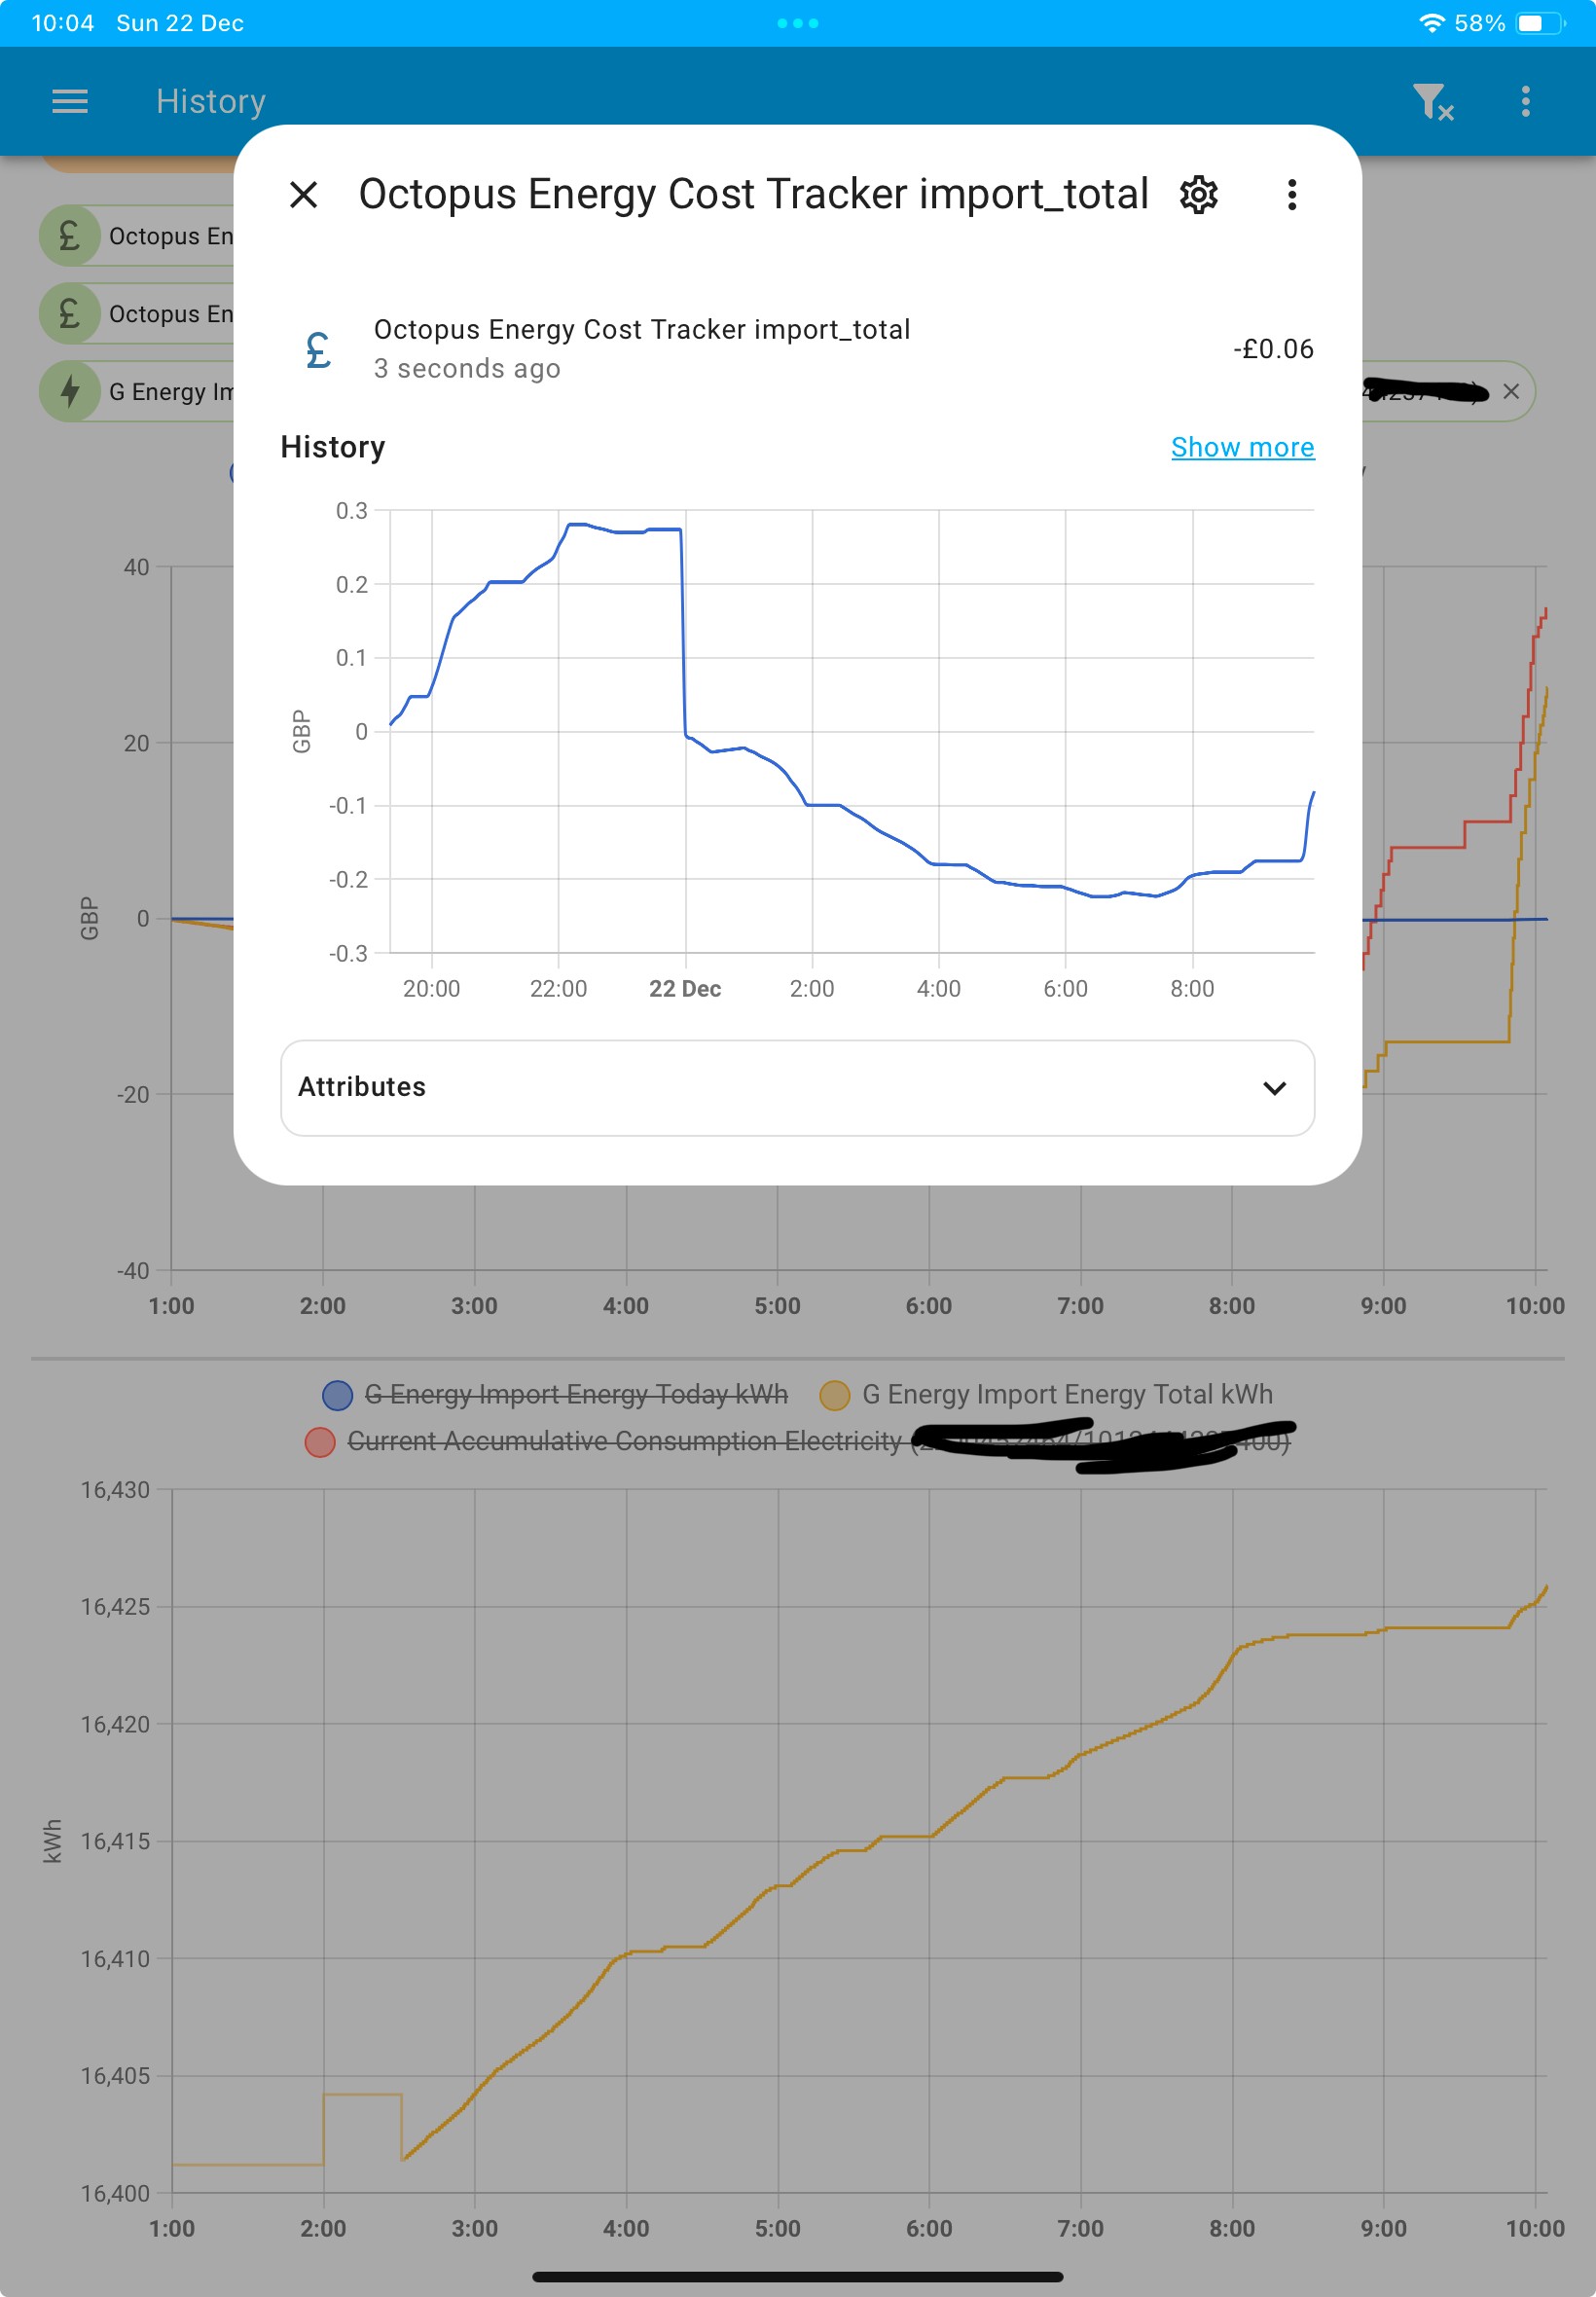
I hadn’t followed the instructions properly
geoffreycoan Tick ‘tracked entity is accumulative’
https://bottlecapdave.github.io/HomeAssistant-OctopusEnergy/setup/cost_tracker/
If the input kWh sensor increases all the time then the ‘accumulative’ box needed to be ticked. I had only ticked it on the import_total cost tracker not the the other two.
Daveb01 I suggest you just look at the ‘today’ tracker values not the monthly ones, the monthly ones will only come good from the start of next month as there’s no retrospective population.
The entities you are using to track givtcp_xxx_import_energy_today/total_kwh are these configured in kWh?
As you can see my input entities are increasing as are the cost tracker entities
Hi all, Rabbit advise at Christmas, while messing about with new things in HA as per above, when the other half asks what your doing DO NOT SHOW HER.
I set up and was trying 4 new Import Cost Trackers, I selected the wrong one and showed her, HOW MUCH was her reply. 🥴👍
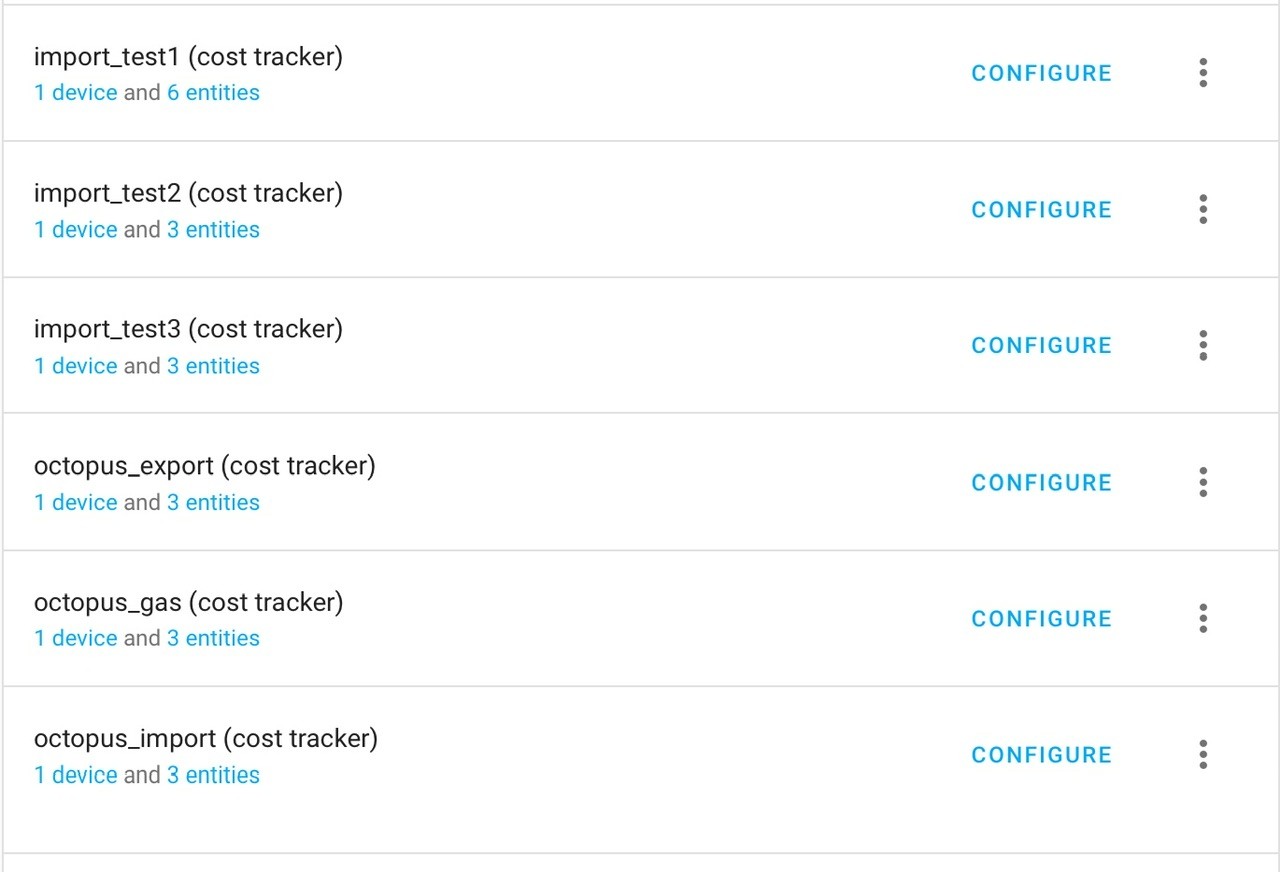
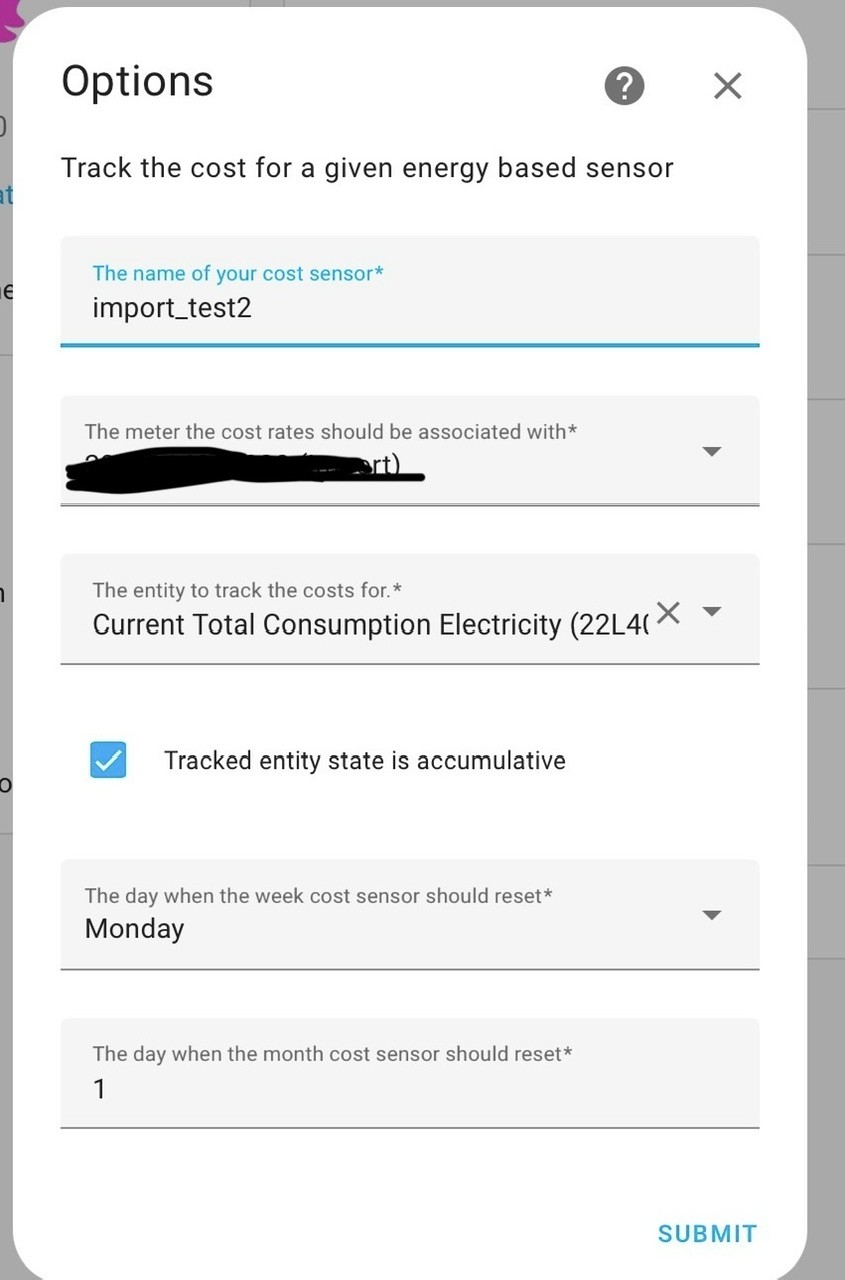
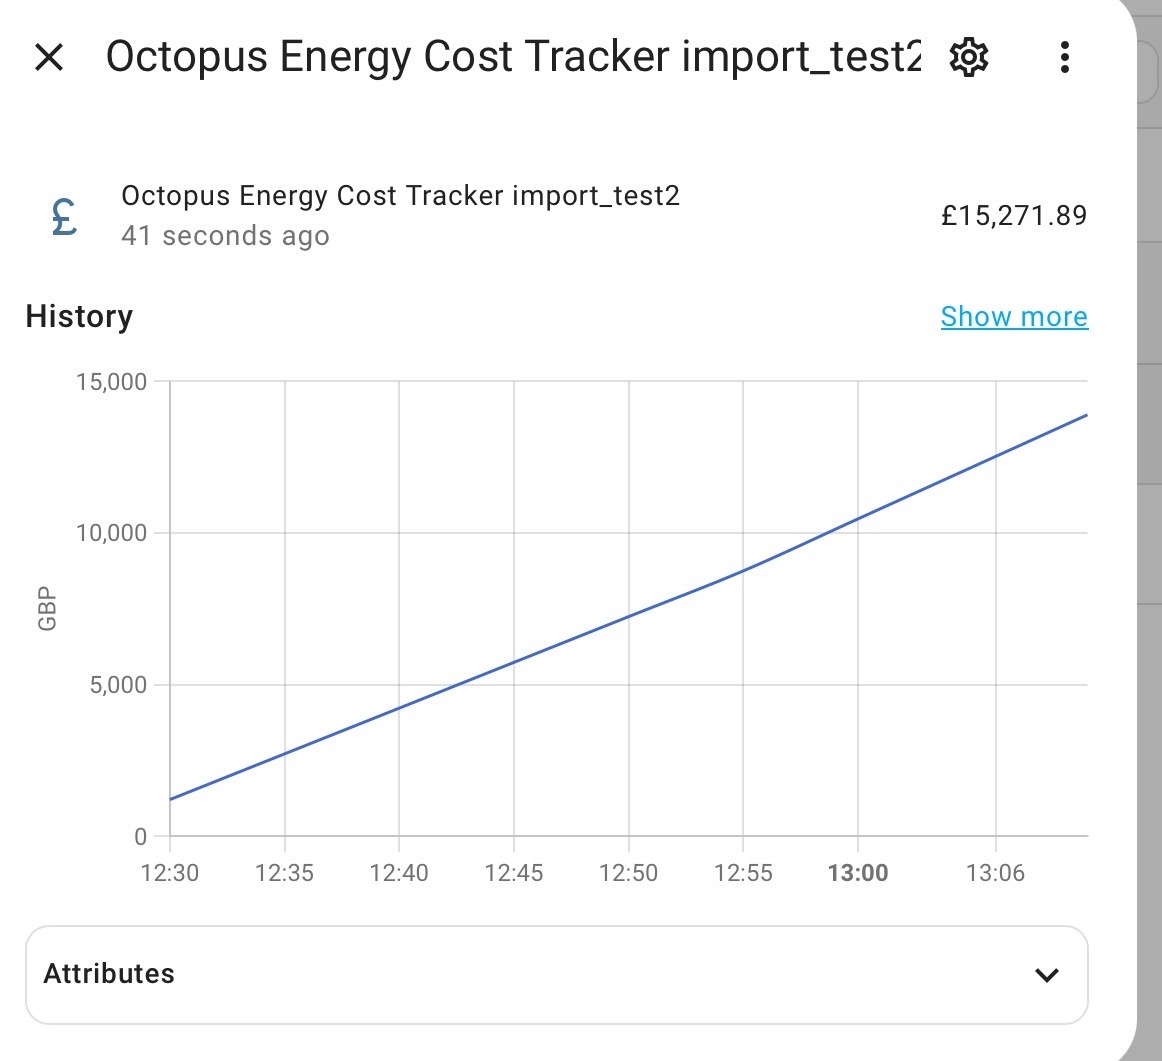
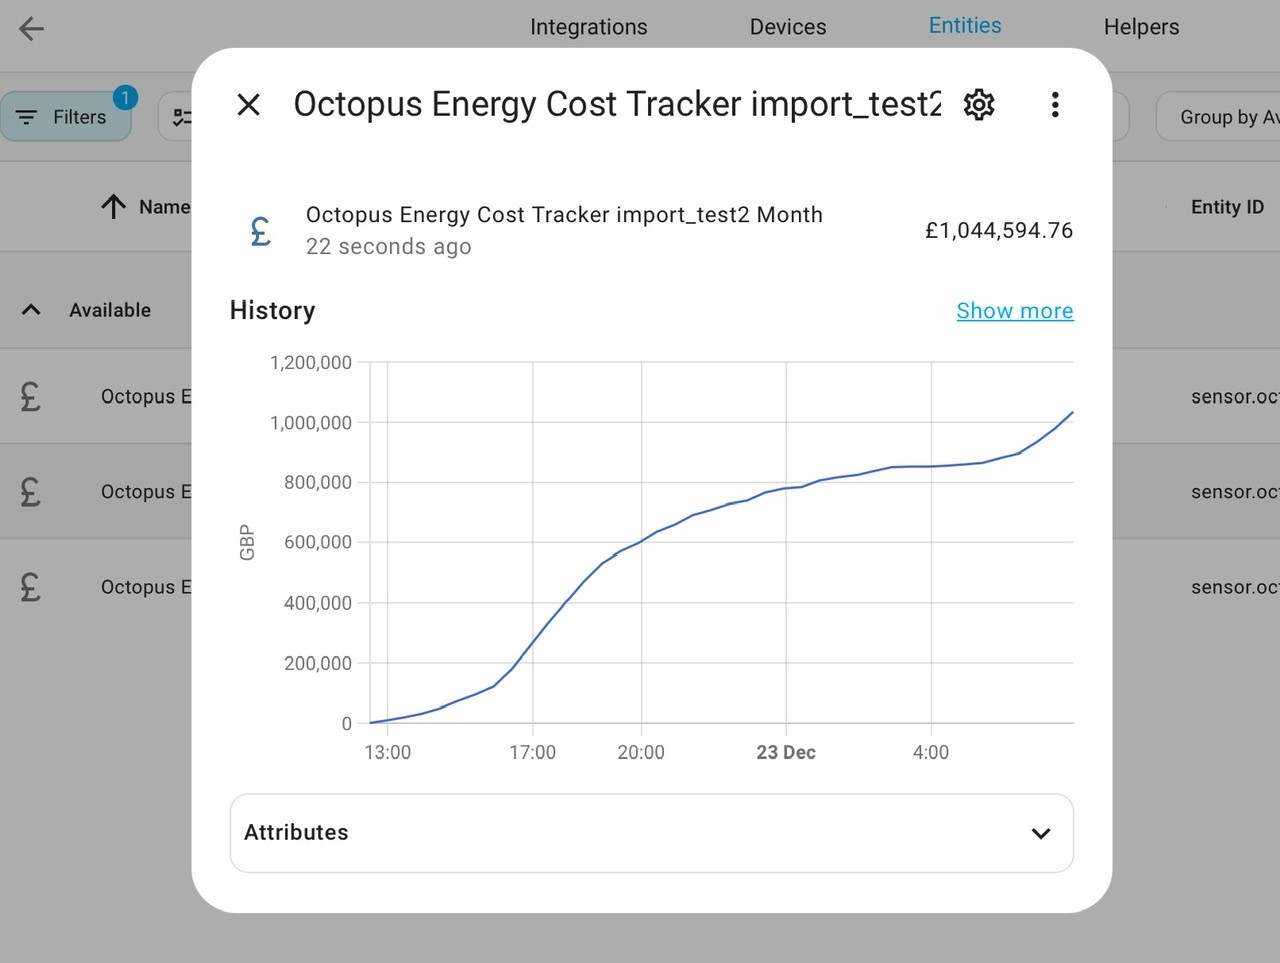
Daveb01 You’ve chosen the Octopus Total consumption sensor which is the all-time total from your electricity meter. So you’d think there’d be a big jump when the cost sensor initialises but what’s weird is that the graph shows it going up rapidly over the last hour.
That’s weird.
I didn’t use that sensor, I used current_accumulative_electricity_consumption which is the ‘today’ meter consumption reading. Also used givtcp_xxx_import_energy_total_kwh which is the givenergy inverter’s reading of total import for all time. This latter one is working fine for me.
Maybe it will reset at midnight at the start of a new day, but its weird the way its going up so quickly
Very weird, I am also glad Octopus do not have this sensor set up or my £700 credit would not last long.
I am now interested to see how far it will go by morning, I will then delete it.
Good job I did not show here this one.
Daveb01 Looking at my 3 cost trackers today after I turned on ‘tracked entity is accumulative’ above geoffreycoan they are all tracking the same with the givtcp import_total and octopus integration current_accumulative_consumption being near identical (slight differences no doubt due to data timing delays):
The cost tracker using the givtcp import_today follows the same shape but starts with a minus figure and is still minus. This may well just be an artefact of it being setup wrongly yesterday.
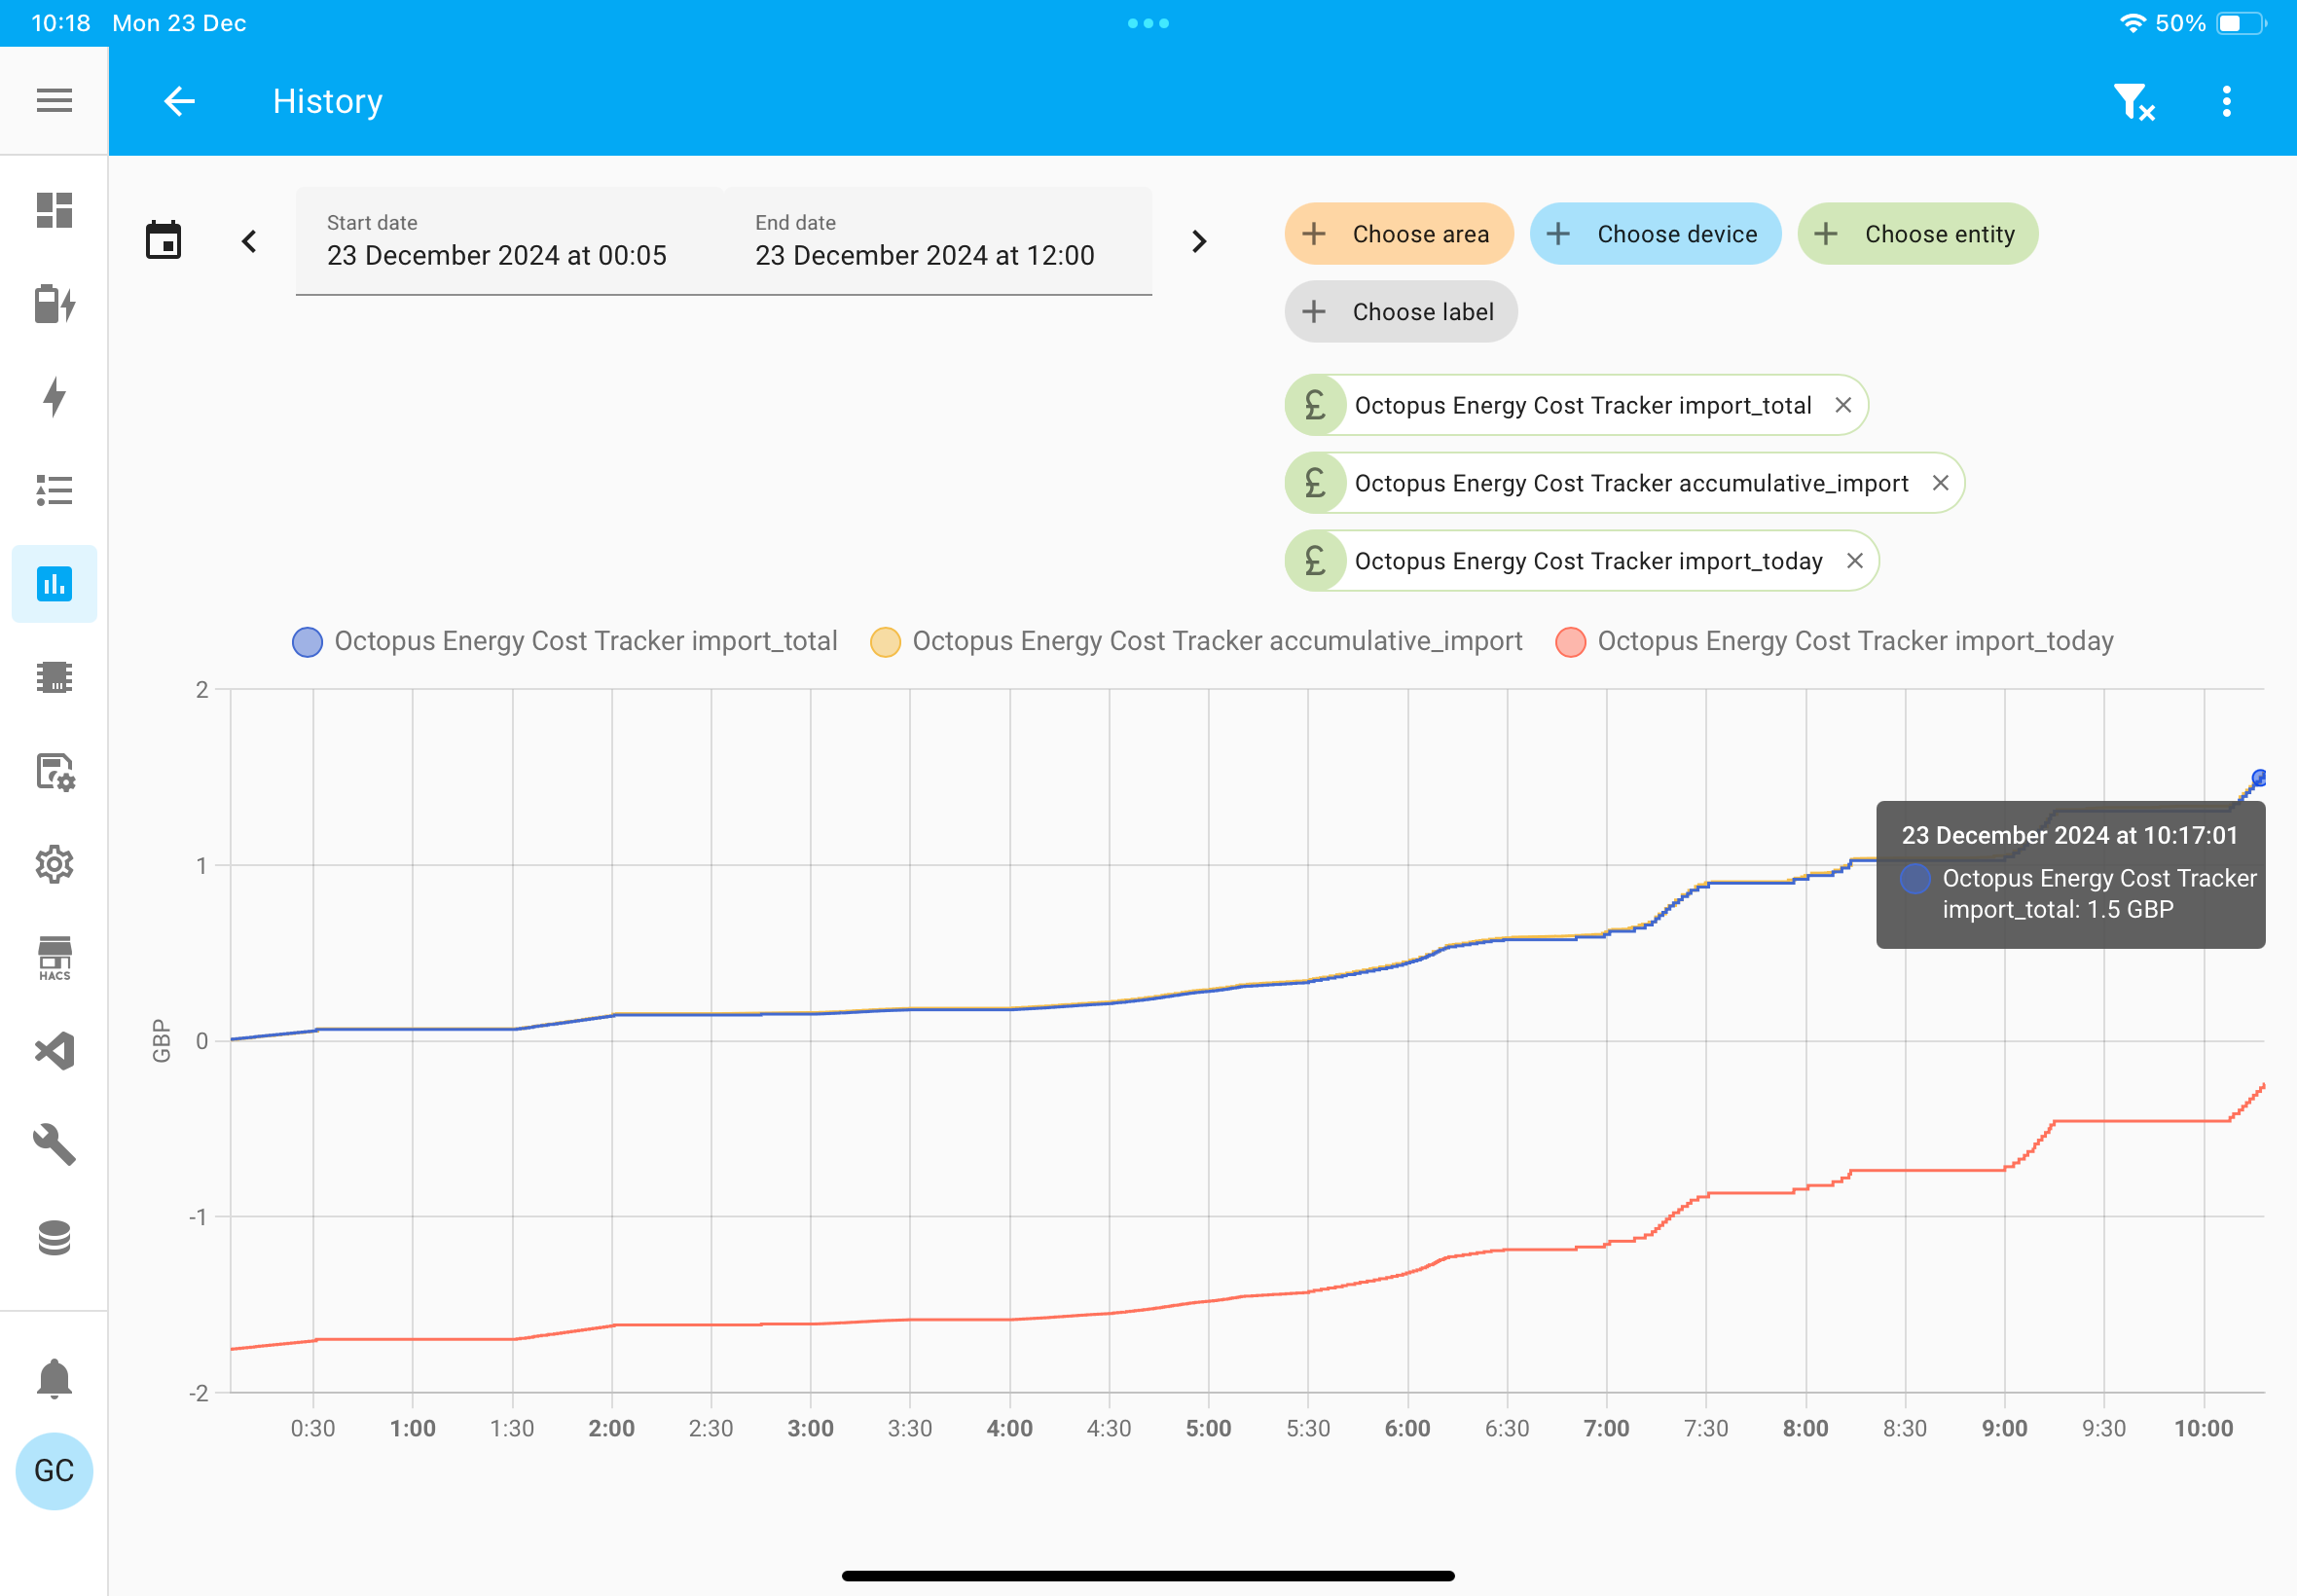
And the top two have the same £ value as I see in my Octopus account from today’s OHM data:
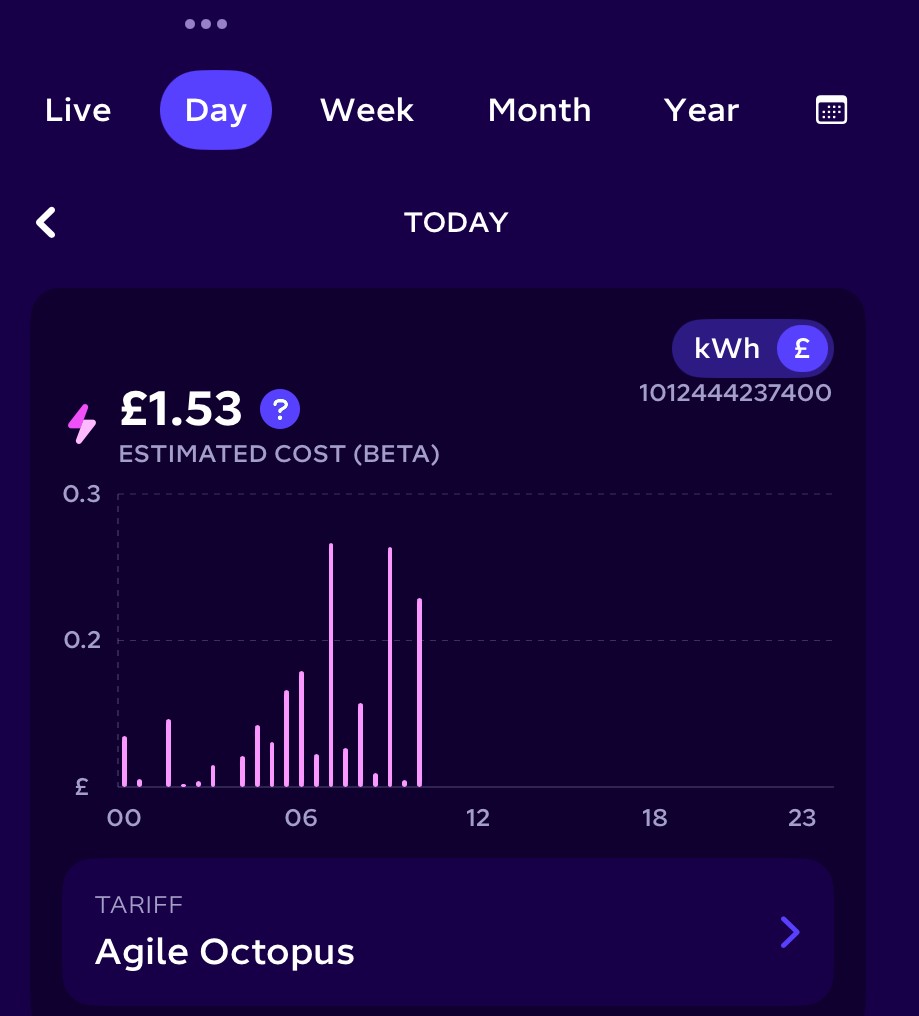
My energy dashboard shows a slightly lower figure but that is probable due to the dashboard running off long term statistics so is up to an hour delayed. I am confident it will come right as the day progresses
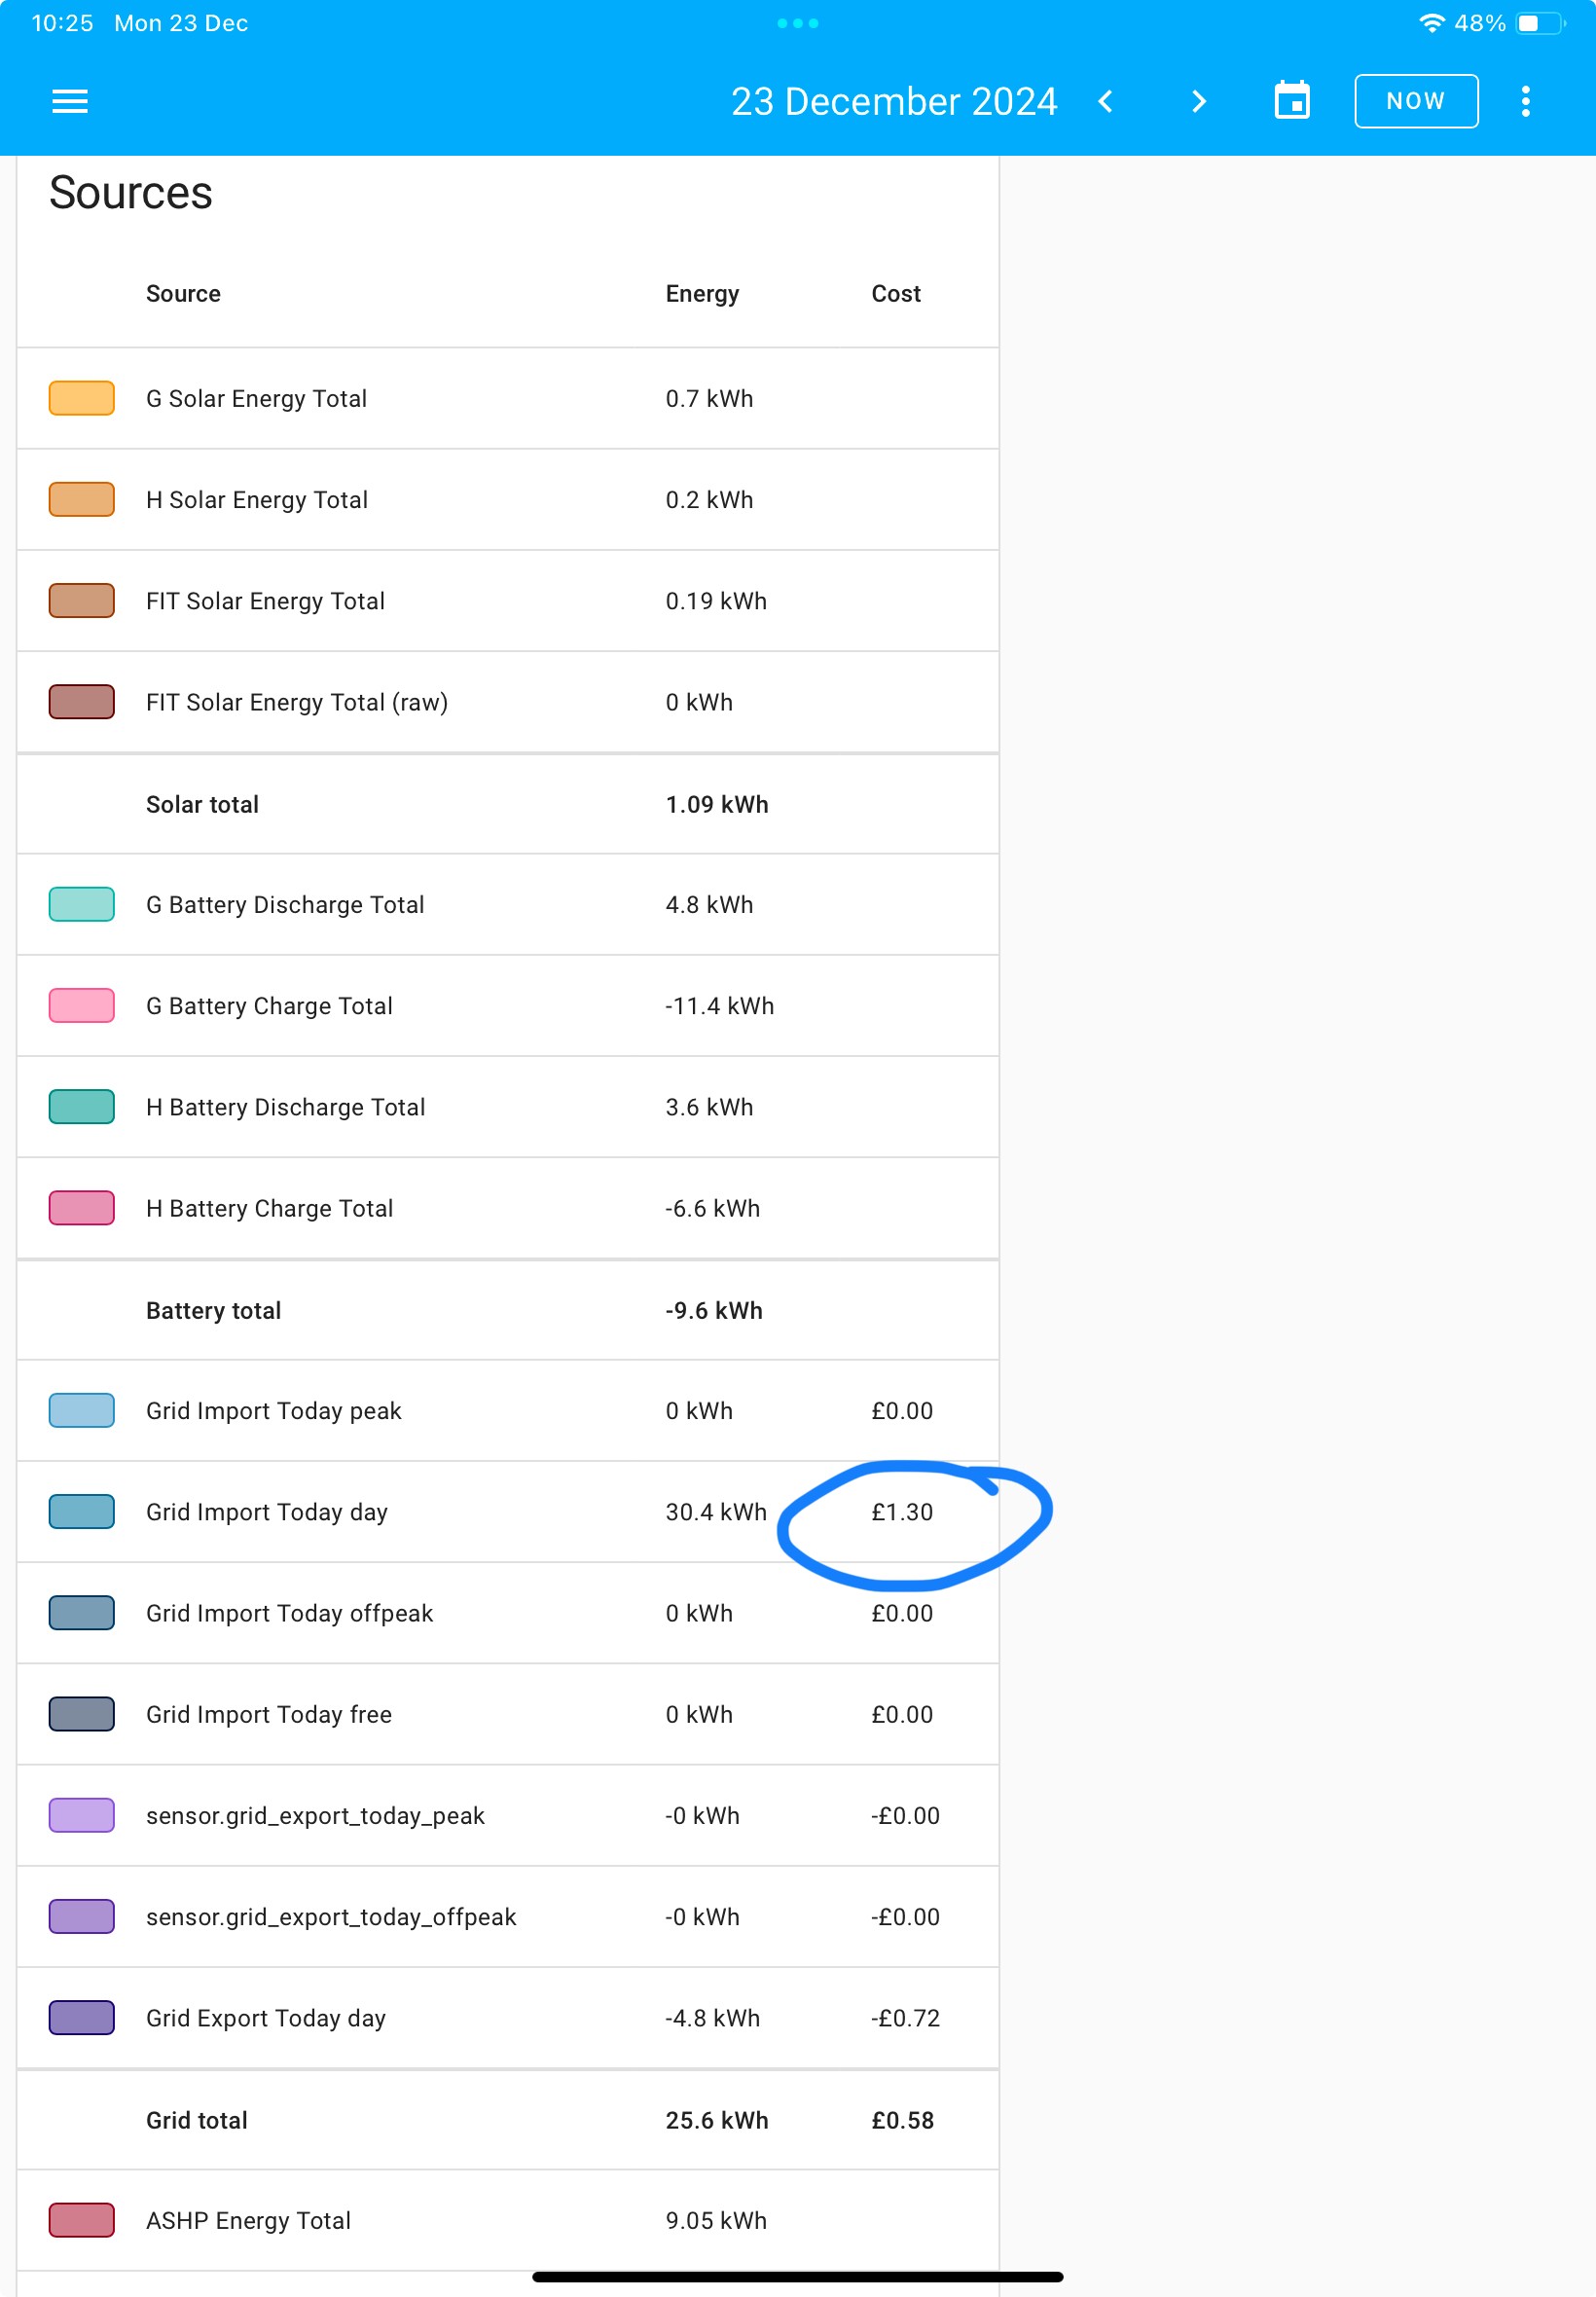
So overall I think these cost trackers work fine Dave
Thank you so much for helping me and hopefully others that have decided to do a Cost Tracker. (I did not know where to start) I am going to delete/shred/burn the £1m cost tracker.
I can now set up what you have.
Have a great Christmas and thank you again.
I’ve submitted documentation changes reflecting the above to the BottleCapDave Octopus Integration https://github.com/BottlecapDave/HomeAssistant-OctopusEnergy/pull/1136
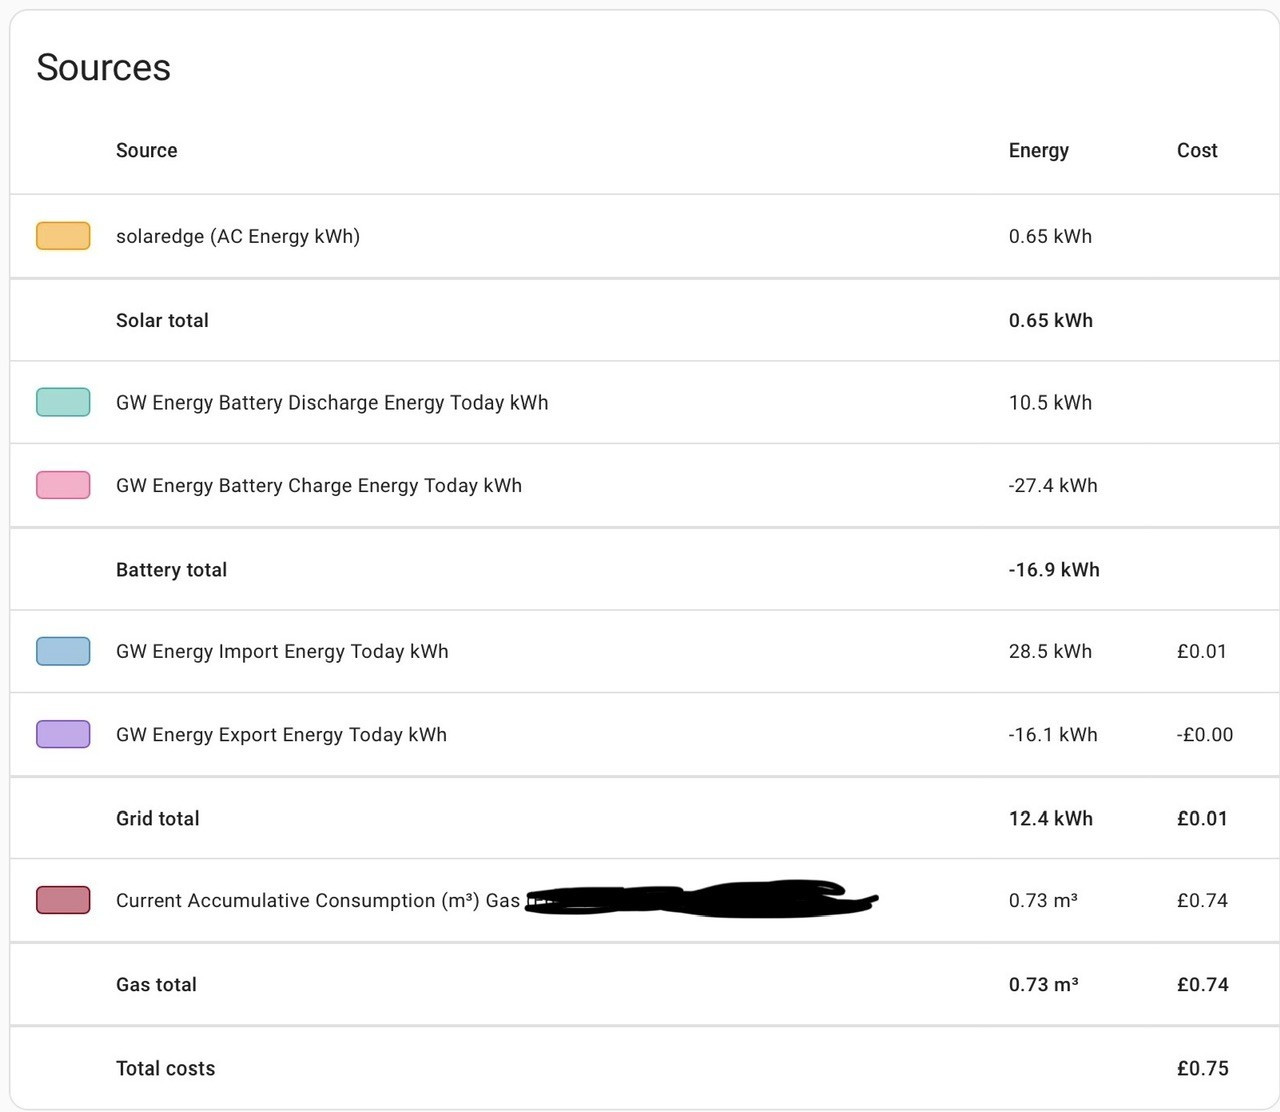
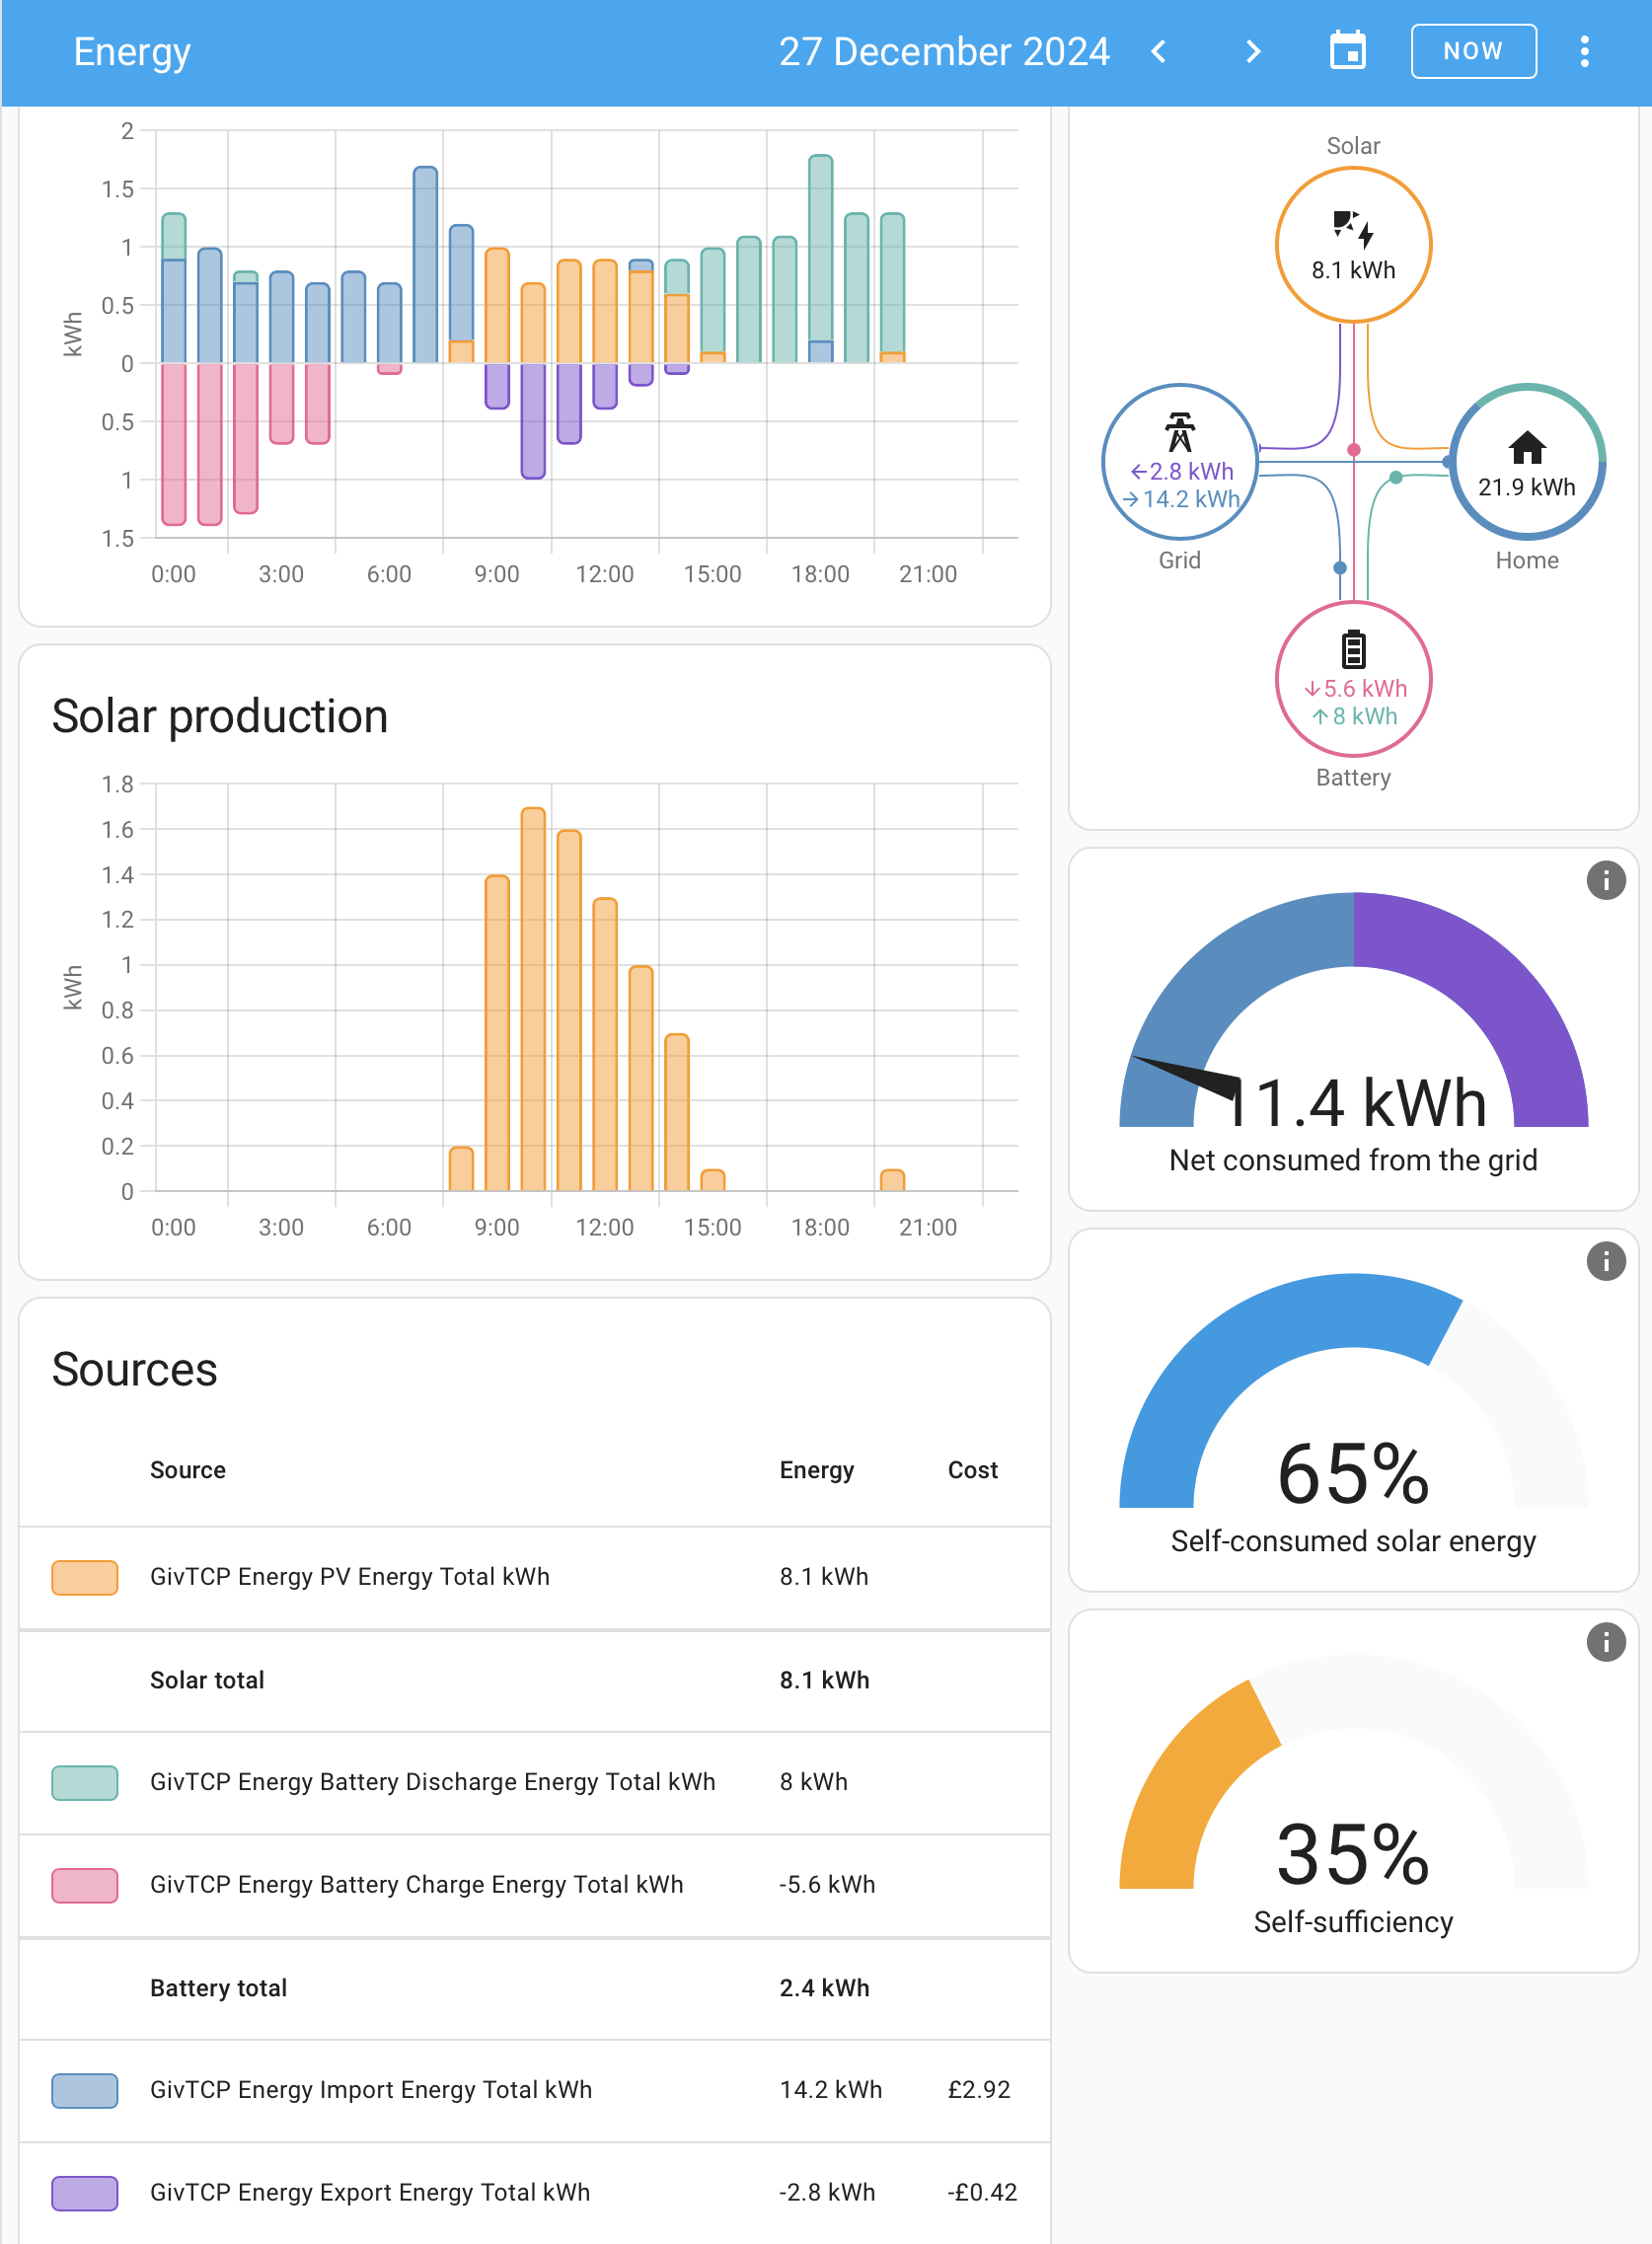
I have been working on my energy dashboard and settings using advice in this thread.
Dashboard
Please look at this and see what you think:
Cost
When inputting Cost, have I selected the correct options. See below:
Anything else?
Thanks
Rob
Daveb01 For PV, you have a Solaredge PV inverter (same as me) and you have selected: 'Solar Edge (AC Energy kWh)' as the source for the energy dashboard.
I don't have this entity in my setup. I do have: 'solaredge Energy today' which gives the info that I need:
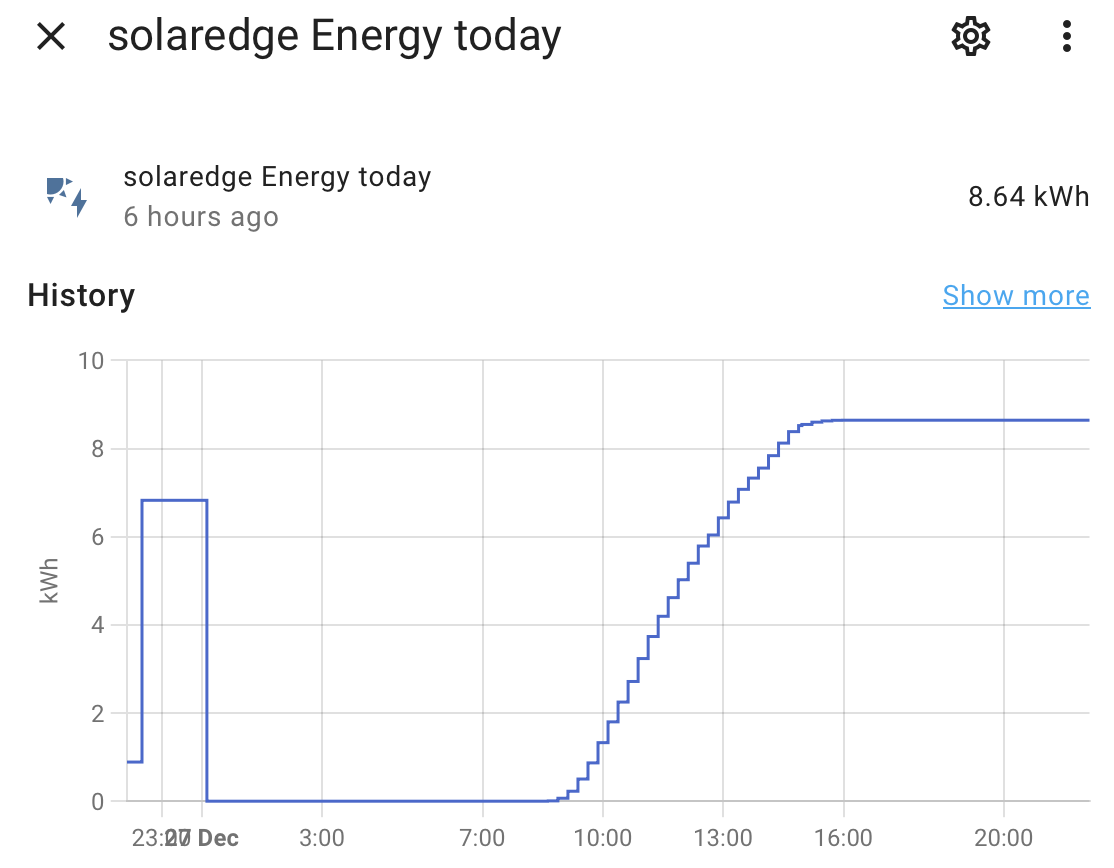
Ignore the square peak 23:00-23:30, a relic from yesterday.
But this doesn't show as an option in the Energy dashboard!
I have therefore used the GE entity: 'GivTCP Energy PV Energy Today kWh' which is an option. This isn't as accurate as via CT clamps.
Any clues as to why the solaredge entity isn't available despite is clearly collecting the required data.
Thanks
Rob
Rbor your setup looks fine. You can change the names of some of those GivTCP sensors to make them look a bit shorter/readable on the dashboard.
Is the solaredge entity recording statistics correctly? The energy dashboard only uses statistics, and statistics are only captured if a set of sensor criteria are met, so it may be that the sensor has something wrong like unit of measurement, or device class.
Have a look at the sensor config in the developer tools, here's my FIT array (provided by a Shelly CT clamp) and my GivEnergy hybrid inverter PV generation sensor configs:


Hi yah, I have a SolarEdge HD Wave Inverter. These are the Sensors I can see?
I installed this via HACS “SolarEdge Modbus” is this the same as you have?
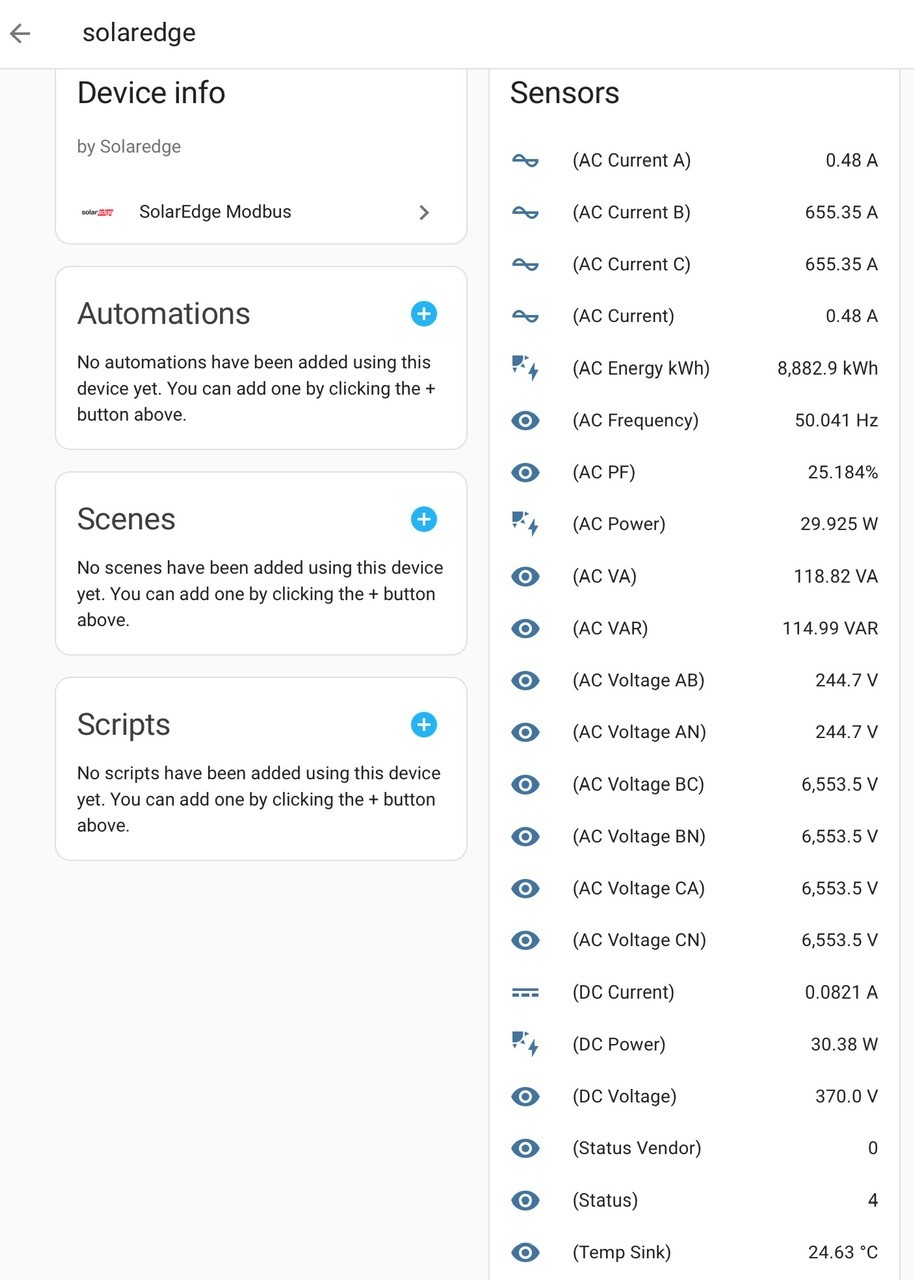
Daveb01 I have installed SolarEdge Modbus integration but all the sensors came up as 'unknown'.
I watched a Speak to the Geek video on how to it enabled modbus on Solaredge HD inverters. A bit scary as I had to logon to the local wifi on the inverter. But it worked and was dead easy to do.
I can now see all the sensors, with values, that you have shown in your screenshot.
Weirdly, the AC Energy kWh sensor appears to show the total energy since my inverter was first installed. I think this is the same in your screenshot above, unless you have generated 8,882.9 kWh in a day!
I have linked the Solar Edge (AC Energy kWh) sensor to the energy dashboard and the bar charts and sources are being populated with correct data. I have now removed the GE PV sensor from the energy dashboard and I will be monitoring how well the Solaredge sensor works.
The Solaredge AC Power sensor shows identical values to the solaredge app.
So looking good for me. Thanks for your help.
The local interface on the Solaredge inverter is a darn site easier to work with that the Givenergy inverter. When I changed my router recently and got new IP addresses generated, all of my devices, including the SolarEdge inverter, picked up the new IP address.
But not the GE inverter! I had to go into the local wifi and type in the new IP address.
I think your inverter is hard wired but these wifi dongles are hardly cutting edge.
I am also going to look at Geoffrey's suggestions for getting my 'Solar Edge Today' entity to work as well.
Rob
Here are my findings after trying the modbus entity.
1. Charts and energy distribution.
I added the Solaredge PV modbus entity.
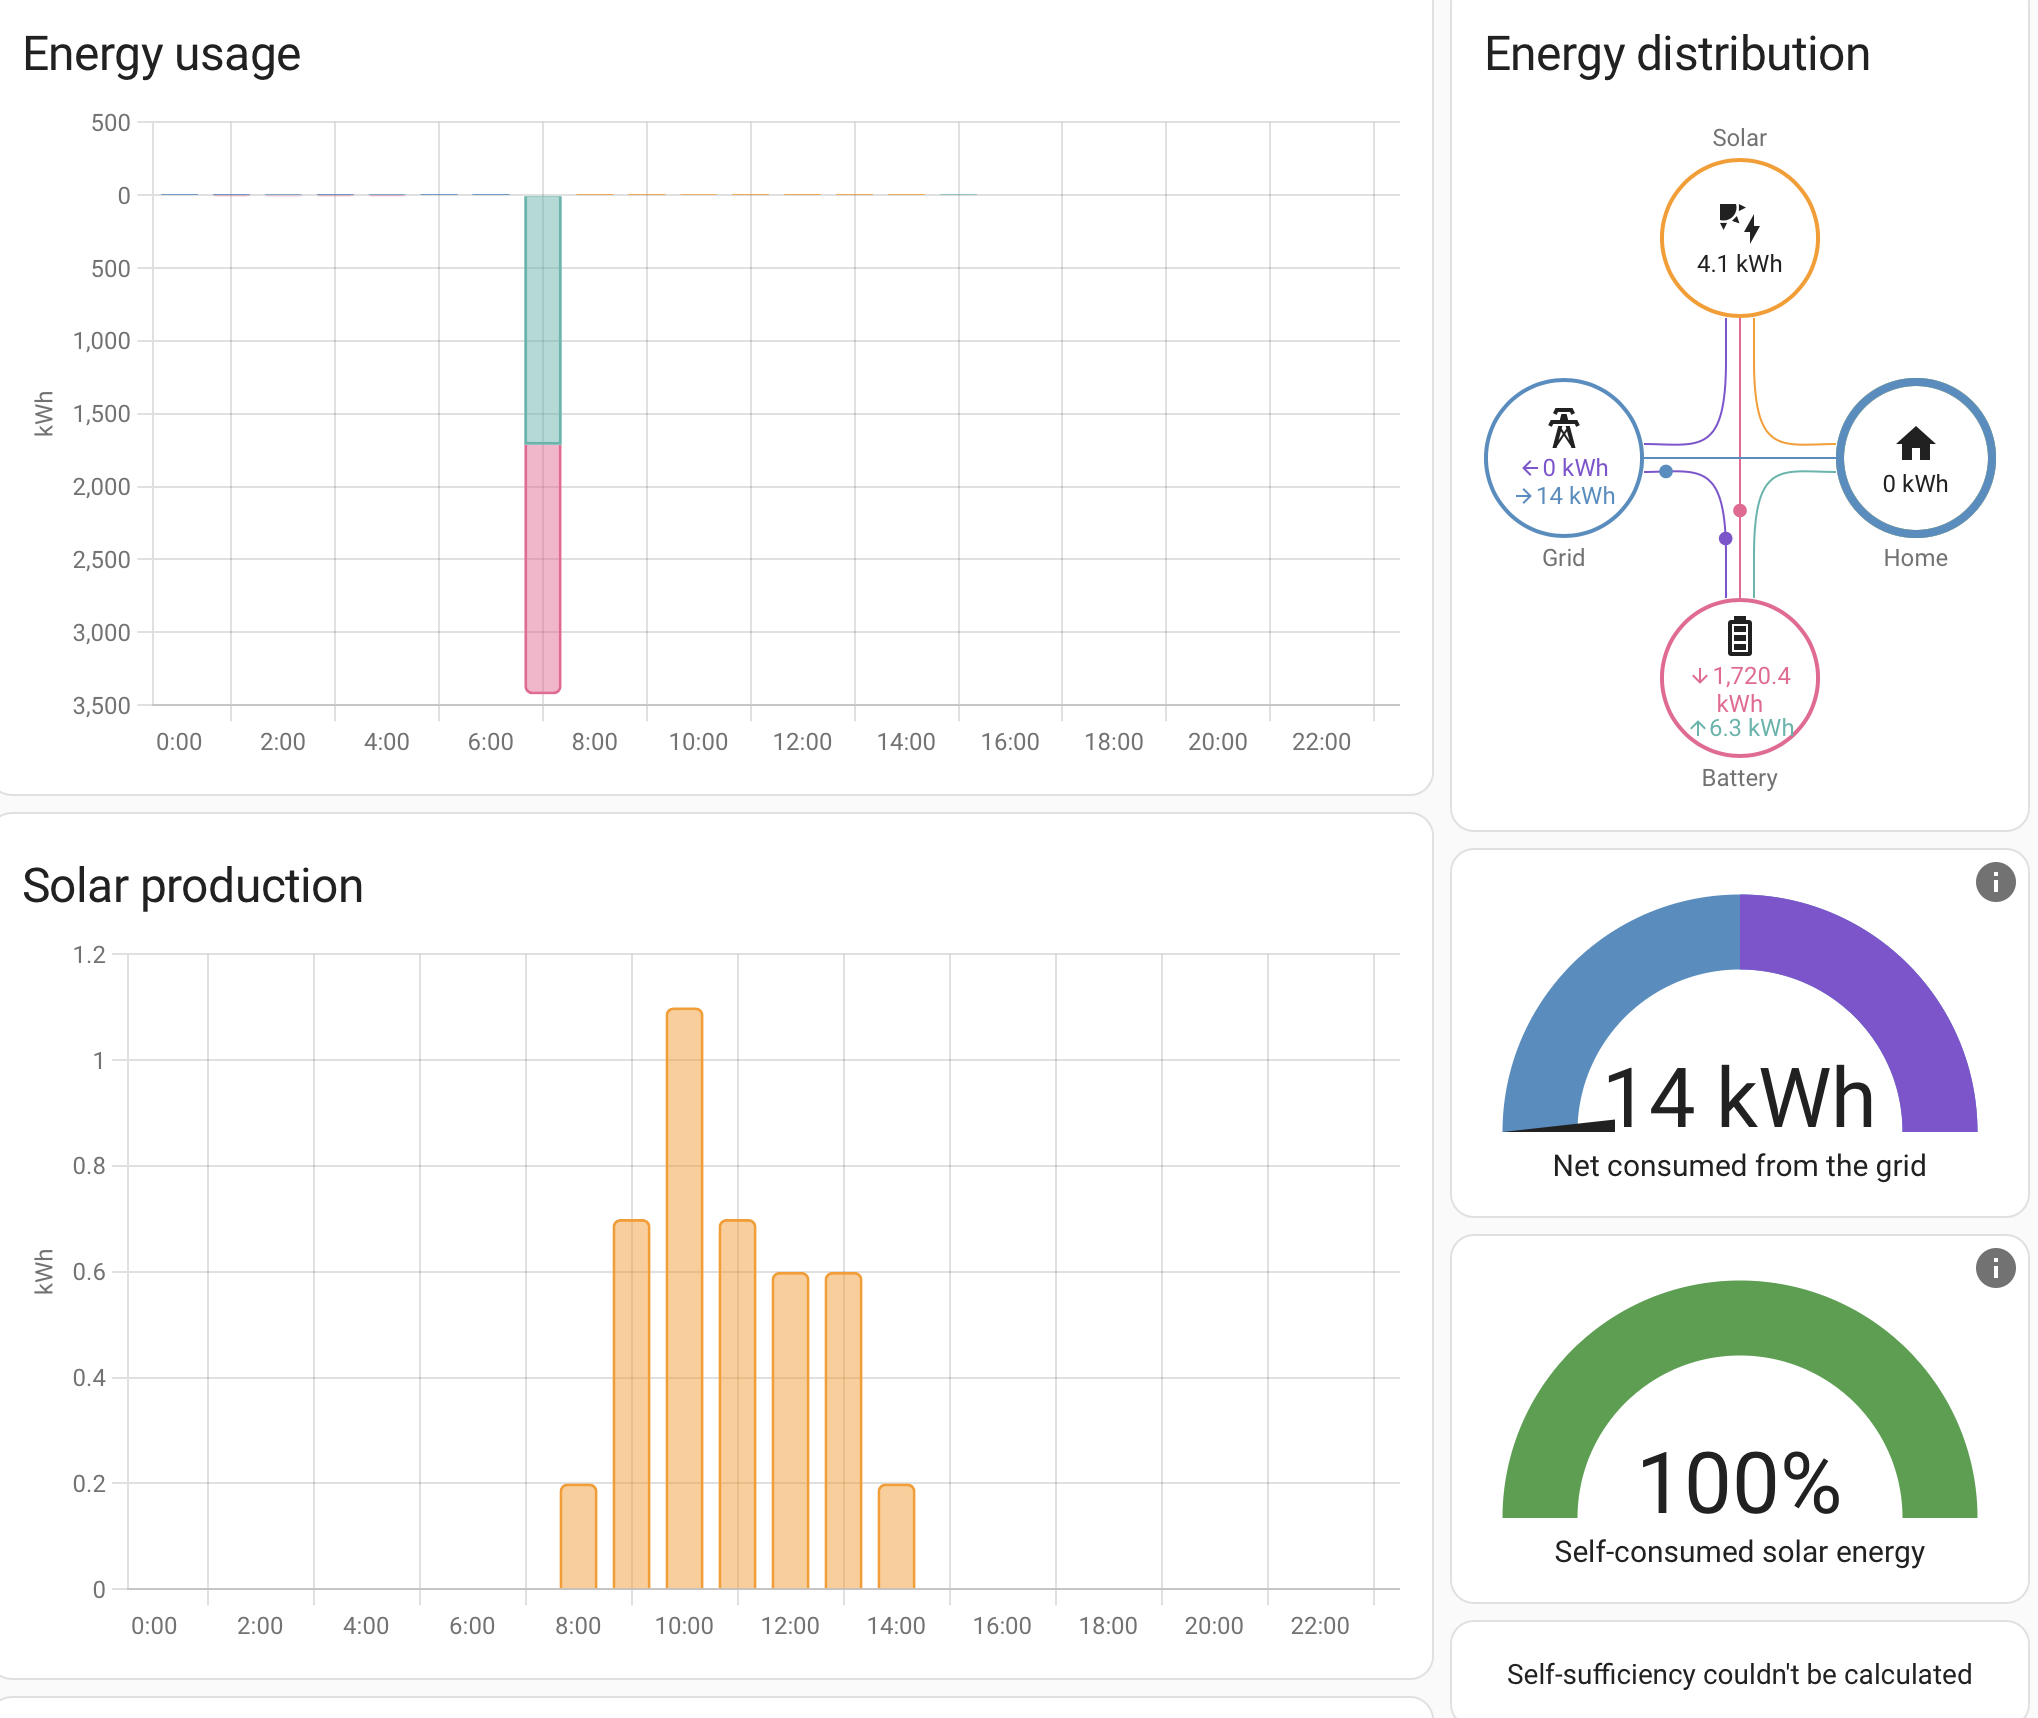
'Battery charge in' has been wrecked with 1,720.4 compared with 5.6 kWh yesterday!
You can see my chart for yesterday a few posts back.
I have gone back to the givTCP PV entity but the data is now in the system!
2. PV entities in Developer tools.
givTCP PV sensor:

Solaredge energy sensor which does not show in energy dashboard configuration

Solaredge modbus sensor which can be added the energy dashboard

I have no idea what is happening nor how to fix this.
Should I start anew with the energy dashboard? I haven't really used it anyway.
Or can I remove the data added by the solaredge modbus sensor?
Thanks
Rob
Rbor I have no idea what is happening nor how to fix this.
As ever, the answers are in the documentation with some clues sprinkled by me above. It is as I suspected, here’s the relevant article https://www.home-assistant.io/docs/energy/faq/
Might be able to fix this by creating a template sensor by wrapping the broken solaredge modbus one…
(I’ll leave you to work out from the documentation why it doesn’t appear, and how you can fix it)
Rbor I have gone back to the givTCP PV entity but the data is now in the system!
Or can I remove the data added by the solaredge modbus sensor?
The energy dashboard can be thought of as just a ‘view’ of existing HA sensors (in fact to be more specific, the long term statistics of HA energy sensors). So if you don’t want something to appear on the energy dashboard you just remove it from the energy dashboard configuration. This is how you can swap between the GivTCP today and total sensors as long as they are both populated.
As for totally removing the sensors, you just delete them in HA, and then you can remove them from long term statistics.
geoffreycoan Some homework for me but I have already spent most of the day on this.
My issue now is that the required 'energy in' to battery sensor contains some dodgy stats:
GivTCP Energy Import Energy Total kWh
I don't want to delete it cos I need it but mended!
For now I have replaced this in the energy dashboard with the 'Today' equivalent which gives the extra large peak at midnight.
I will learn more from the HA documentation and then report back. For now, I will leave you in peace.
Rob
Rbor i think you can clear the history of the entity in the developer menu. Hopefully that'll sort it.
TX200 Thanks.
The challenge for me is how to do this!
I have Geoffrey's HA documentation link to check out but I am so tired of this now. 😥
Rob
Rbor My issue now is that the required 'energy in' to battery sensor contains some dodgy stats:
GivTCP Energy Import Energy Total kWh
I don't want to delete it cos I need it but mended!
That sensor is your grid import sensor that you would use on the ‘Electricity Grid’ part (top left) of the Energy dashboard configuration.
The battery sensors (top right) are GivTCP Energy Battery Charge/Discharge Total kWh or something similar.
I can’t understand how you have “polluted” the GivTCP sensors with data from your solar edge inverter, they are different sensors in Home Assistant and so would be totally separate things.
If you want to edit the sensor history, fortunately you can do that, but it’s quite long winded.
Developer Tools / Statistics / search for sensor name / click the right hand icon of a slope / choose the date then the time you want to correct
What you will see now is the long term statistics for that sensor/date/time. They appear as a series of delta values over a 10 minute period, so simply change the delta to what you want (which you could get from the GivEnergy portal data). e.g. if the portal shows the import data like this:
10:30 102.4kWh
10:35 102.6kWh
10:40 103.1kWh
10:45 103.2kWh
10:50 104.1kWh
Then. the corresponding delta values in the HA statistics will be:
10:40 0.7 (the difference between the 10:40 and 10:30 values)
10:50 1.0 (likewise difference between 10:50 and 10:40 values)
It is quite laborious as you have to change one value at a time, but as soon as you change a value you can see what it looks like in the energy dashboard.
But just having had the solar edge data in HA shouldn’t have corrupted the givtcp data at all so hopefully you won’t need to resort to this
I have found the slope thing and have played with it but to no avail so far.
I came to the same conclusion as you. The solaredge sensor isn’t responsible for the glitch. I have thought about just leaving it until tomorrow and then put the ‘battery charge Total’ sensor back.
The glitch happened 7:10 or 7:15 am this morning with 1715 kWh going into the battery (supposedly)
Rob
Rbor The glitch happened 7:10 or 7:15 am this morning with 1715 kWh going into the battery (supposedly)
That is a different issue. Did you restart HA at around that time? I've found that the sensors sometimes get random large or small values when you restart HA. I quite often have to fix the underlying sensor data, just setting the errant value to zero
geoffreycoan The battery sensors (top right) are GivTCP Energy Battery Charge/Discharge Total kWh
Yes it is the battery charge sensor and not the energy sensor that I incorrectly referring to.:
GivTCP Energy Battery Charge Energy Total kWh
I think I have sorted it. The chart for today is now as it should be. Compare this to my charts several hours ago:
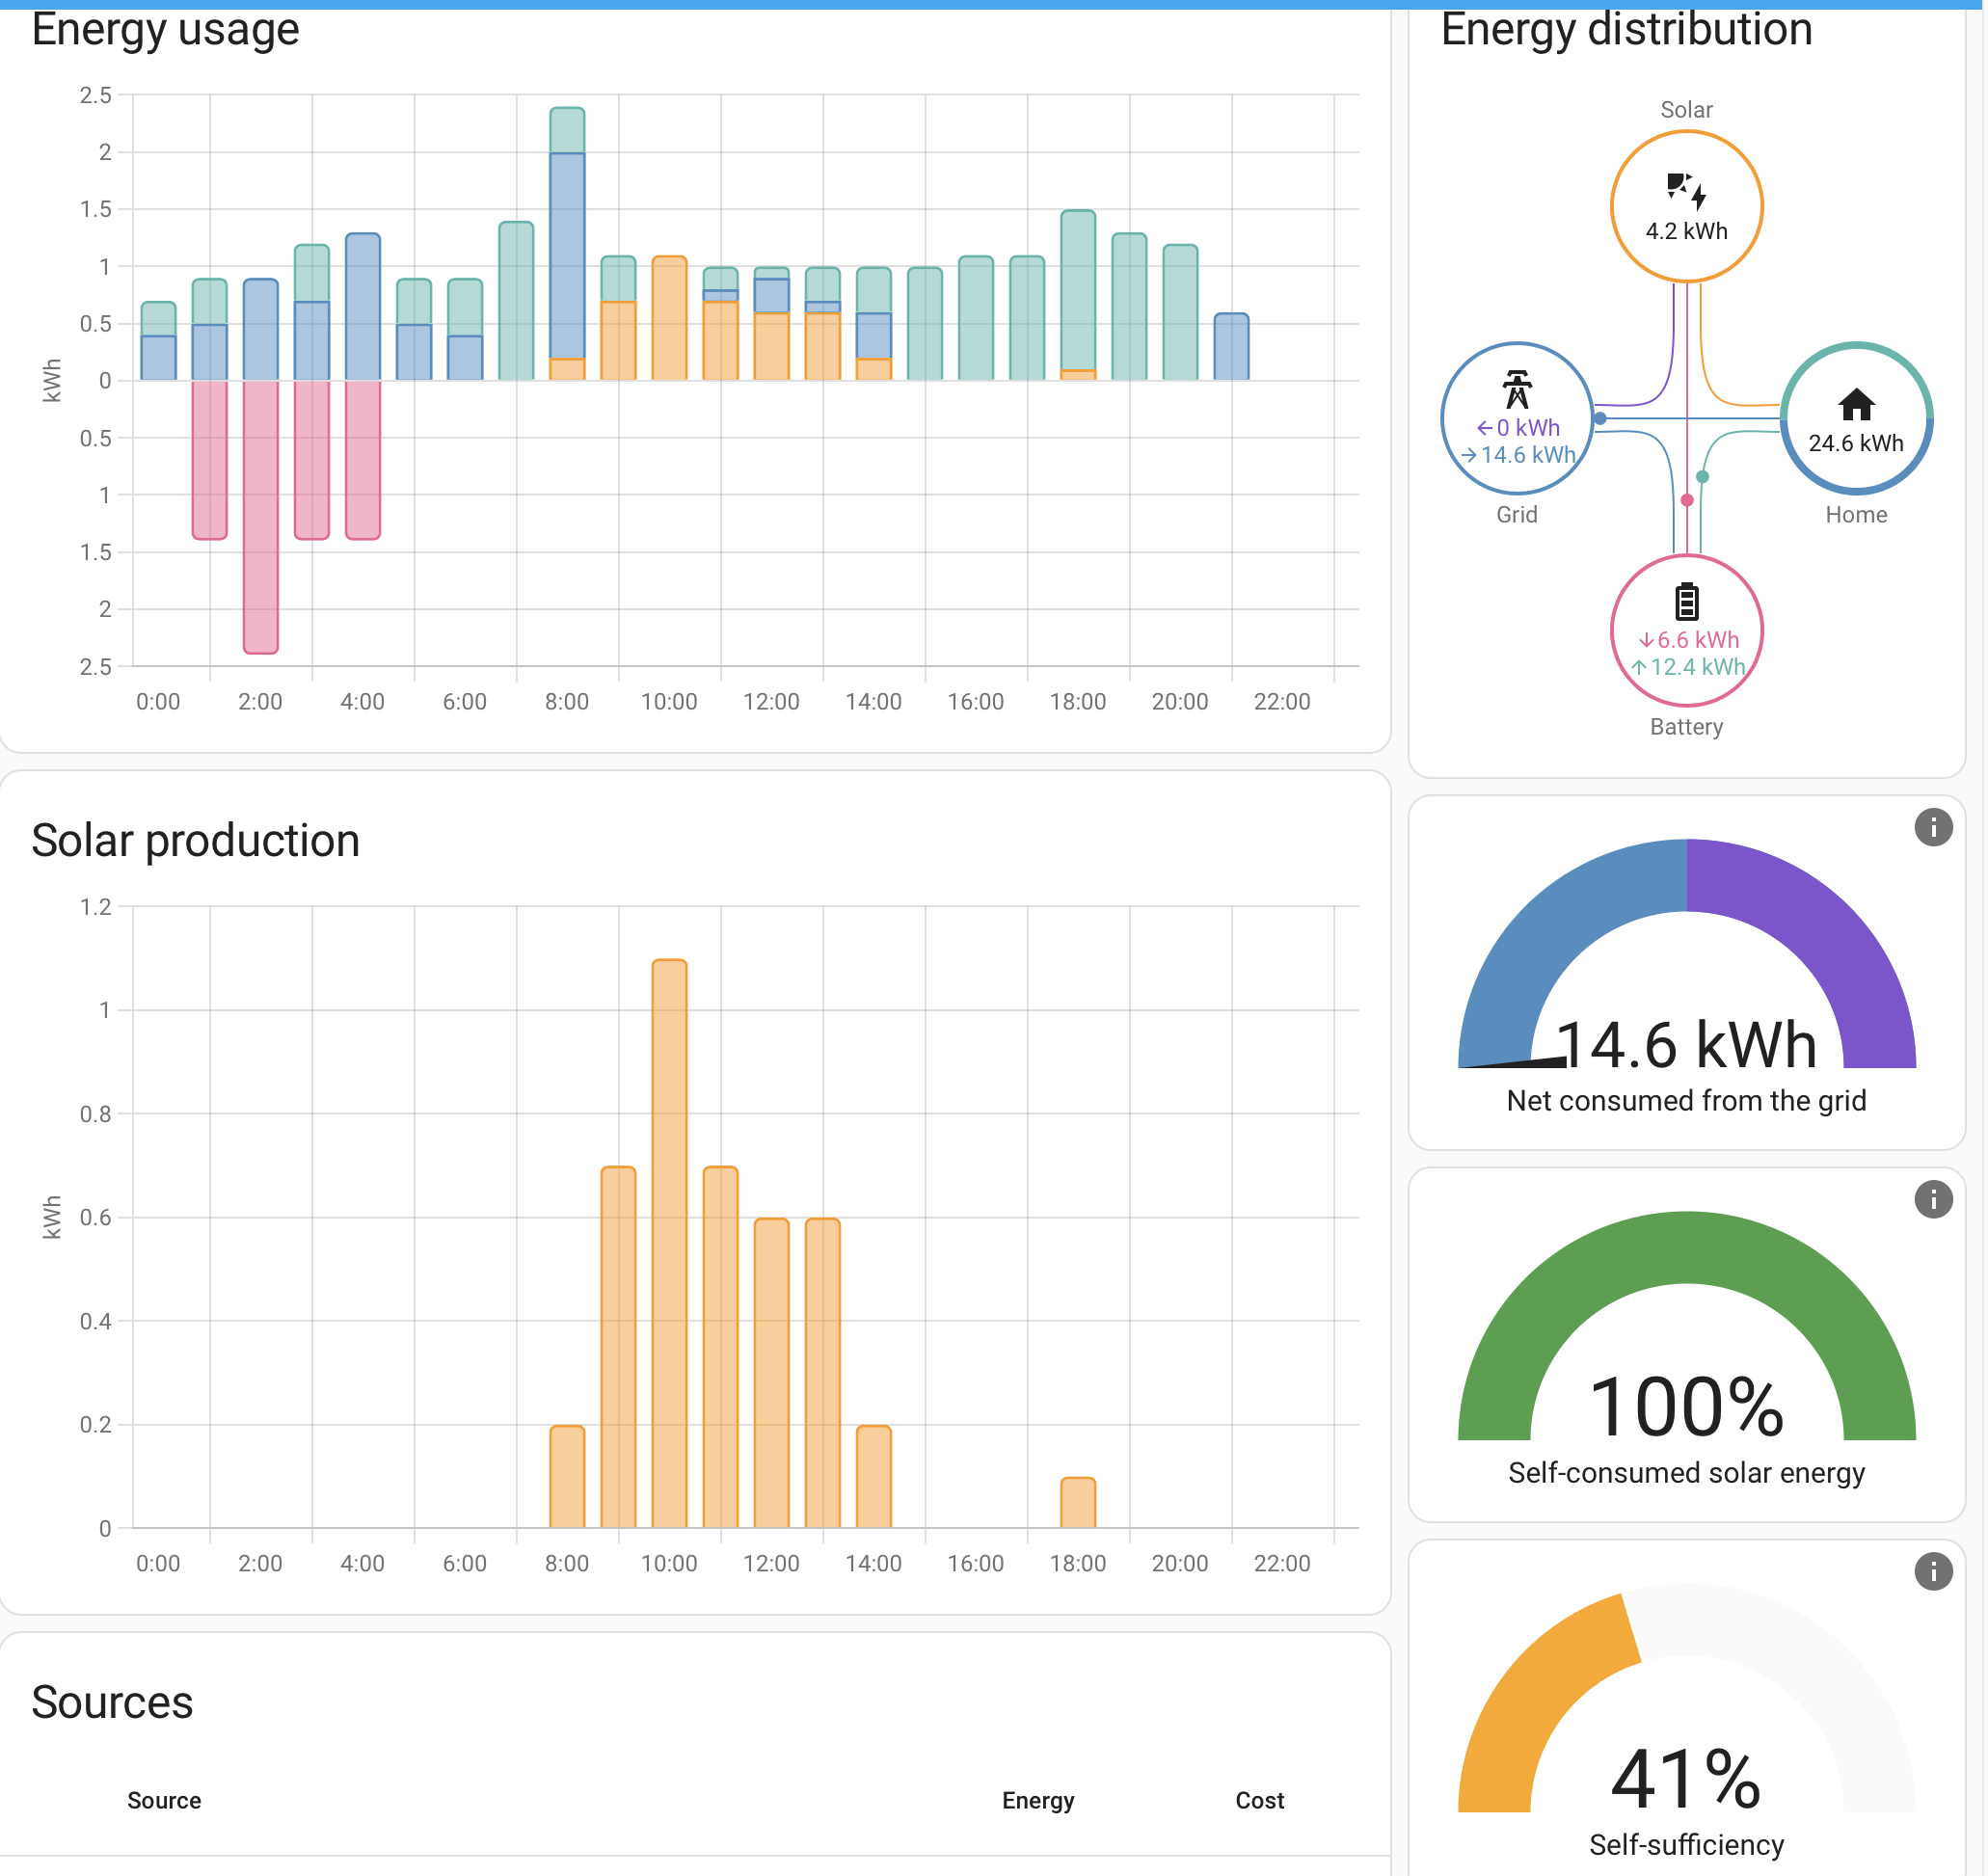
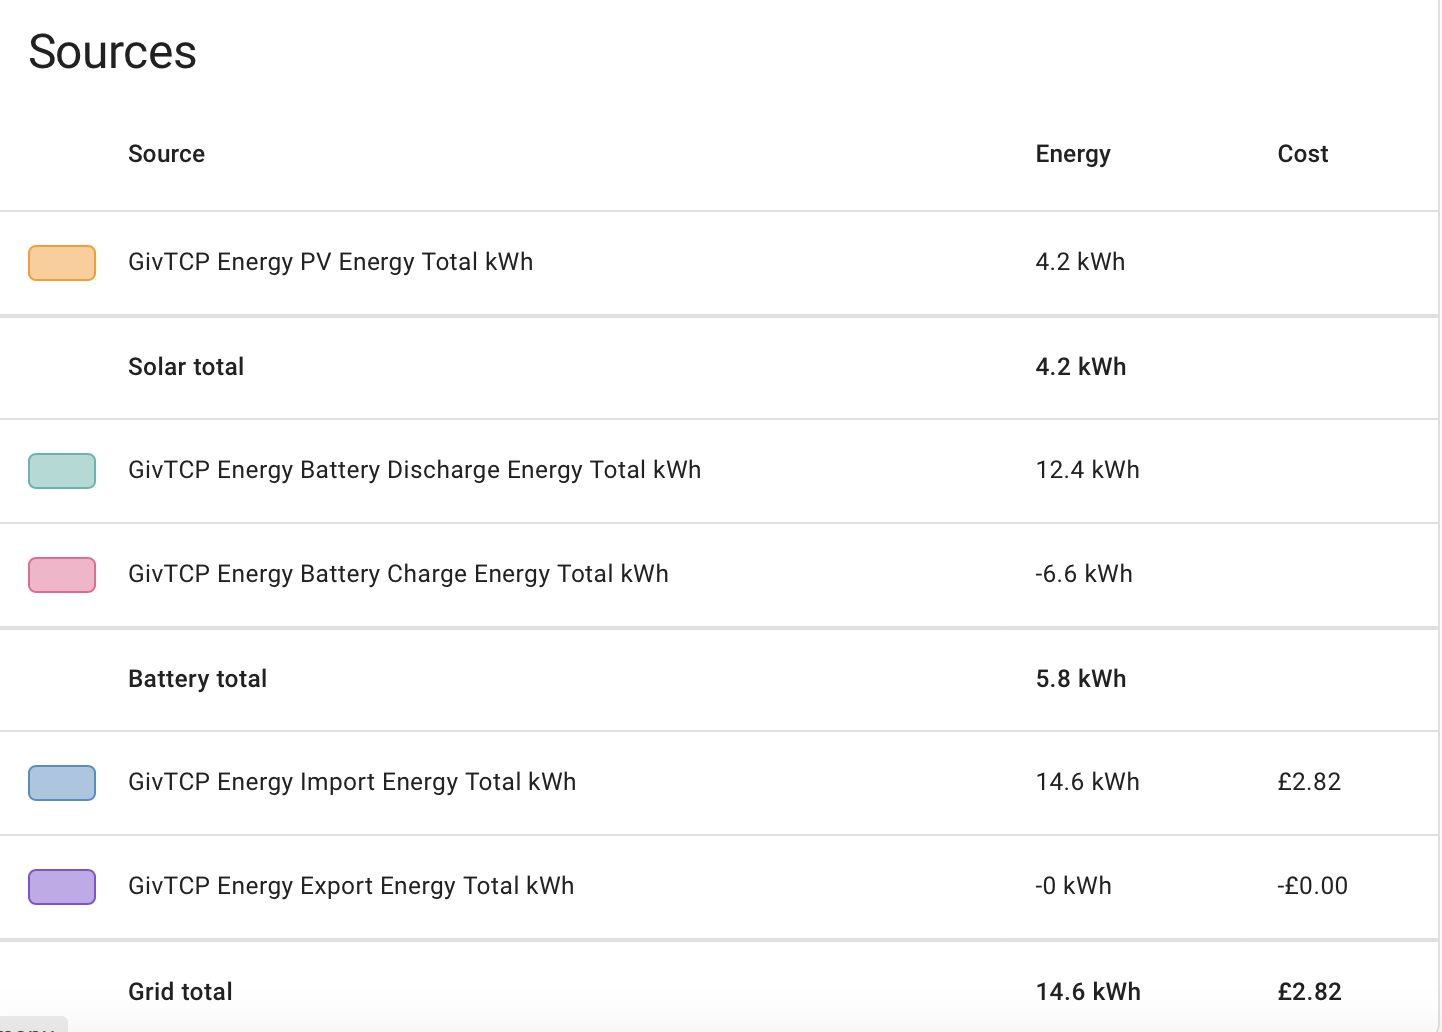
I went into Developer Tools/Statistics and filtered down to the sensor above.
I selected 'Outliers' and I tried to change the rogue readings at 7:10 am and 7:15 am this morning.
I also spotted a large difference back in November! I changed this and I had then got rid of all the large data values, some nearly 2000 kWh.
I now have all 'Total' sensors in the Energy dashboard.
However the history data for the last 2 days looks like this:
I will see what it all looks like tomorrow.
I didn't find the HA documentation that useful and I ended up experimenting with what seemed sensible. Changing the times is very unintuitive.
Thanks for the help with this. I am trying to learn and to improve but it is such a long process and has occupied a good chunk of my time today.
Rob
Rbor I went into Developer Tools/Statistics and filtered down to the sensor above.
I selected 'Outliers' and I tried to change the rogue readings at 7:10 am and 7:15 am this morning.
I also spotted a large difference back in November! I changed this and I had then got rid of all the large data values, some nearly 2000 kWh.
Yep, that’s the right way to do it. I personally prefer to find the errors on the energy dashboard and then set the time manually, but the outliers should fast-track you to the problem areas.
However the history data for the last 2 days looks like this:
history-8.txt12kB
It unfortunately will do. What you have been manipulating is the long term statistics that the energy dashboard uses. There isn’t a way of changing the sensor values other than SQL in the database which I wouldn’t recommend (or personally try). The sensor values will disappear in 10 days or whatever you have set your history retention to in configuration.yaml so you’ll unfortunately have to live with it.
It’s likely that several of your sensors had data bounces around the reset time, both the today and total ones, and import/export/charge/discharge. Seemingly a subset at random. It was raised as a givtcp bug and some changes were made but its still happening, a bit less with the total sensors than the today sensors, but I still have it happen.
I’m using utility meters on my energy dashboard for ‘today import’ so I can switch between ‘free’ and ‘day’ tariffs so that the pricing is correct. Also still got utility meters for my export as a legacy of being on Flux (that I will sort out on my long list!).
Utility meters seem particularly prone to getting data jumps on restart and it severely messes up my ‘house load today’ sensor which is a template sensor based on the underlying today givtcp sensors. Trying a fix for that at the moment …
I didn't find the HA documentation that useful and I ended up experimenting with what seemed sensible. Changing the times is very unintuitive.
The whole statistics dialogue is awful. I have fed that back to youtubers who probably have the ear of the HA developers; they agree with me! I look in hope for an improved version at each HA release ….
geoffreycoan Thanks. I hope I am getting there.
I am going to review some videos of Smart Home Junkie tomorrow to remind myself of helpers and templates (with a bit of Developer tools thrown in).
Recently, I have been helping out some folk who don't know how to set up anything. Some randomly select timed charge and export when they really need to just select Eco to get themselves started. I took one through how to set up Cosy slots on the portal.
I do worry that folk are buying expensive gear but don't know how to use it. I think that some installers just run away once they have commissioned. Mine certainly did and I was left to fend for myself. My installation was made worse by not being able to log into the portal. It took several days to get the installers back and the glitch was that they had spelt my email address incorrectly. They didn't check with me that I could log into the portal (or even tell me that there was a portal!)
Rob
I am hopeful that I have filtered out most of the dodgy data in the last few months.
Today looking optimistic so far.
This is the first time I have really understood the energy dashboard.
I notice that bottlecapdave uses accumulative cost values for tracking consumption but these give the same deltas as the Import and Export energy totals that I am using. The only difference (and it is small) seems to be the actual values. So I guess this doesn't matter.
I have worked out a system for using Developer Tools/Statistics and have really learnt something here.
I looked back to the other threads on the energy dashboard including https://community.givenergy.cloud/d/5384-spurious-givtcp-readings-in-ha-energy-dashboard/2 and apologies to you – You had already explained in detail how to use Developer Tools/statistics to remove anomalous values. I was not looking at energy dashboard at the time and hadn't read any of this.
A question
I know that you are using the Solcast integration rather than Predbat's inbuilt method.
Was the reason something to do with the energy dashboard.
Some of the grey stuff invaded my sky yesterday and today looking similar. We just need some wind (and it looks like it is coming). I have washing piled up and an overflowing dishwasher waiting for some low overnight rates.
I am hoping that my energy bill for December will be under £100, including SO, but will be tight. I also hope that 2024 will be a 'no energy cost' year for me, with a small profit.
Rob
Rbor I notice that bottlecapdave uses accumulative cost values for tracking consumption but these give the same deltas as the Import and Export energy totals that I am using. The only difference (and it is small) seems to be the actual values. So I guess this doesn't matter.
You could use either but there are reasons for why I use current rate:
I looked back to the other threads on the energy dashboard including https://community.givenergy.cloud/d/5384-spurious-givtcp-readings-in-ha-energy-dashboard/2 and apologies to you – You had already explained in detail how to use Developer Tools/statistics to remove anomalous values. I was not looking at energy dashboard at the time and hadn't read any of this.
😁
A question
I know that you are using the Solcast integration rather than Predbat's inbuilt method.
Was the reason something to do with the energy dashboard.
There are a few reasons but the primary one yes is the energy dashboard, when using the solcast integration it can feed the forecast generation through to the energy dashboard. This is one feature that the predbat direct solcast API calls doesn’t provide.
I am hoping that my energy bill for December will be under £100, including SO, but will be tight. I also hope that 2024 will be a 'no energy cost' year for me, with a small profit.
Your super-designed heatgeek ASHP installation is saving you loads compared to mine, my bill for yesterday was £12 so I’m on track for a £200 bill in December.
Looking at the Octopus app my annual import costs are £92 more than my annual export income, but then I remembered that I’ve had the free electricity, the powerup and DFS session savings on top of that so I should end up with a small profit as well. Phew !
geoffreycoan More questions on Energy dashboard.
1. Changing solar sensor.
I now have direct access to a Solaredge sensor (same as used by @Daveb01).
This has the advantage over the givTCP sensor which uses a CT clamp for its info.
Ideally, I would like to swap over to the Solaredge sensor for monitoring PV.
I guess that there is no way of displaying past records from the givTCP sensor and to record just from the Solaredge sensor from now on?
Or is it a case of starting anew using the more accurate solaredge sensor.
I am thinking that I will continue with the givTCP sensor and accept that the data isn't quite as accurate.
EDIT I have just watched a video from Speak to the Geek on setting up Utility meters to do this: https://www.youtube.com/watch?v=YPPpwTKIz7M
Is this your setup also?
Would it work with Solar PV data? And would it solve my problem?
2. Consumption totals
Under the charts, the energy dashboard summarises source data for Solar, Battery and Grid.
This is useful for collating information from the charts.
However, the solar consumption isn't shown. There are gauges which show kWh consumed from grid, but then %s for 'self-consumed solar energy' and 'self-sufficiency' (whatever that means!)
Is there a better way of comparing consumption data?
Or should I look at some of the other energy charts available?
Thanks
Rob
Rbor Answering your questions
Yes you are correct I have utility meters for my solar, battery charge, discharge, import and export per the speak to the geek video and they were what I originally used in my energy dashboard.
I have been moving away from them, mainly due to the spike problems they suffer when restarting HA that using the Total sensors don’t have. Also having had an inverter replaced under warranty I found that they just changed the serial number of the new one to match the old so the original premise of utility meters abstracting from the underlying sensors to protect against serial number changes isn’t as relevant as I thought it was.
If you had created a UM for the original solar and then swapped it to the new solar feed it would however have given you the solution you wanted. But if you create a new UM then it won’t have any history ported over.
There isn’t an easy way of doing this, the way I think I’d suggest is to add the solar edge, remove the givtcp PV and then move the history from the givtcp PV into the solar edge sensor. Sharing how to move sensor history around is something I will share once I’ve perfected it myself.
You can compare energy data in the dashboard to same prior period (top right, three dots, click the ‘compare’ option).
If you are looking at a single day, compare will compare it to prior day
Looking at a week, compare will compare to prior week
Month, prior month,
etc
But there isn’t capability to specify the comparison date range, e.g. compare this month to same last year.
Some people push data through to a separate database and use Grafana to do such comparisons, not something I have ever looked at because I get pretty much what I want from the energy dashboard and a parallel spreadsheet
Don’t forget you can also add the Solar prediction in the Solar graph now (pic 1)
Plus if you click the 3 dots top right you can now add comparison (pic 2)
Opps I have just copied the writing from the boss, oh I will now fail my exam for coping. Sorry Geoffrey.
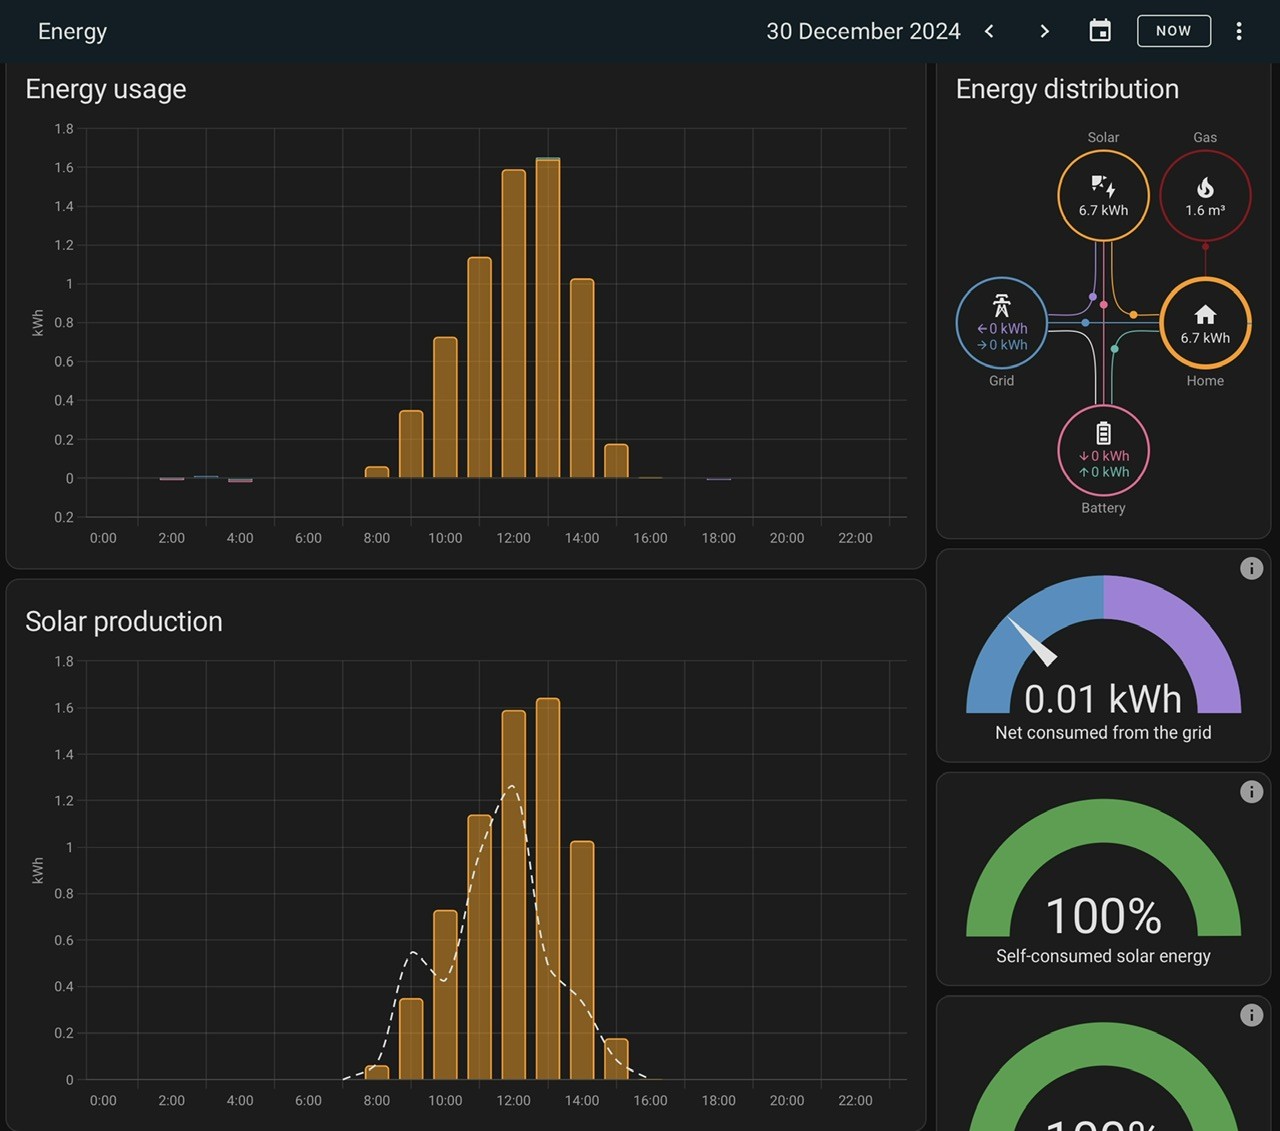
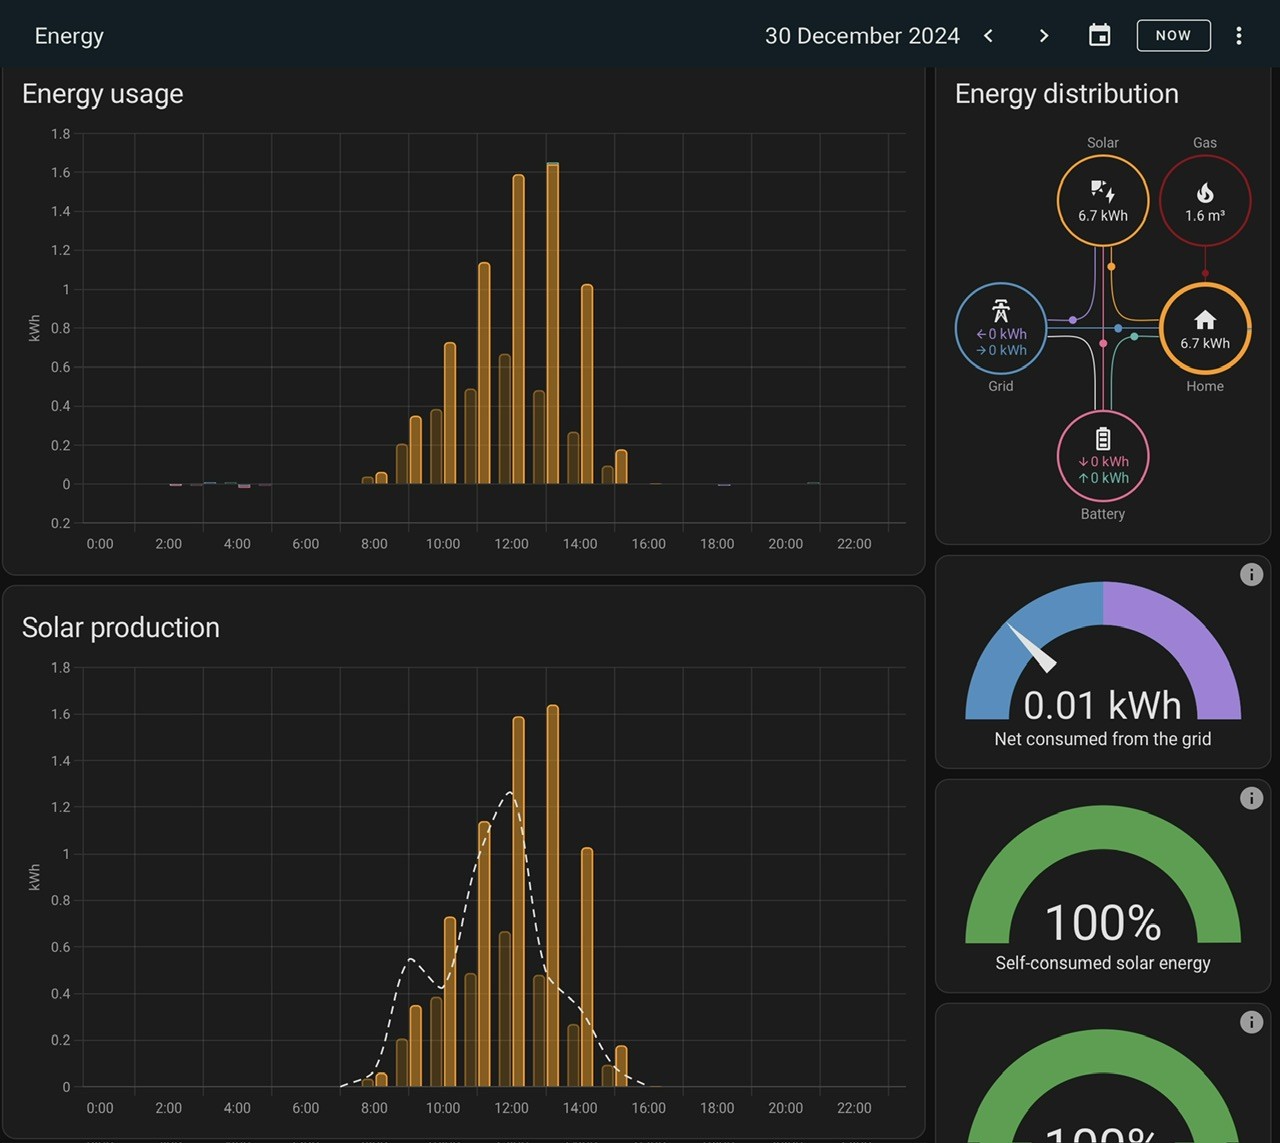
And if you look at a longer time period you can see the prediction over that period.
Pretty accurate (I did tweak Solcast down a touch in the summer as I wasn't achieving my pv50 predictions most days)
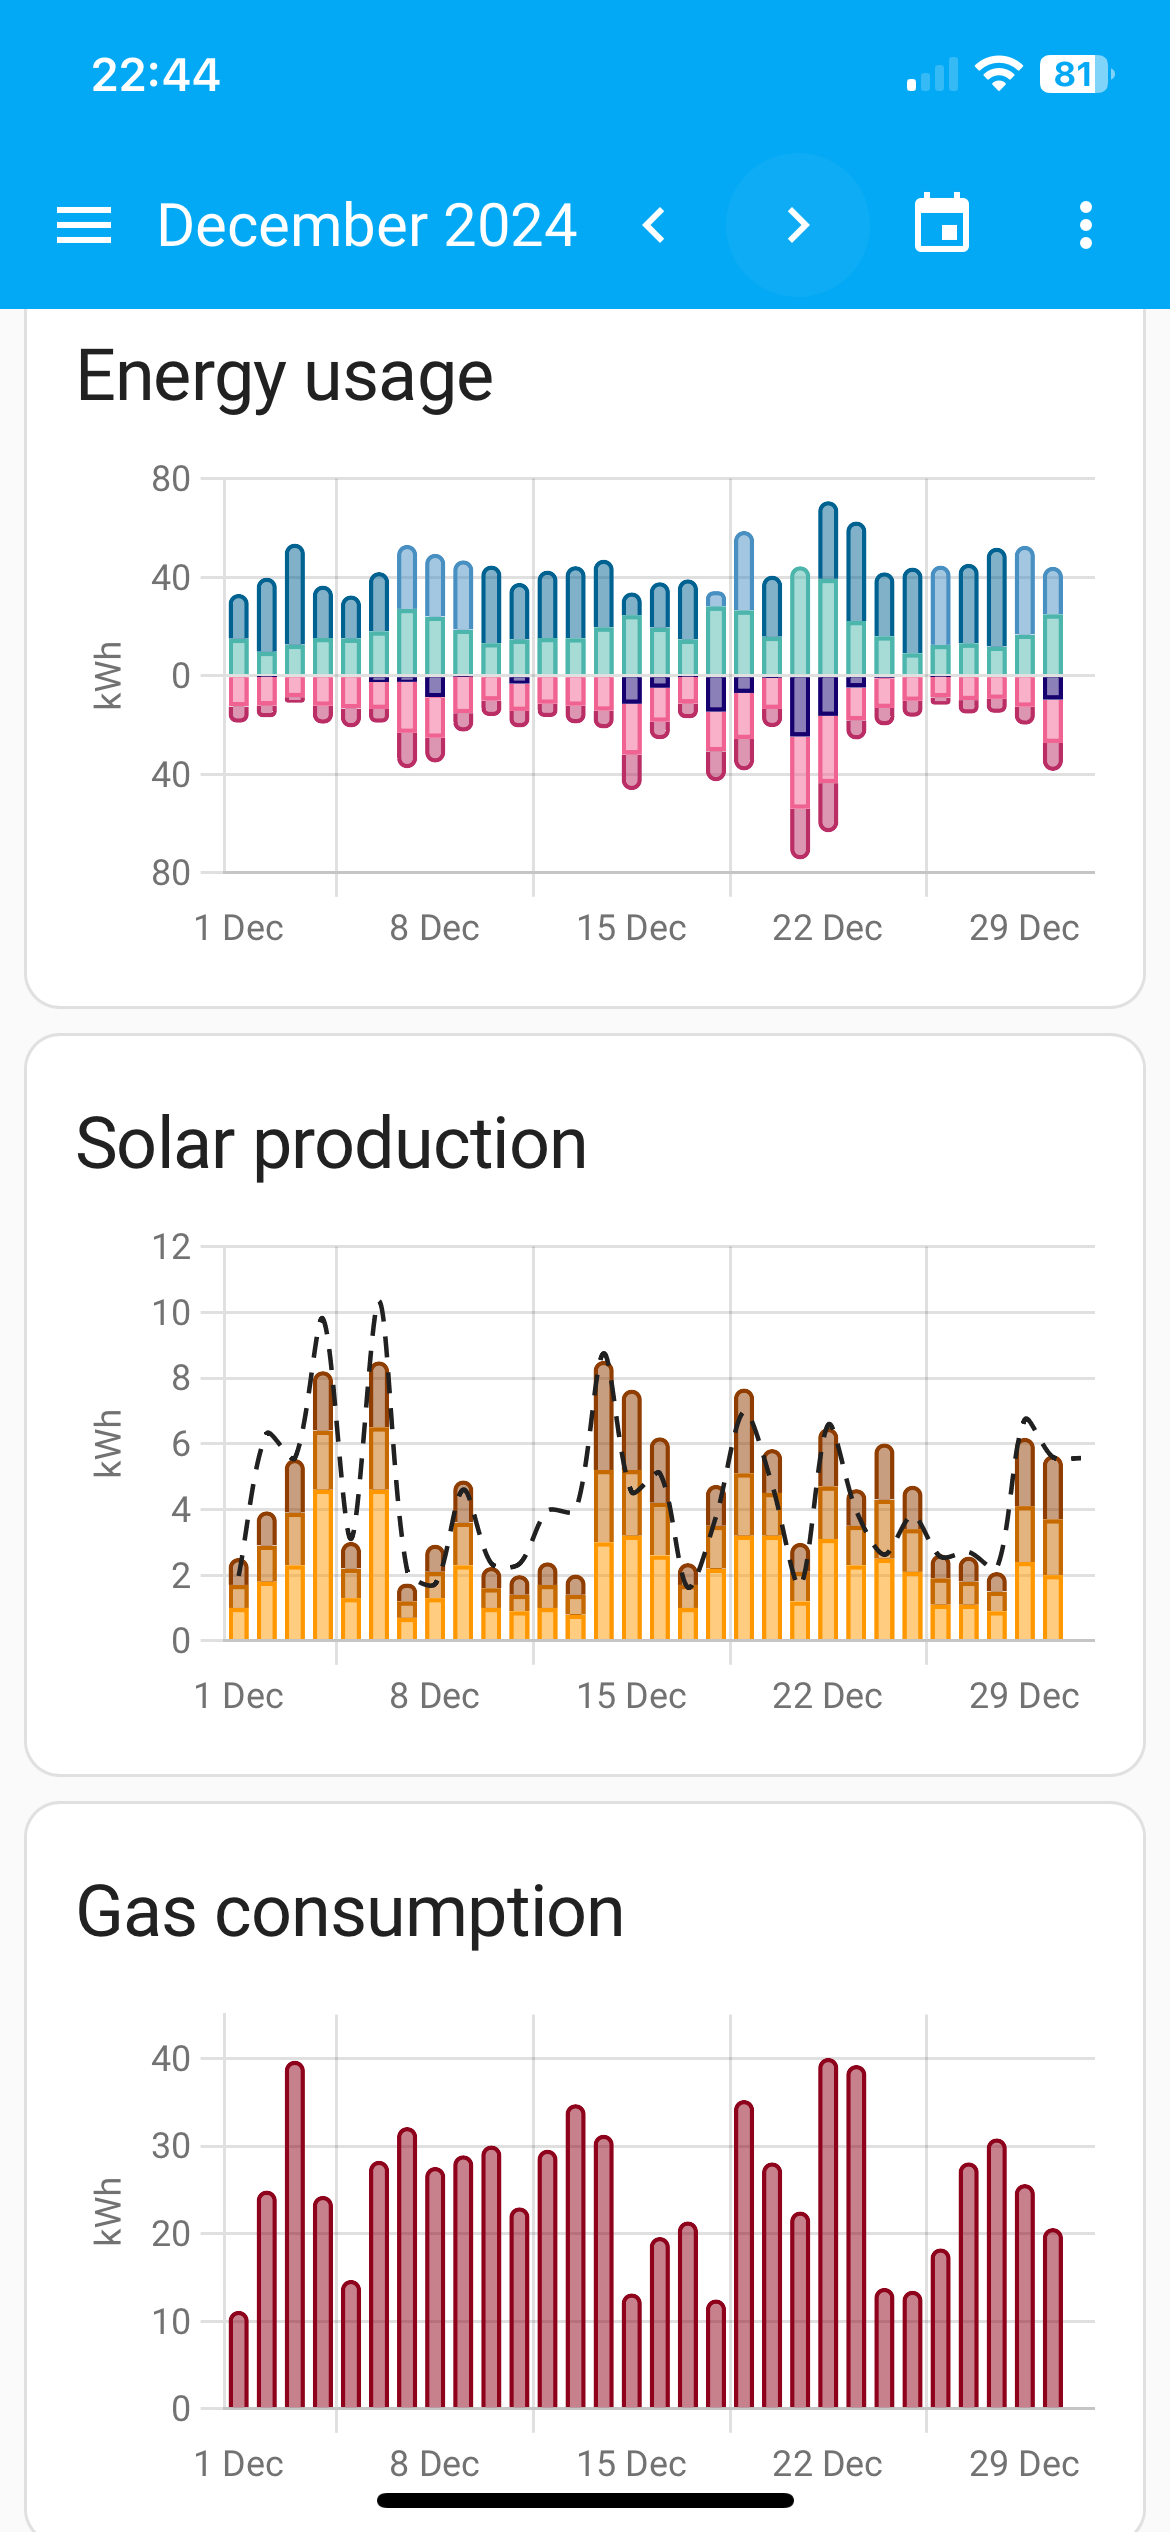
Daveb01 geoffreycoan Solar prediction in the Solar graph
I would like to show this but would need to use Solcast integration (I am using predbat direct Solcast method). I like the simplicity of the direct method but the dotted prediction lines do look neat.
I am late to the energy database party but think I have got my head around how it all works (even to the extent of removing random peaks that shouldn't be there using Developer Tools/Statistics.
Rob
Hi yah, as the dark side is down, I will have to post here.
I was halfway through updating the forcast apex card when the website went. It was working ish, but you mentioned you use solcast entities instead of my Predbat PV entities. And guess what I have messed it up, but got most of the headings working and the graph. When you get 5 mins and have the time can you have a look and advice please what I have missing or done wrong.
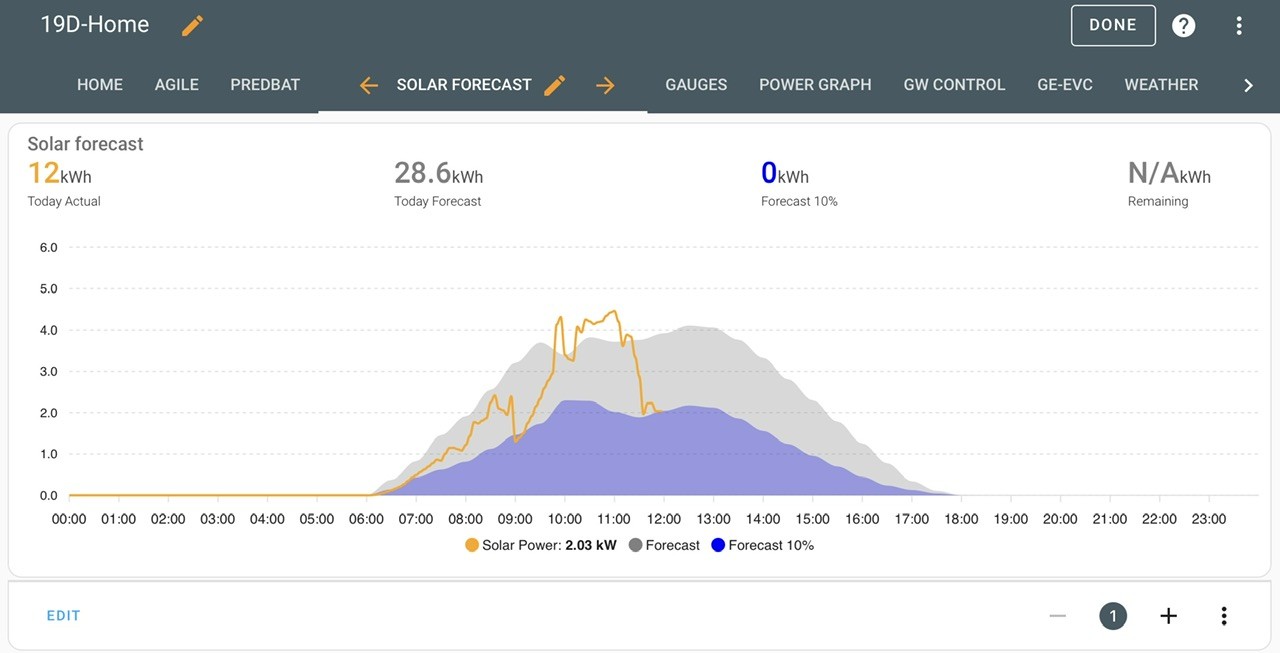
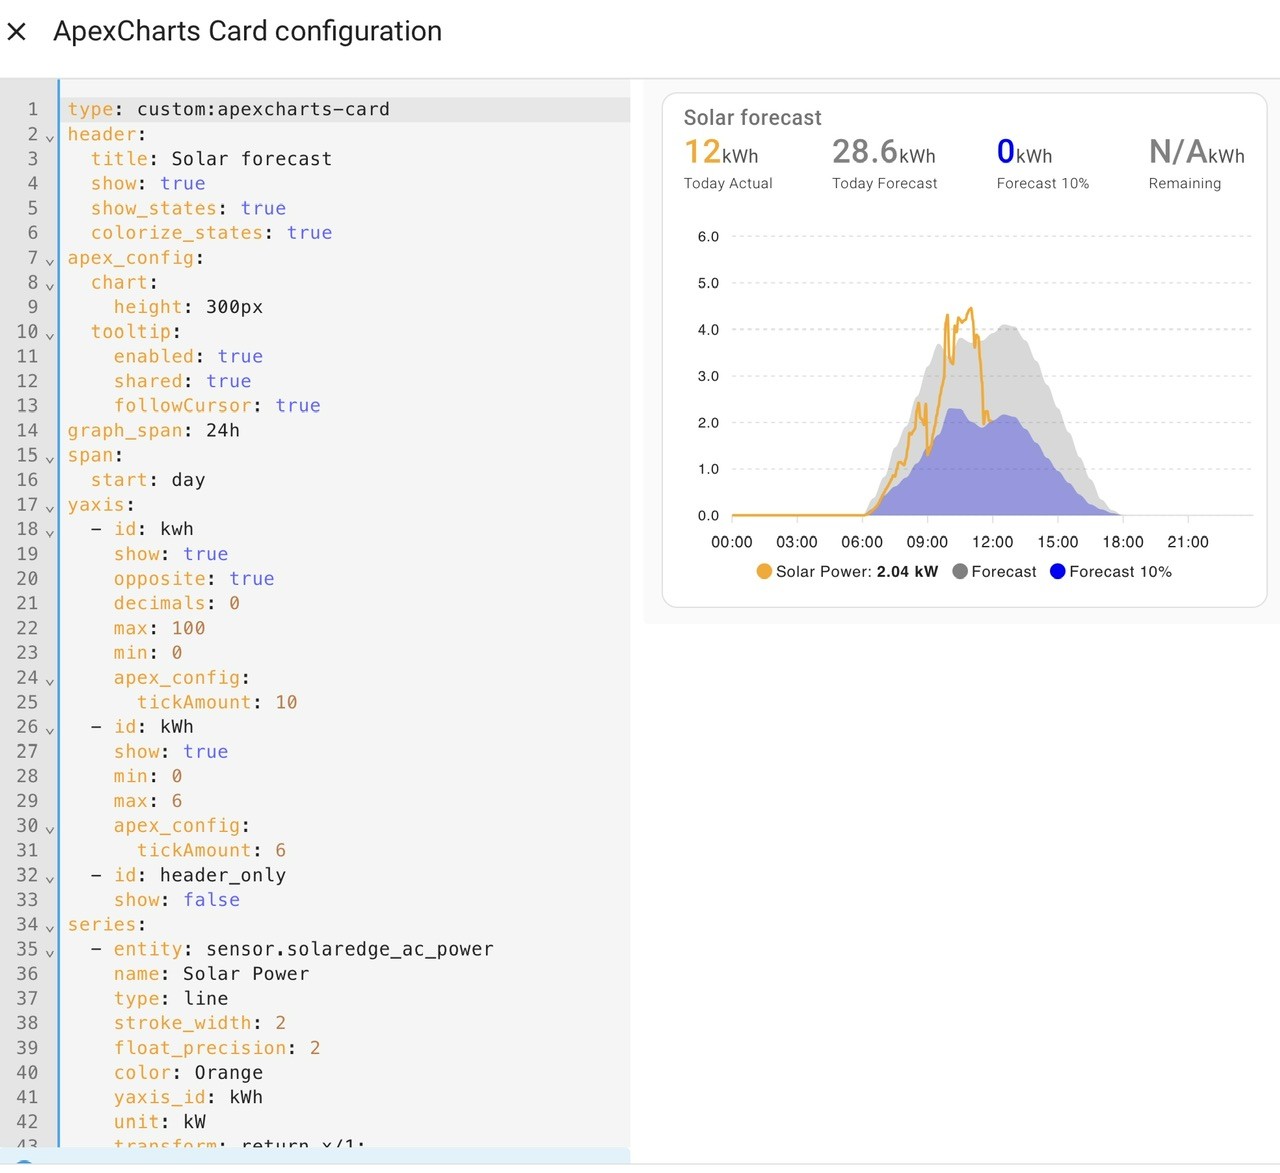
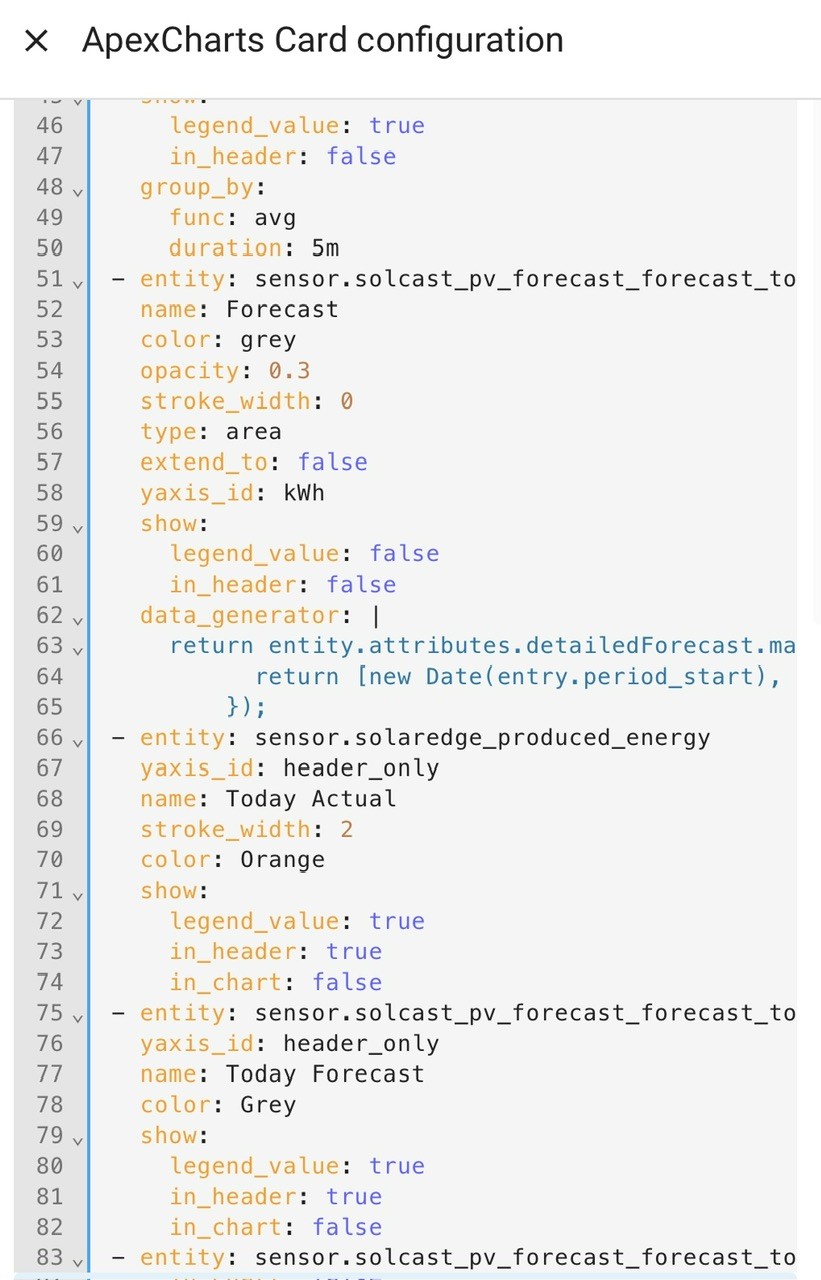
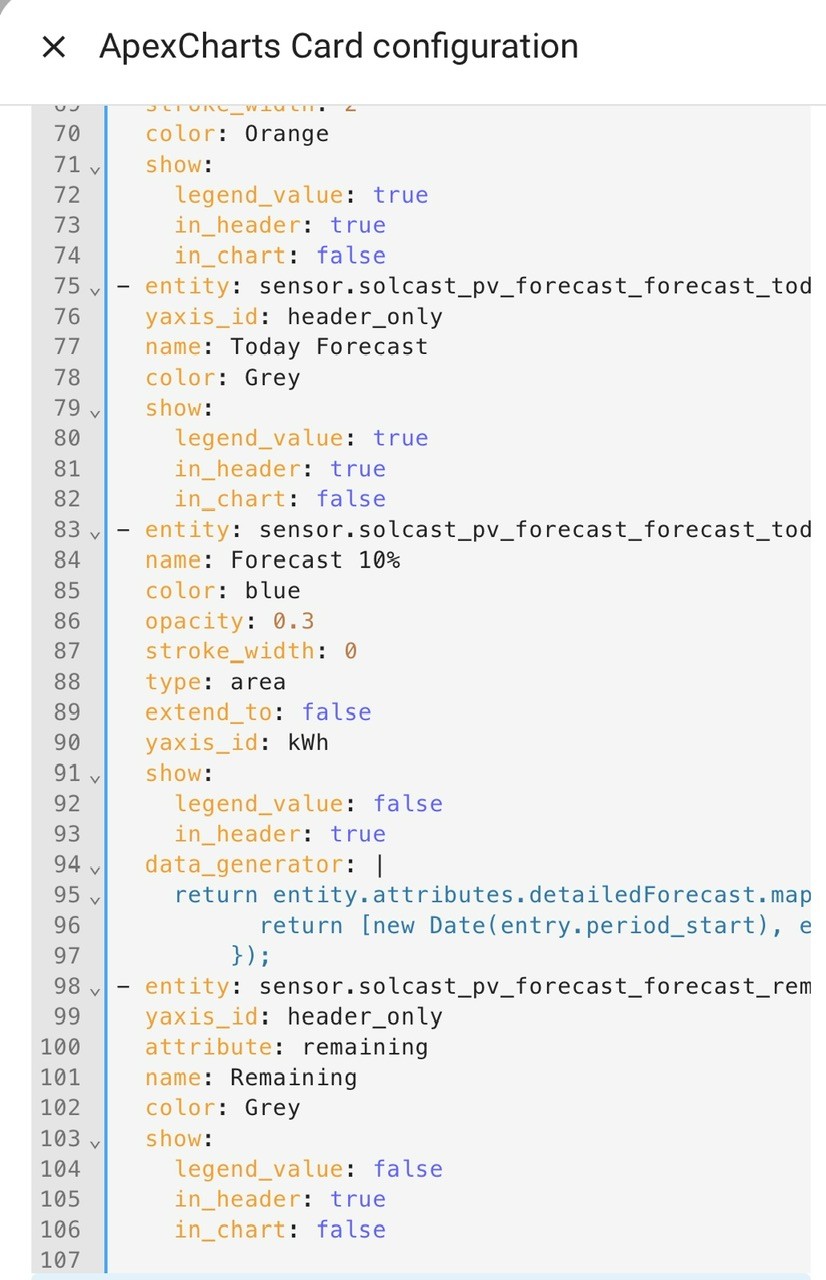
Daveb01 the dark side is down
You may have seen the discussion I have posted on the broken dark side!
Coincidentally, I have been working on my solar forecast charts this morning so this should be fresh in my mind. It is awkward having to deal with Solaredge and Solaredge modbus integrating to pick up the correct entities.
My brain needs some sustenance but meanwhile, this is my yaml for my latest forecast card:
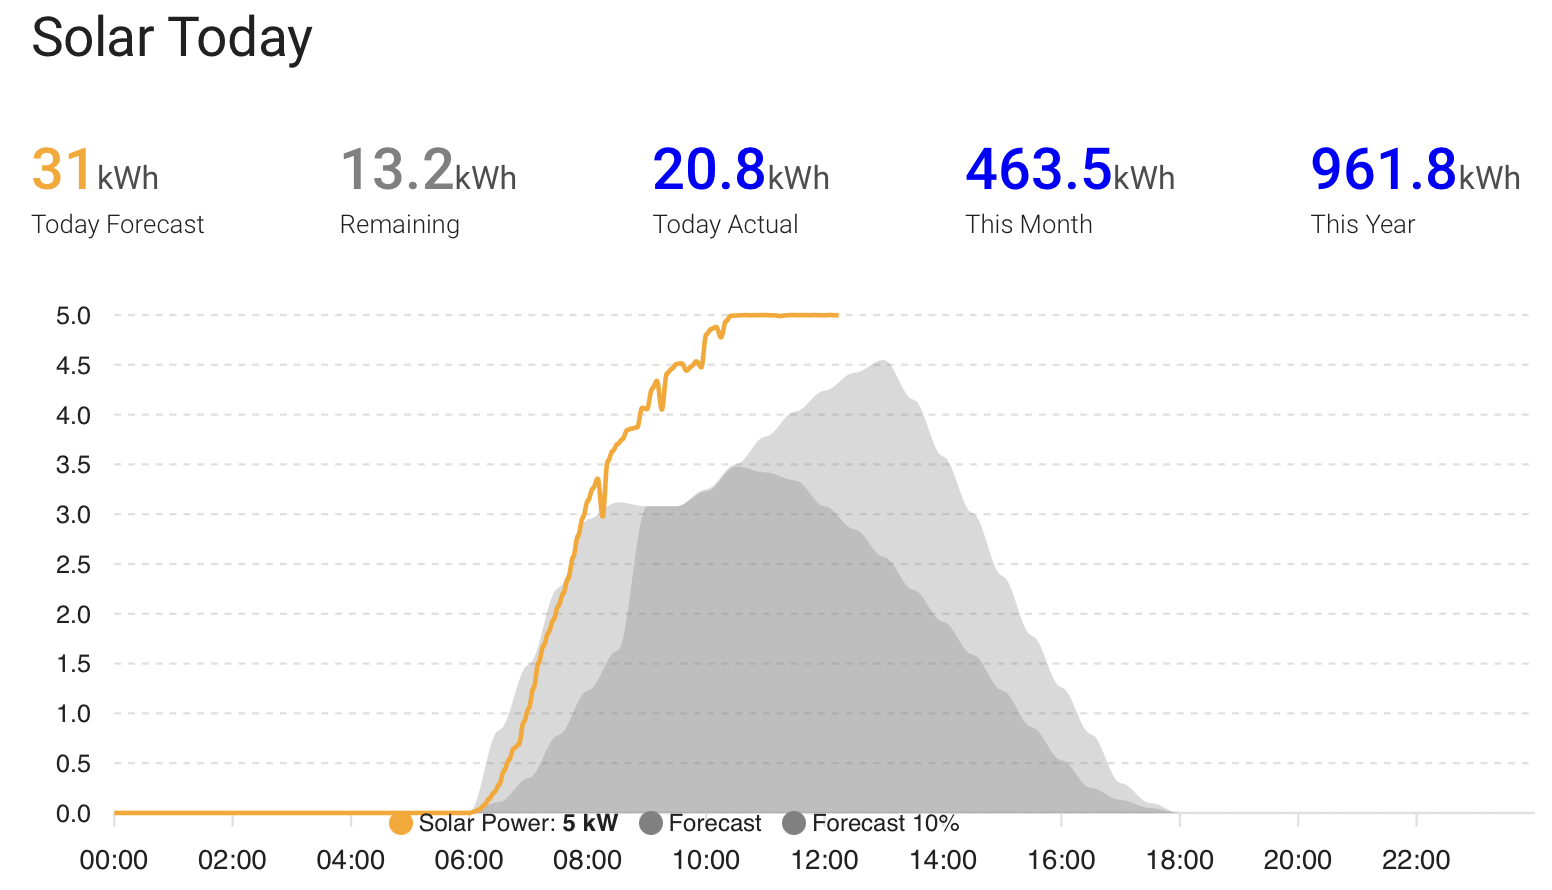
square: false

type: grid

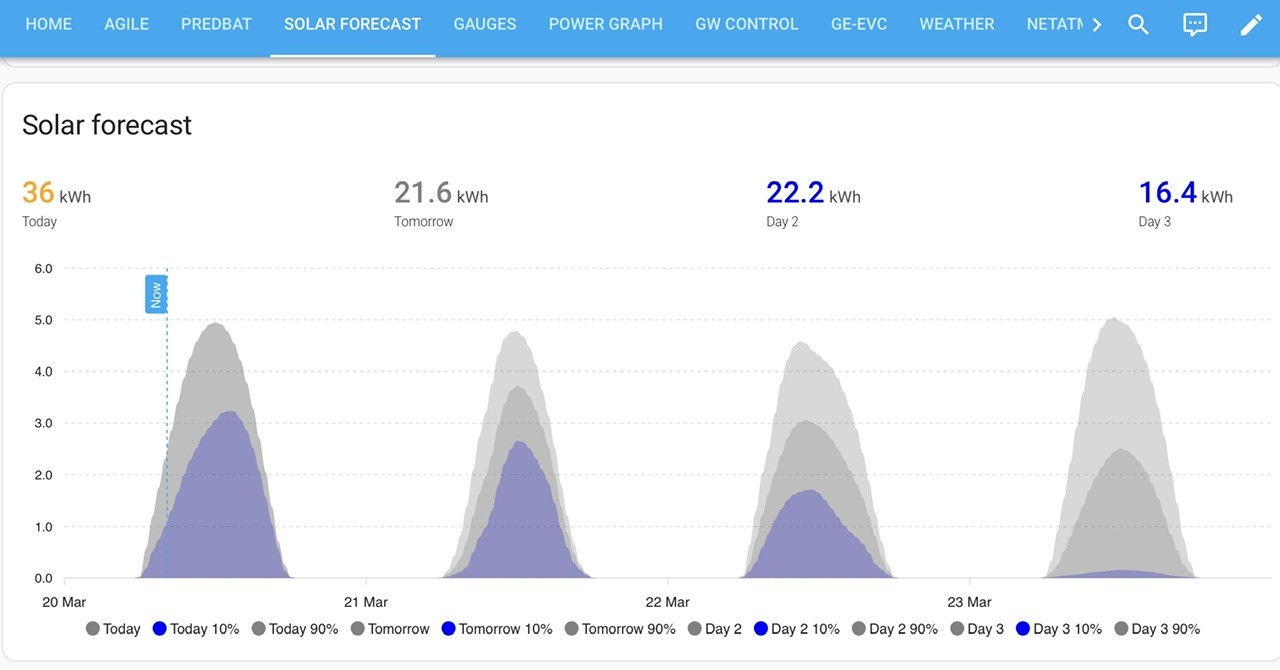
cards:

  - type: custom:apexcharts-card

    header:

      title: Solar Today

      show: true

      standard_format: true

      show_states: true

      colorize_states: true

    apex_config:

      chart:

        height: 300px

      tooltip:

        enabled: true

        shared: true

        followCursor: true

    graph_span: 24h

    span:

      start: day

    yaxis:

      - id: capacity

        show: true

        opposite: true

        decimals: 0

        max: 100

        min: 0

        apex_config:

          tickAmount: 10

      - id: kWh

        show: true

        min: 0

        apex_config:

          tickAmount: 10

      - id: header_only

        show: false

    series:

      - entity: sensor.solaredge_modbus_ac_power

        name: Solar Power

        type: line

        stroke_width: 2

        float_precision: 2

        color: Orange

        yaxis_id: kWh

        unit: kW

        transform: return x/1000;

        extend_to: now

        show:

          legend_value: true

          in_header: false

        group_by:

          func: avg

          duration: 5m

      - entity: sensor.predbat_pv_today

        name: Forecast

        color: grey

        opacity: 0.3

        stroke_width: 0

        type: area

        extend_to: false

        yaxis_id: kWh

        show:

          legend_value: false

          in_header: false

        data_generator: |

          return entity.attributes.detailedForecast.map((entry) => {

                return [new Date(entry.period_start), entry.pv_estimate];

              });

      - entity: sensor.predbat_pv_today

        name: Forecast 10%

        color: grey

        opacity: 0.3

        stroke_width: 0

        type: area

        extend_to: false

        yaxis_id: kWh

        show:

          legend_value: false

          in_header: false

        data_generator: |

          return entity.attributes.detailedForecast.map((entry) => {

                return [new Date(entry.period_start), entry.pv_estimate10];

              });

      - entity: sensor.predbat_pv_today

        yaxis_id: header_only

        name: Today Forecast

        color: Orange

        show:

          legend_value: true

          in_header: true

          in_chart: false

      - entity: sensor.predbat_pv_today

        yaxis_id: header_only

        attribute: remaining

        name: Remaining

        color: Grey

        show:

          legend_value: true

          in_header: true

          in_chart: false

      - entity: sensor.solaredge_energy_today

        yaxis_id: header_only

        name: Today Actual

        unit: kWh

        stroke_width: 2

        color: Blue

        show:

          legend_value: true

          in_header: true

          in_chart: false

      - entity: sensor.solaredge_energy_this_month

        yaxis_id: header_only

        name: This Month

        unit: kWh

        transform: return x/1000;

        color: Blue

        show:

          legend_value: true

          in_header: true

          in_chart: false

      - entity: sensor.solaredge_energy_this_year

        yaxis_id: header_only

        name: This Year

        unit: kWh

        transform: return x/1000;

        color: Blue

        show:

          legend_value: true

          in_header: true

          in_chart: false

columns: 1
Great minds think alike 😀. So I think I have worked out the issue and not sure what @geoffreycoan has set. I have found out if I change one setting back to Predbat PV today I get the setting back, so why does it not work with solcast?
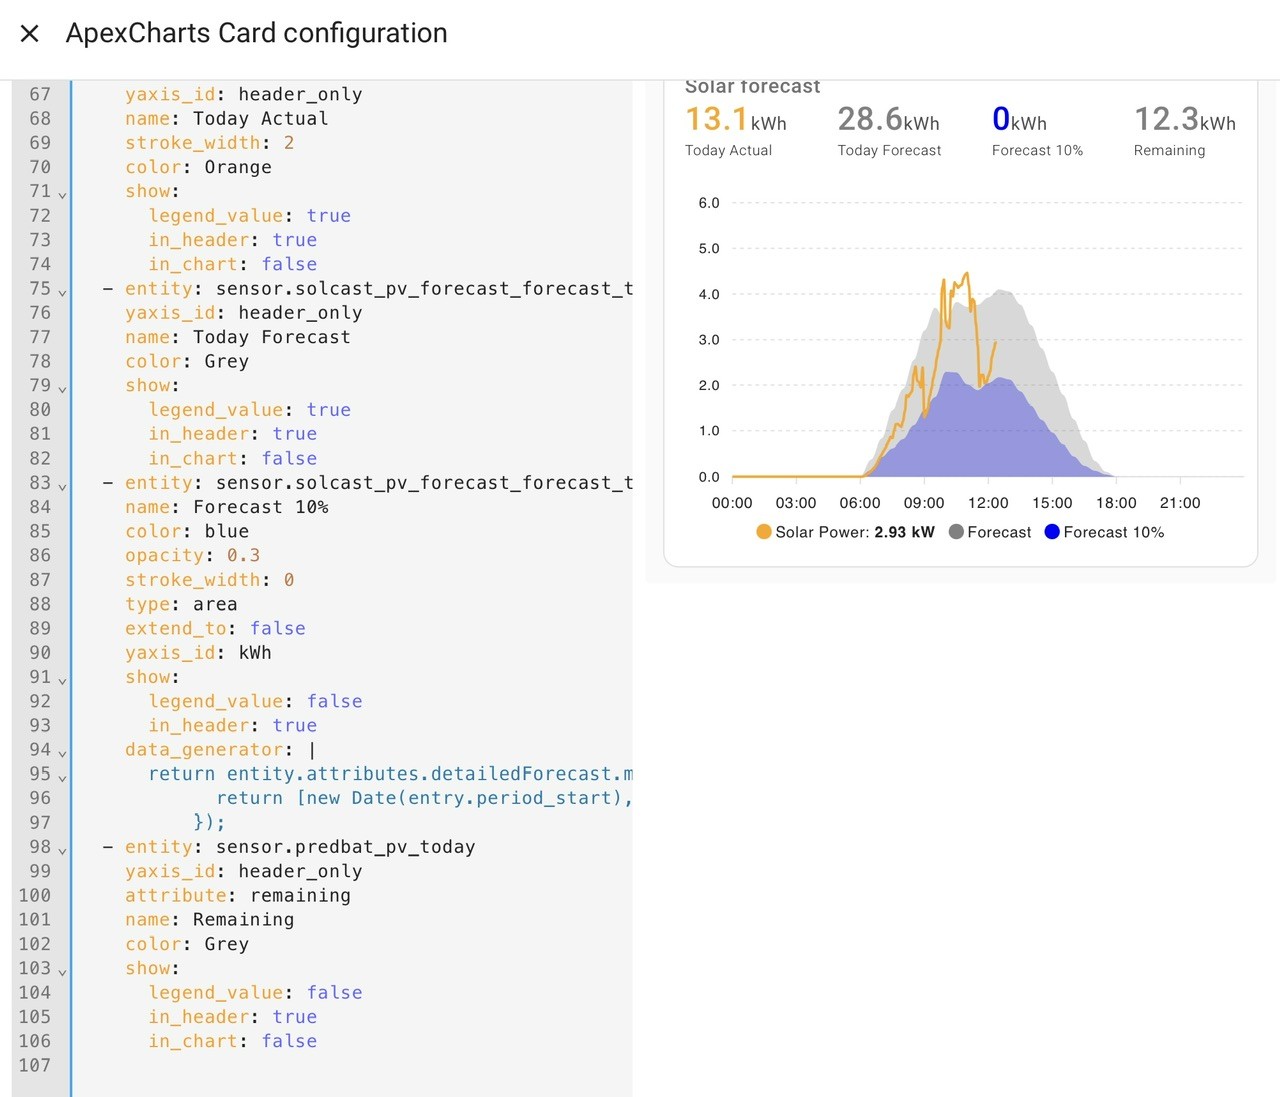
Daveb01 you can use either the solcast entities or the predbat entities.
Which you use I’d suggest depends on how you get your solcast forecast
If you use the solcast integration then its simplest if you use the solcast entities, or you can use the predbat entities but this adds an extra dependency on predbat to read the solcast data and then write to the predbat entities
If you use predbat to directly get the solcast forecast then you only have the choice of using the predbat entities as these are the only ones populated.
I use the solcast integration because the integration enables me to add the forecast to the energy dashboard which predbat doesn’t do
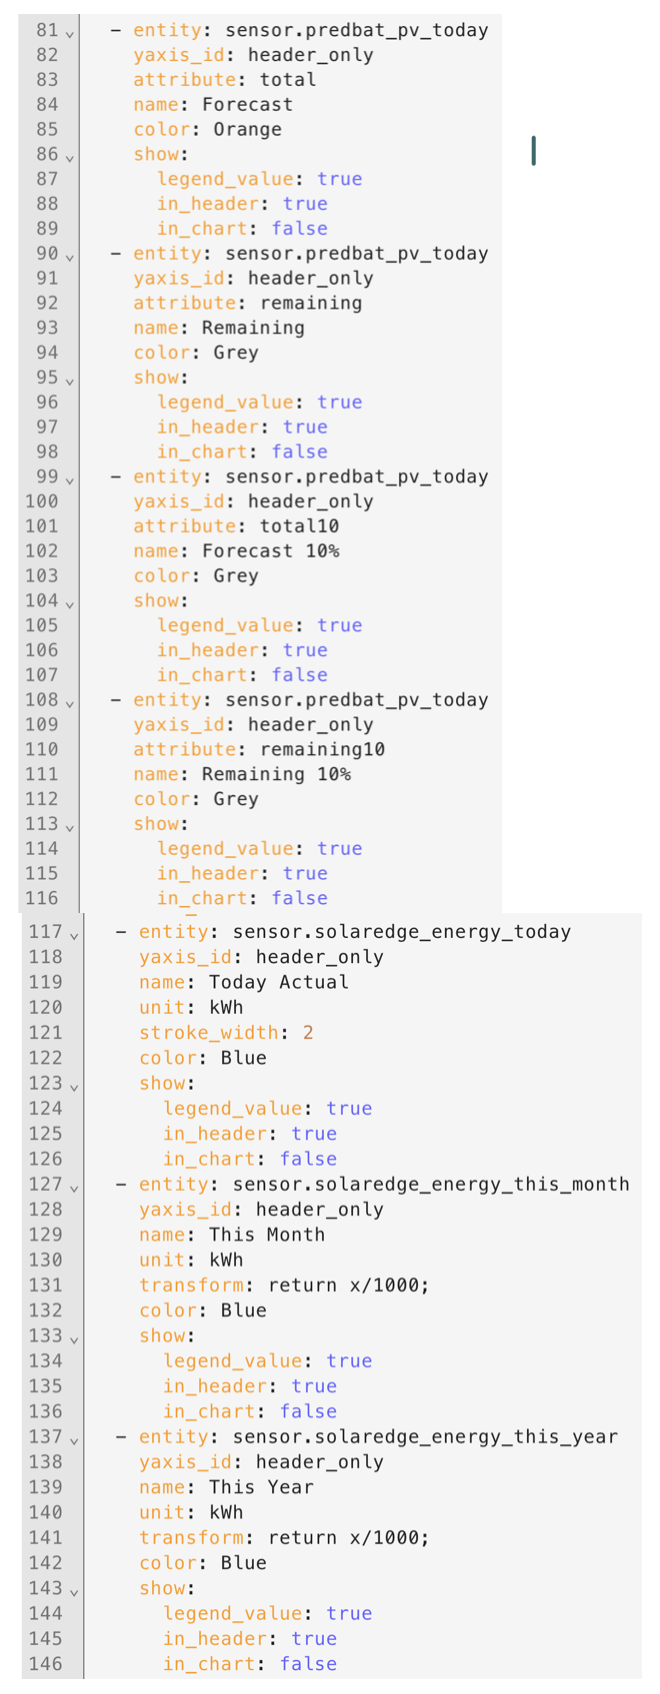
But anyway, to your question, I think your entity at row 83 looks wrong.
The Apex chart should have:
You seem to have a muddle of the two.
The PV10% in the header should be like this:
  - entity: sensor.solcast_pv_forecast_today
    attribute: estimate10
    yaxis_id: header_only
    name: Today 10% Forecast
    color: Grey
    show:
      legend_value: true
      in_header: true
      in_chart: false
You are missing getting the estimate10 attribute as well
Hi yah
It looks like you’re using Predbat as well. I was trying to move away as I have the integration like Geoffrey.
Hi yah, there seems to me multiple things going on now I have gone down the rabbit hole 🙁
I have the integration same as you
So have had a look at things and need to check I am going down the right hole please, before I either break things.
What do you have in your apps.yaml please, as I thought I had the same from day one?
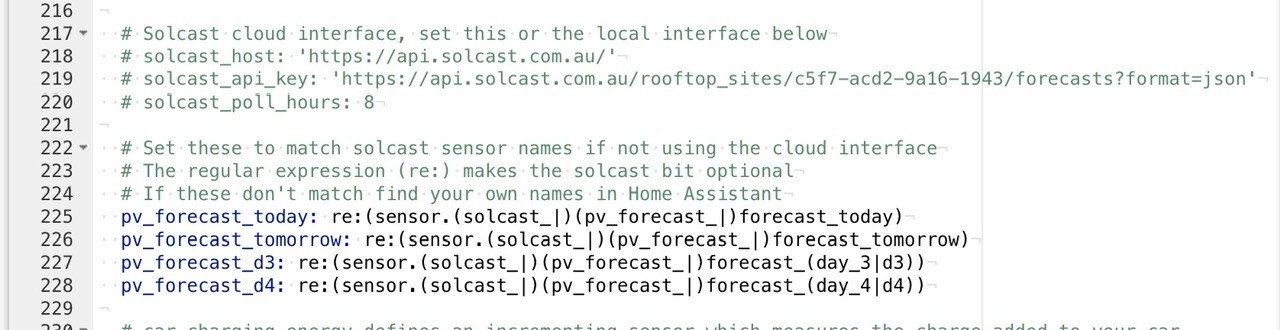
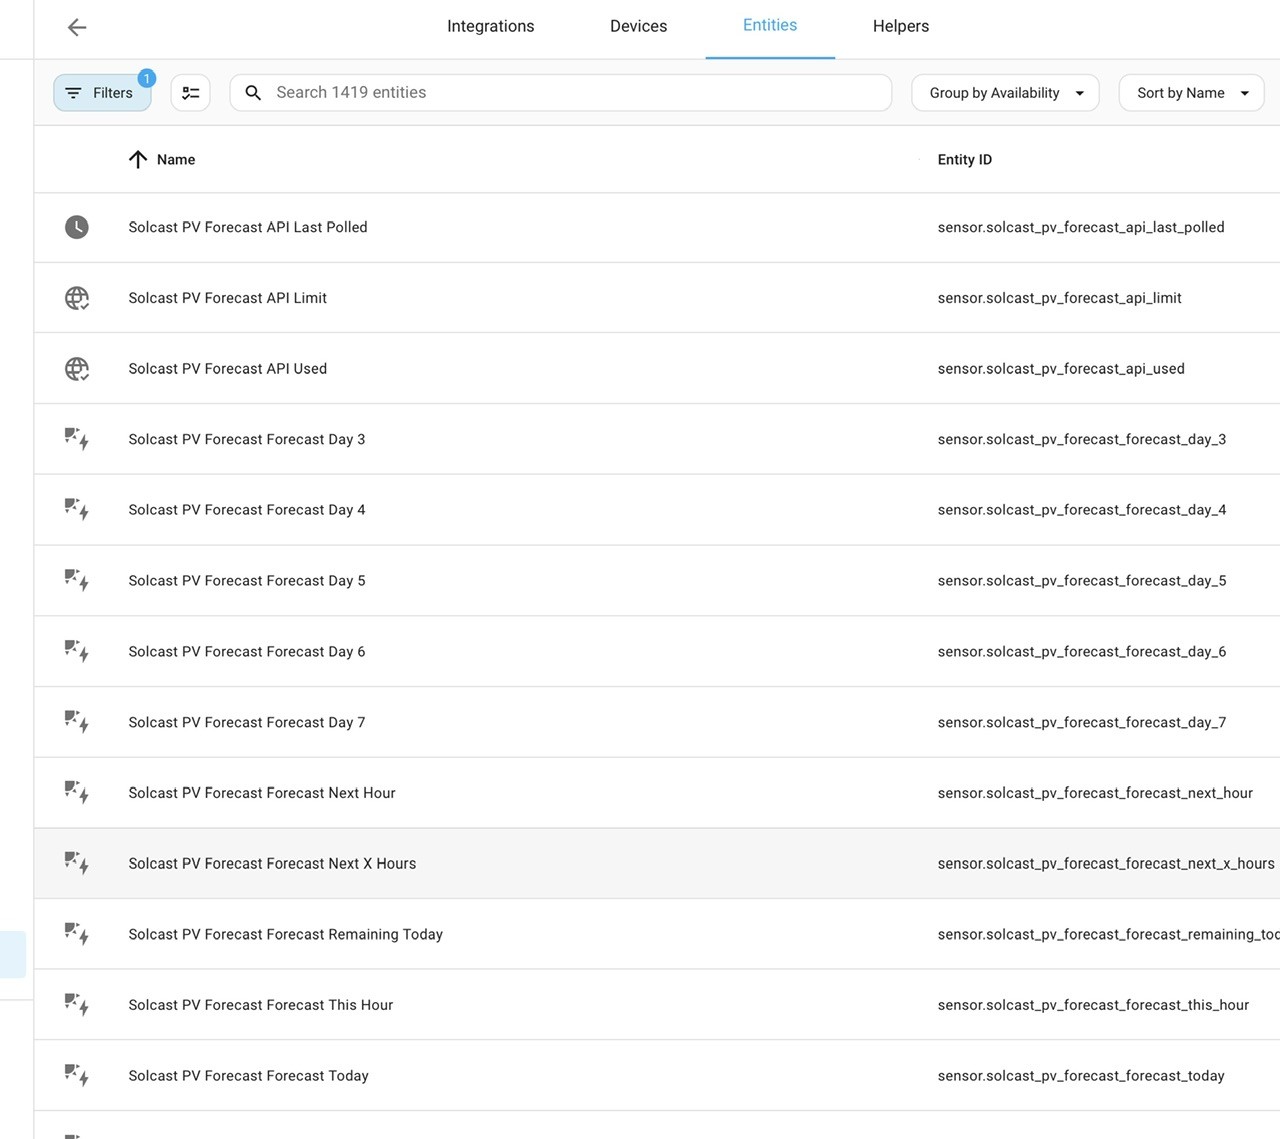
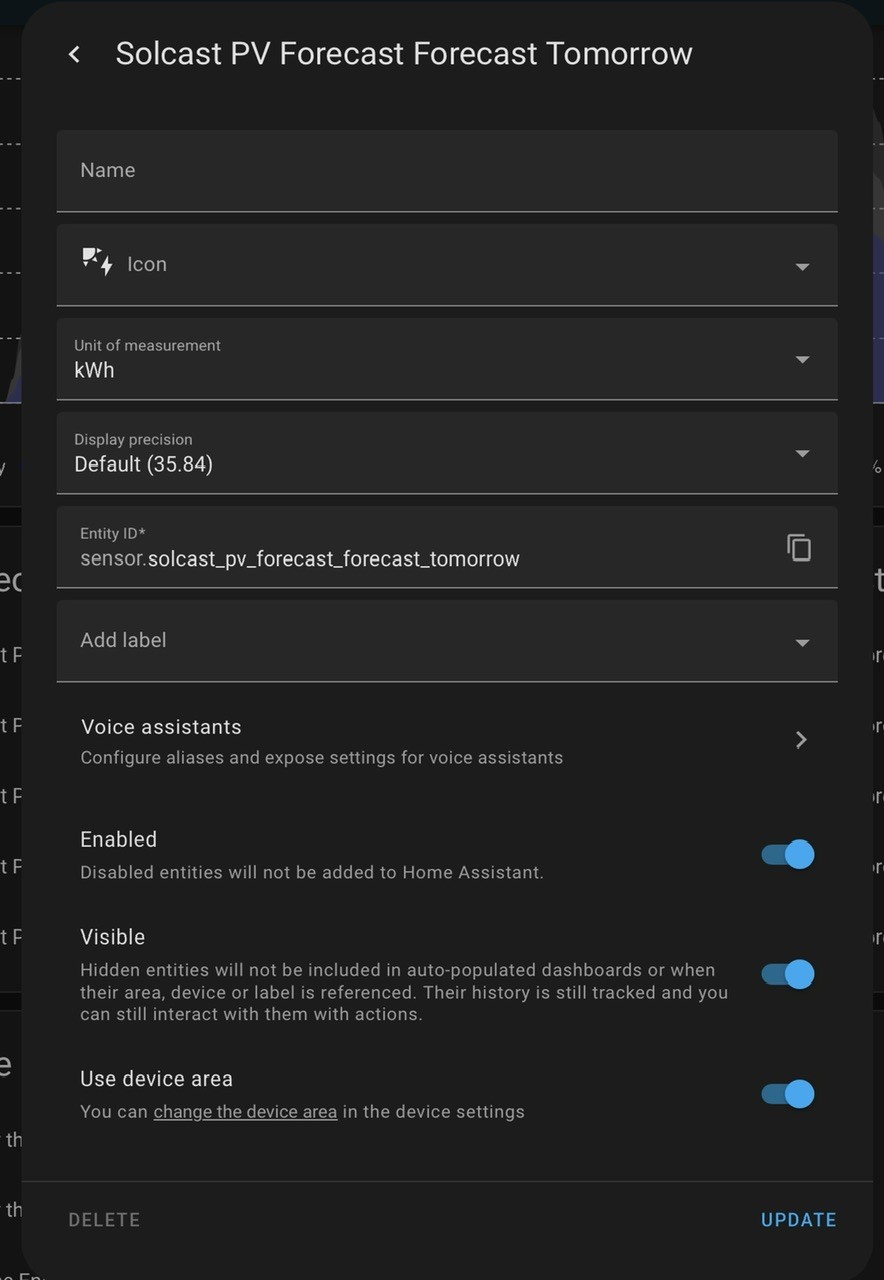
I have noticed I have on some solcast settings forecast_forcast_xxx is this correct? I don’t really want this? How do I get it back for 1 x forecast please?
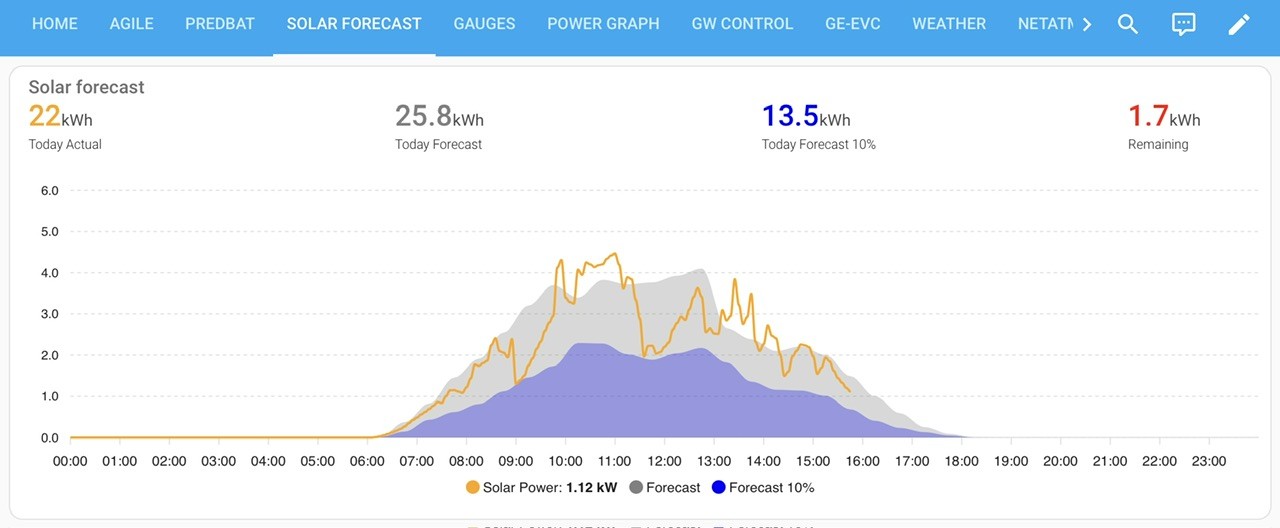
Daveb01 For the record, this is my header yaml now in the chart; also the solcast actuals for Today, Month, Year.
The forecast are from predbat linking into my Solcast api
The Actuals are from the Solaredge integration.
On my chart, the orange line is from solaredge modbus AC power entity.
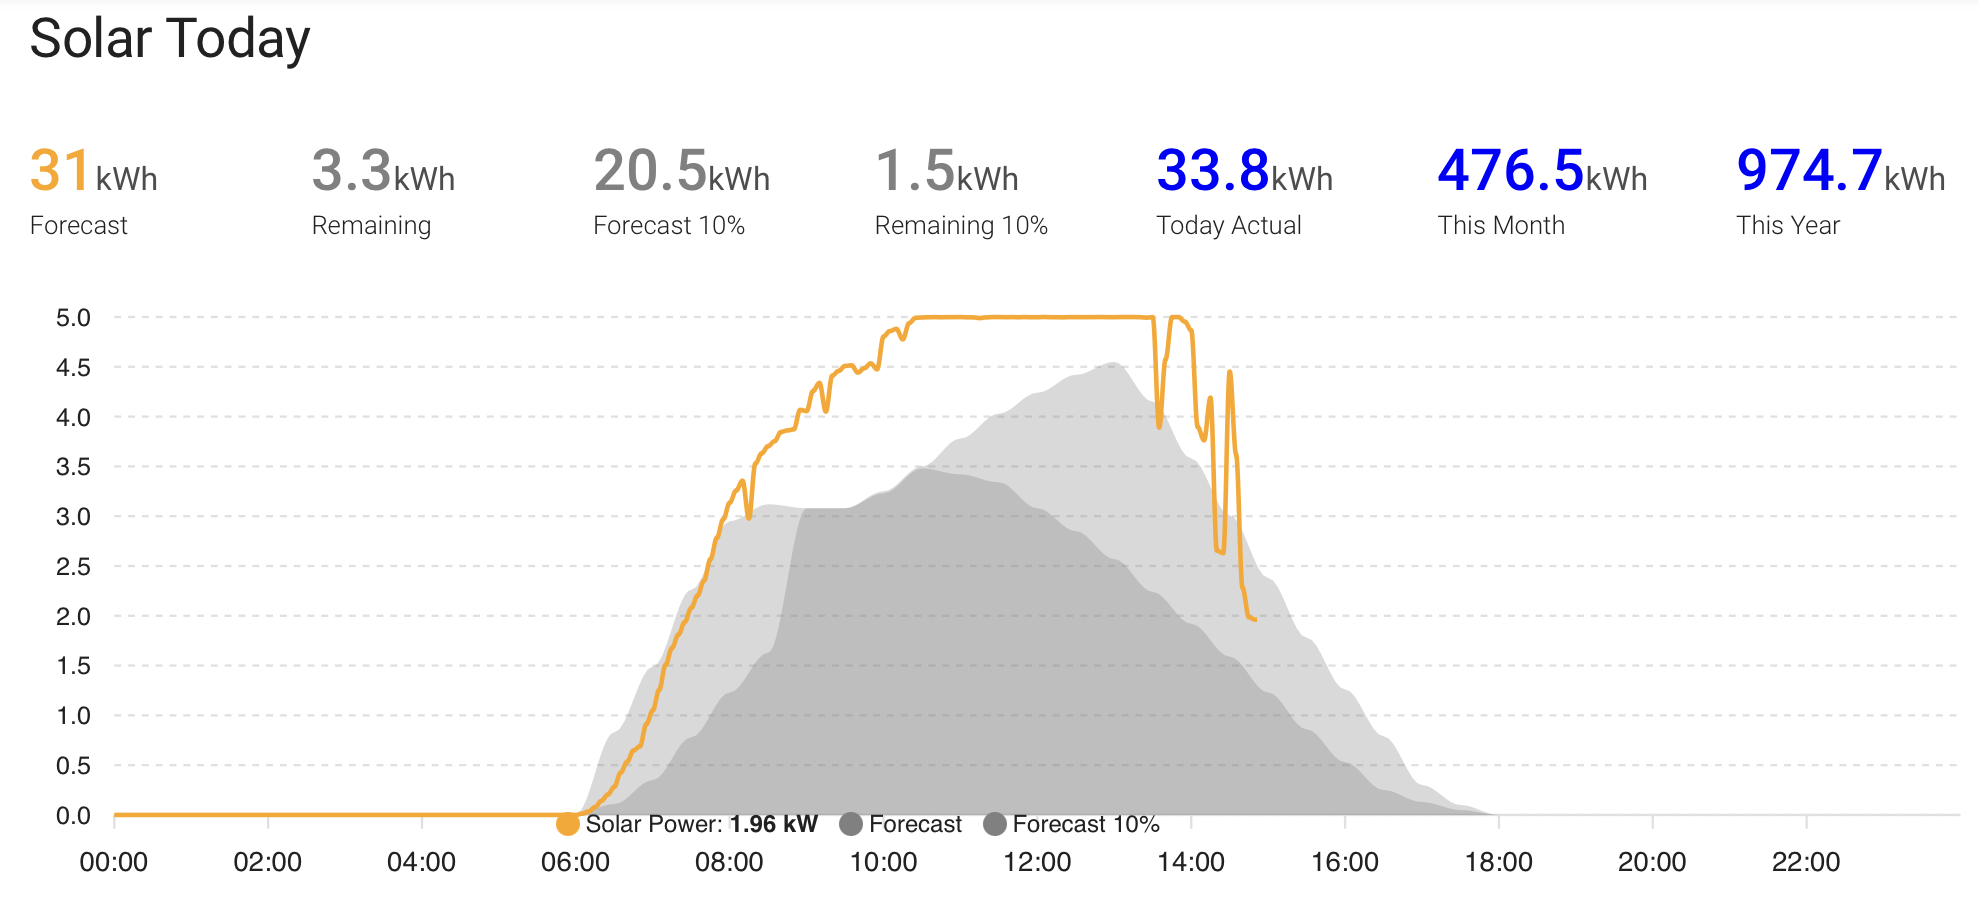
Just a bit fussy but I have everything there now Forecast, 10% and Remaining.
You are using solcast and the attributes that you missed with need to agree with those in the solcast integration, not those using the in-house predbat.
Rob
Daveb01 some solcast settings forecast_forecast_xxx is this correct?
I still have the solcast integration installed and it is up-to-date.
All my solecist entities are double named, e.g. sensor.solcast_pv_forecast_forecast_today
I looked at my solcast attributes and they are listed:
Estimate
Estimate10
Estimate90
But when added to the chart yaml, the initial capital needs to be lower case!
So Estimate needs to be estimate, etc.
It was the same for the in-house predbat method (which uses 'total' rather than 'estimate').
Compare your code with mine. As @geoffreycoan has stated, you need attribute: estimate10 adding to give your Forecast 10% header correct.
Rob
Thank you both as always. So I cheated. I RTFQ, solcast document, downloaded the yaml again, set up a new apex card. Then compared apples to apples, copied and paste any differences checked with both your versions and hay presto sorted. It did take a few hours, I am crap at coding but good at spot the difference. I made sure it was lower case as well.
Rbor All my solecist entities are double named, e.g. sensor.solcast_pv_forecast_forecast_today
HA creates entity id’s as ‘integration name_entity name’. The integration is called ‘Solcast PV Forecast’ and then individual entities are ‘Forecast today’ etc
This is why you get double ‘forecast’ in the entity id.
I didn’t like this so simply renamed the entity id’s in HA. So all of my Apex charts and my apps.yaml uses solcast_pv_forecast_today etc.
Likewise the entity names I also renamed. It doesn’t matter what you have for your entity id’s, just as long as they match in apps.yaml and the apex charts.
I looked at my solcast attributes and they are listed:
Estimate
Estimate10
Estimate90
Actually they are not named Estimate/Estimate10/Estimate90, the attributes are all in lower case.
This is another annoying feature of HA (IMHO). If you look at an entity through integrations/entities and then look at its attributes, HA pretty-formats the attributes to make them look more readable. Chief in this is capitalising them but this is for display purposes only. If you use developer tools/states and look at the entity and its attributes there you can see the actual attribute id’s which are entirely in lower case
But when added to the chart yaml, the initial capital needs to be lower case!
So Estimate needs to be estimate, etc.
As above
Daveb01 Well done.
If I get really stuck, I often just start again which can be a lot quicker than trying to find errors in my code.
It is very confusing using solcast entities from 2 different sources and also 2 different solaredge integrations.
Do look at how I have added headers to my chart for SolarEdge info for Today, Month and Year.
I may try adding these with an entities card so that then chart is just about solar forecast.
On 'remaining', this is from 'Today forecast'
There is also a 'remaining 10%'. Look in the attributes in the current day solcast entity.
Rob
geoffreycoan This is another annoying feature of HA (IMHO).
Very much so.
When I looked at the attributes under the in-house predbat entity, I could see Total, and pv_estimate:
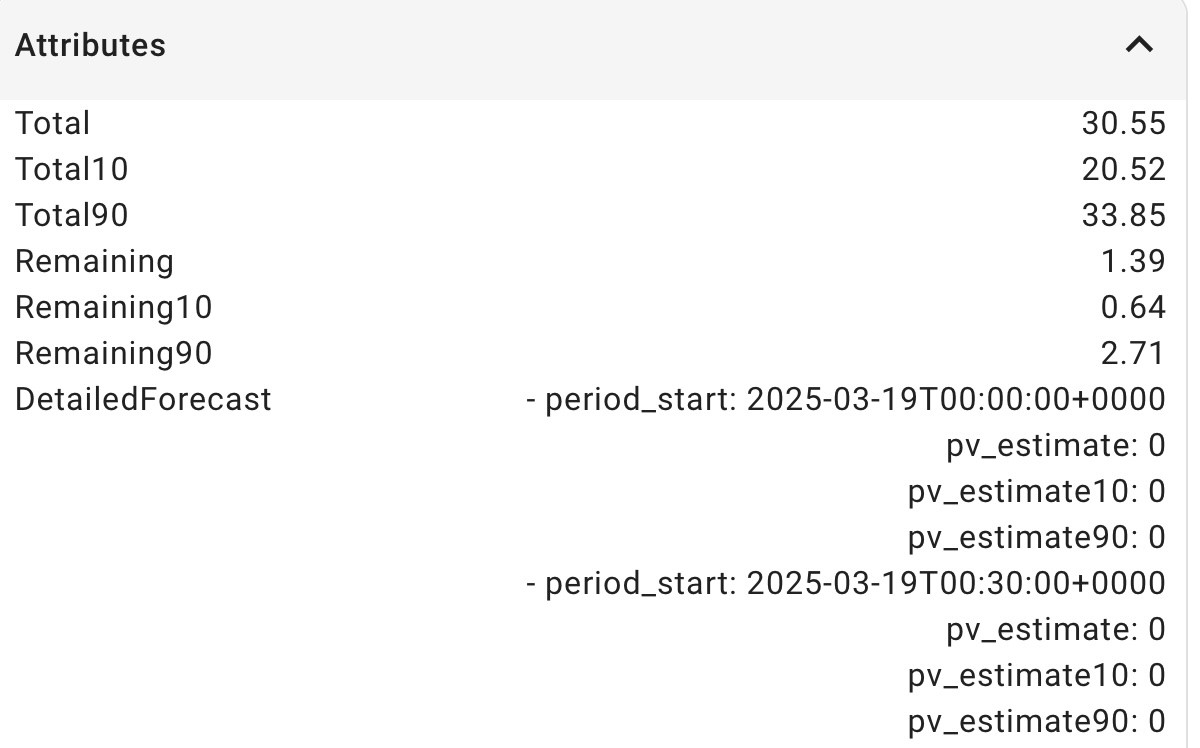
I tried both and neither worked. Then I tried 'total' and, to my surprise, that worked.
For the total or estimate attribute, this is not actually needed in the yaml code for Forecast and Remaining but you do need an attribute line in the 10% lines.
I would never have thought to diving into Developer Tools.
And sure enough the state attributes are shown there as total, total10 and total90
So why capitalise them just to make them 'pretty'! 😫😫😫
Rob
Thank you both again. I started the last one for today. My brain was in follow my leader rather than logical.
This is the one I changed to Solcast.
Could not find days 2 to replace predbat_pv_d2 or d3.
Had a cuppa and took dog out.
Day 2 is really day 3 in Solcast world
Day 3 is really day 4 in Solcast world.
Sorted 👍✅🍺
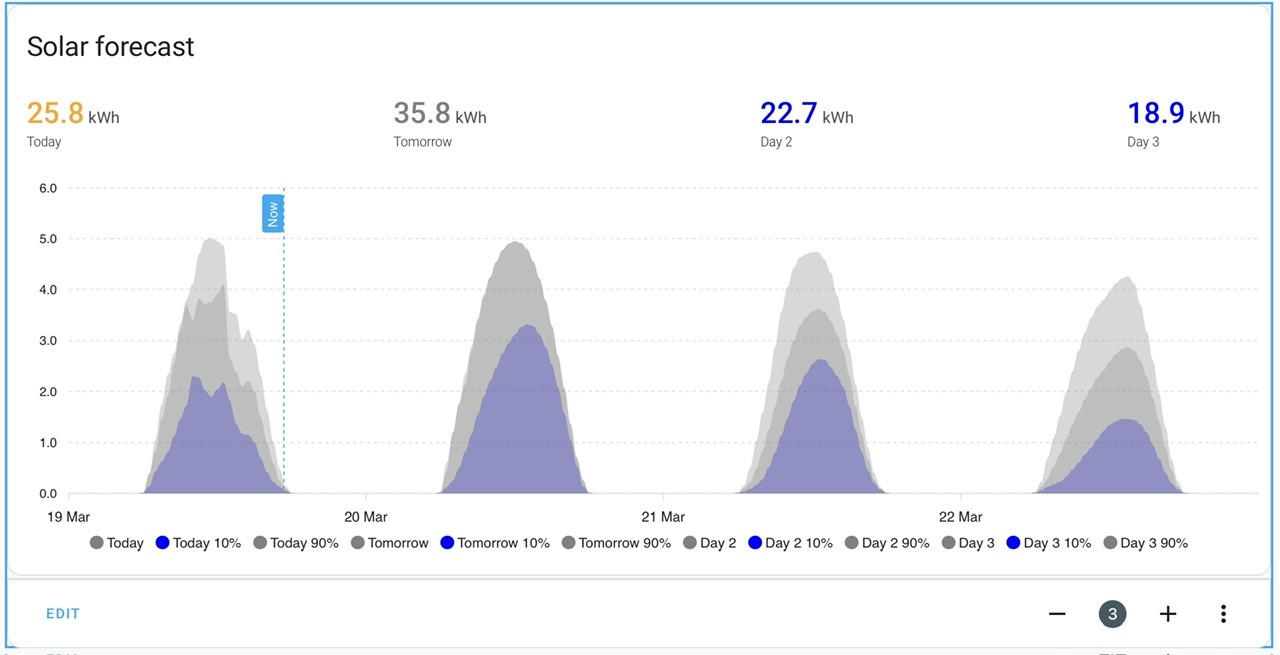
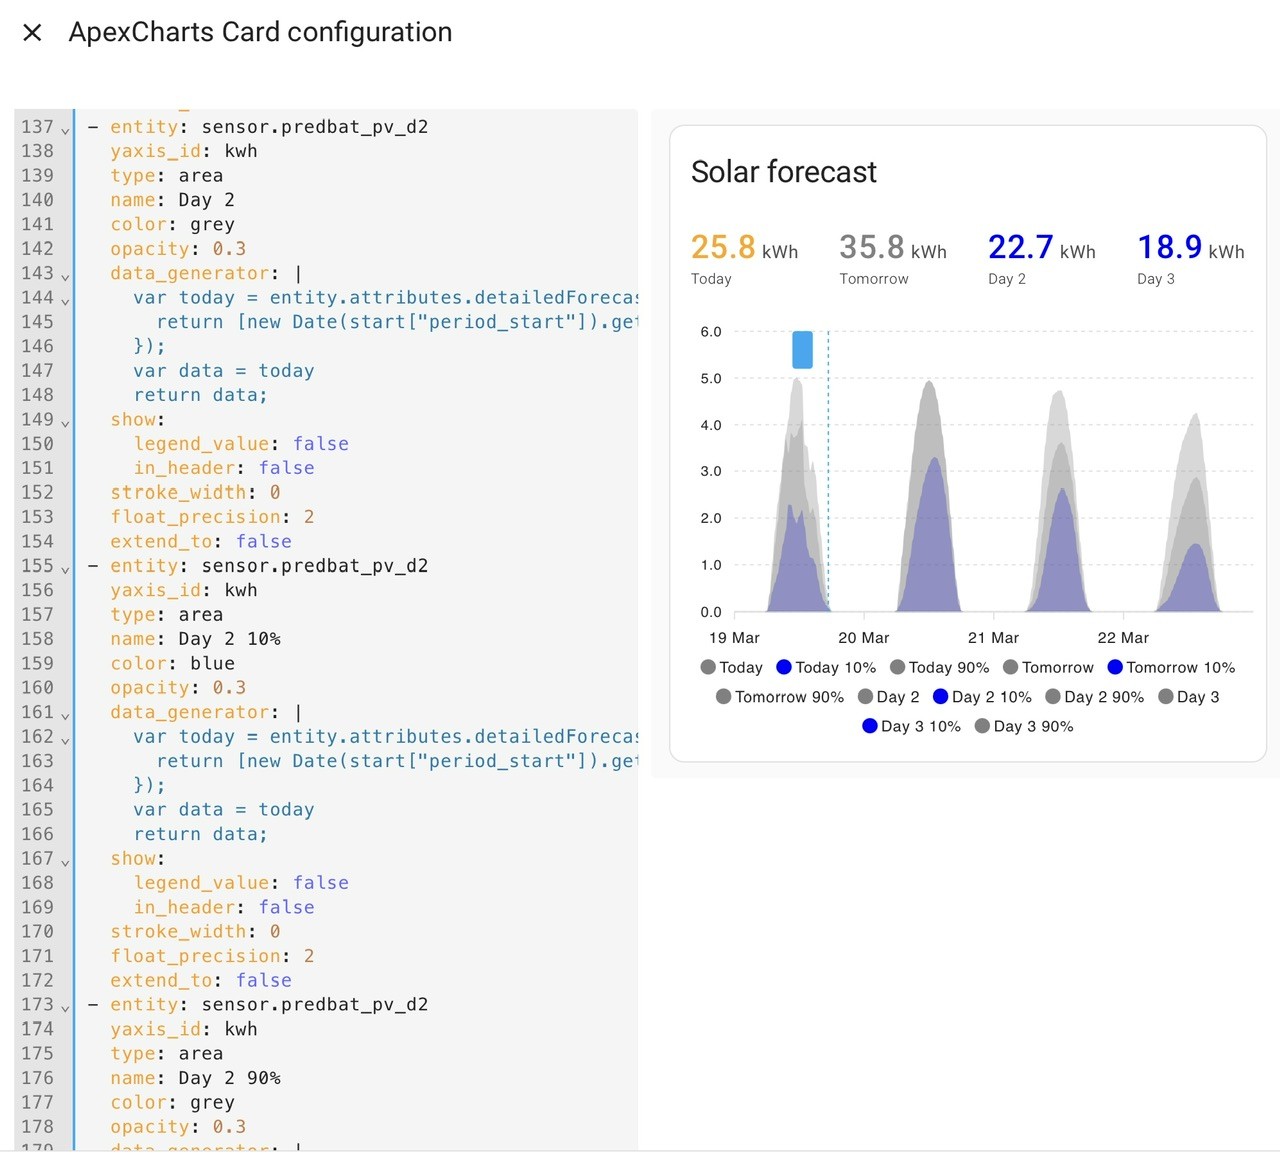
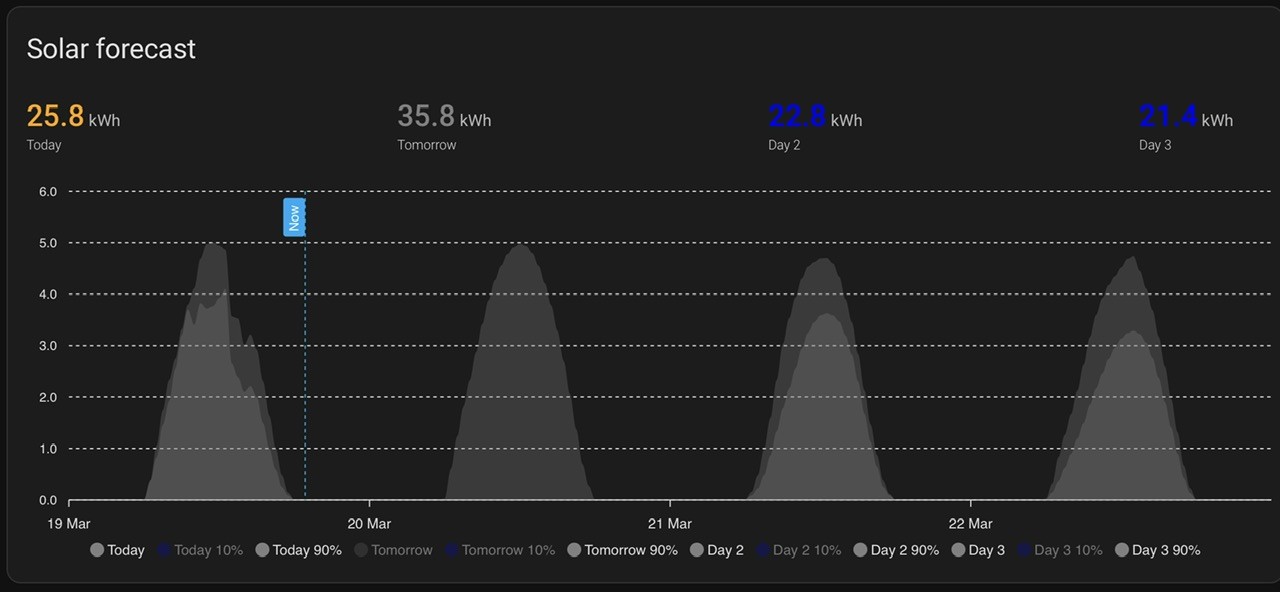
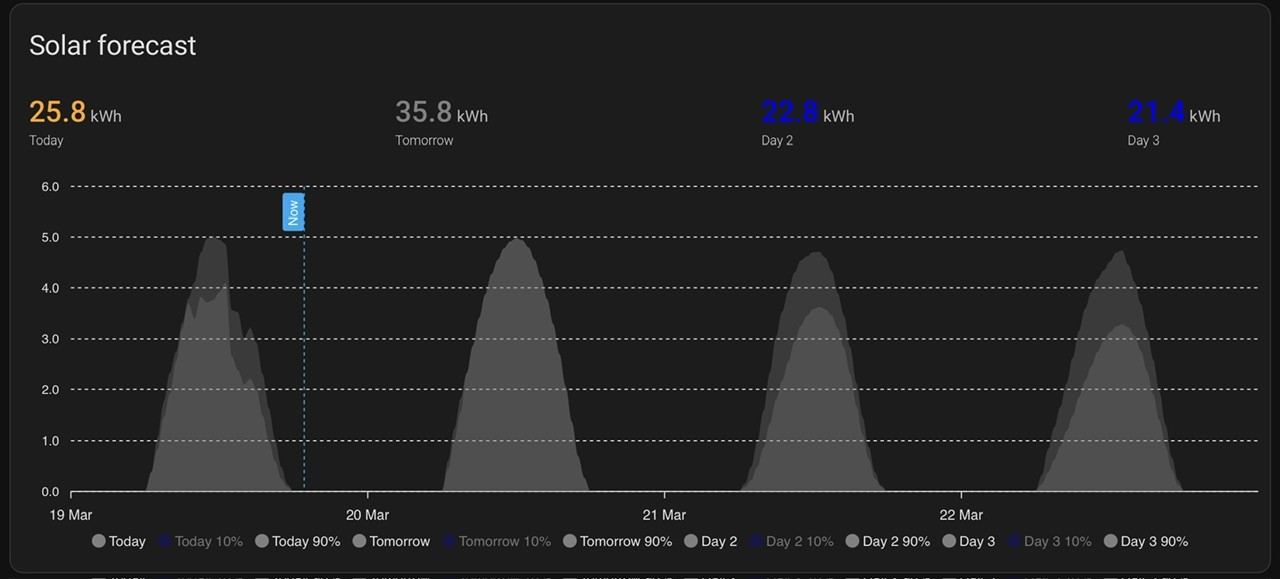
Errr NOT sorted. The yesterday chart is not the same as the others (they all have 3 charts)
It seems the Tomorrow chart is the same as the 90% charts.
I have checked every line and can not find a difference between all the other 90% charts
Any ideas on this one please?
Daveb01 Could not find days 2 to replace predbat_pv_d2 or d3.
Had a cuppa and took dog out.Day 2 is really day 3 in Solcast world
Day 3 is really day 4 in Solcast world.Sorted 👍✅🍺
…
Errr NOT sorted. The yesterday chart is not the same as the others (they all have 3 charts)
It seems the Tomorrow chart is the same as the 90% charts.
I have checked every line and can not find a difference between all the other 90% charts
RTFM
https://springfall2008.github.io/batpred/output-data/#solar-forecast-data
the Predbat sensors are _today, _tommorrow, _d2, _d3, _d4 etc. There isn’t a yesterday sensor, are you confusing it with today?
same entity names as Solcast integration (guess where Trefor got the naming convention from)
https://github.com/BJReplay/ha-solcast-solar?tab=readme-ov-file#sensors
Have to admit I don’t understand what the problem is you have Dave, each of the ‘day’ entities has a PV10 forecast (estimate10 attribute), PV50 (estimate) and PV90 (estimate90)

While we are talking PV charts ...
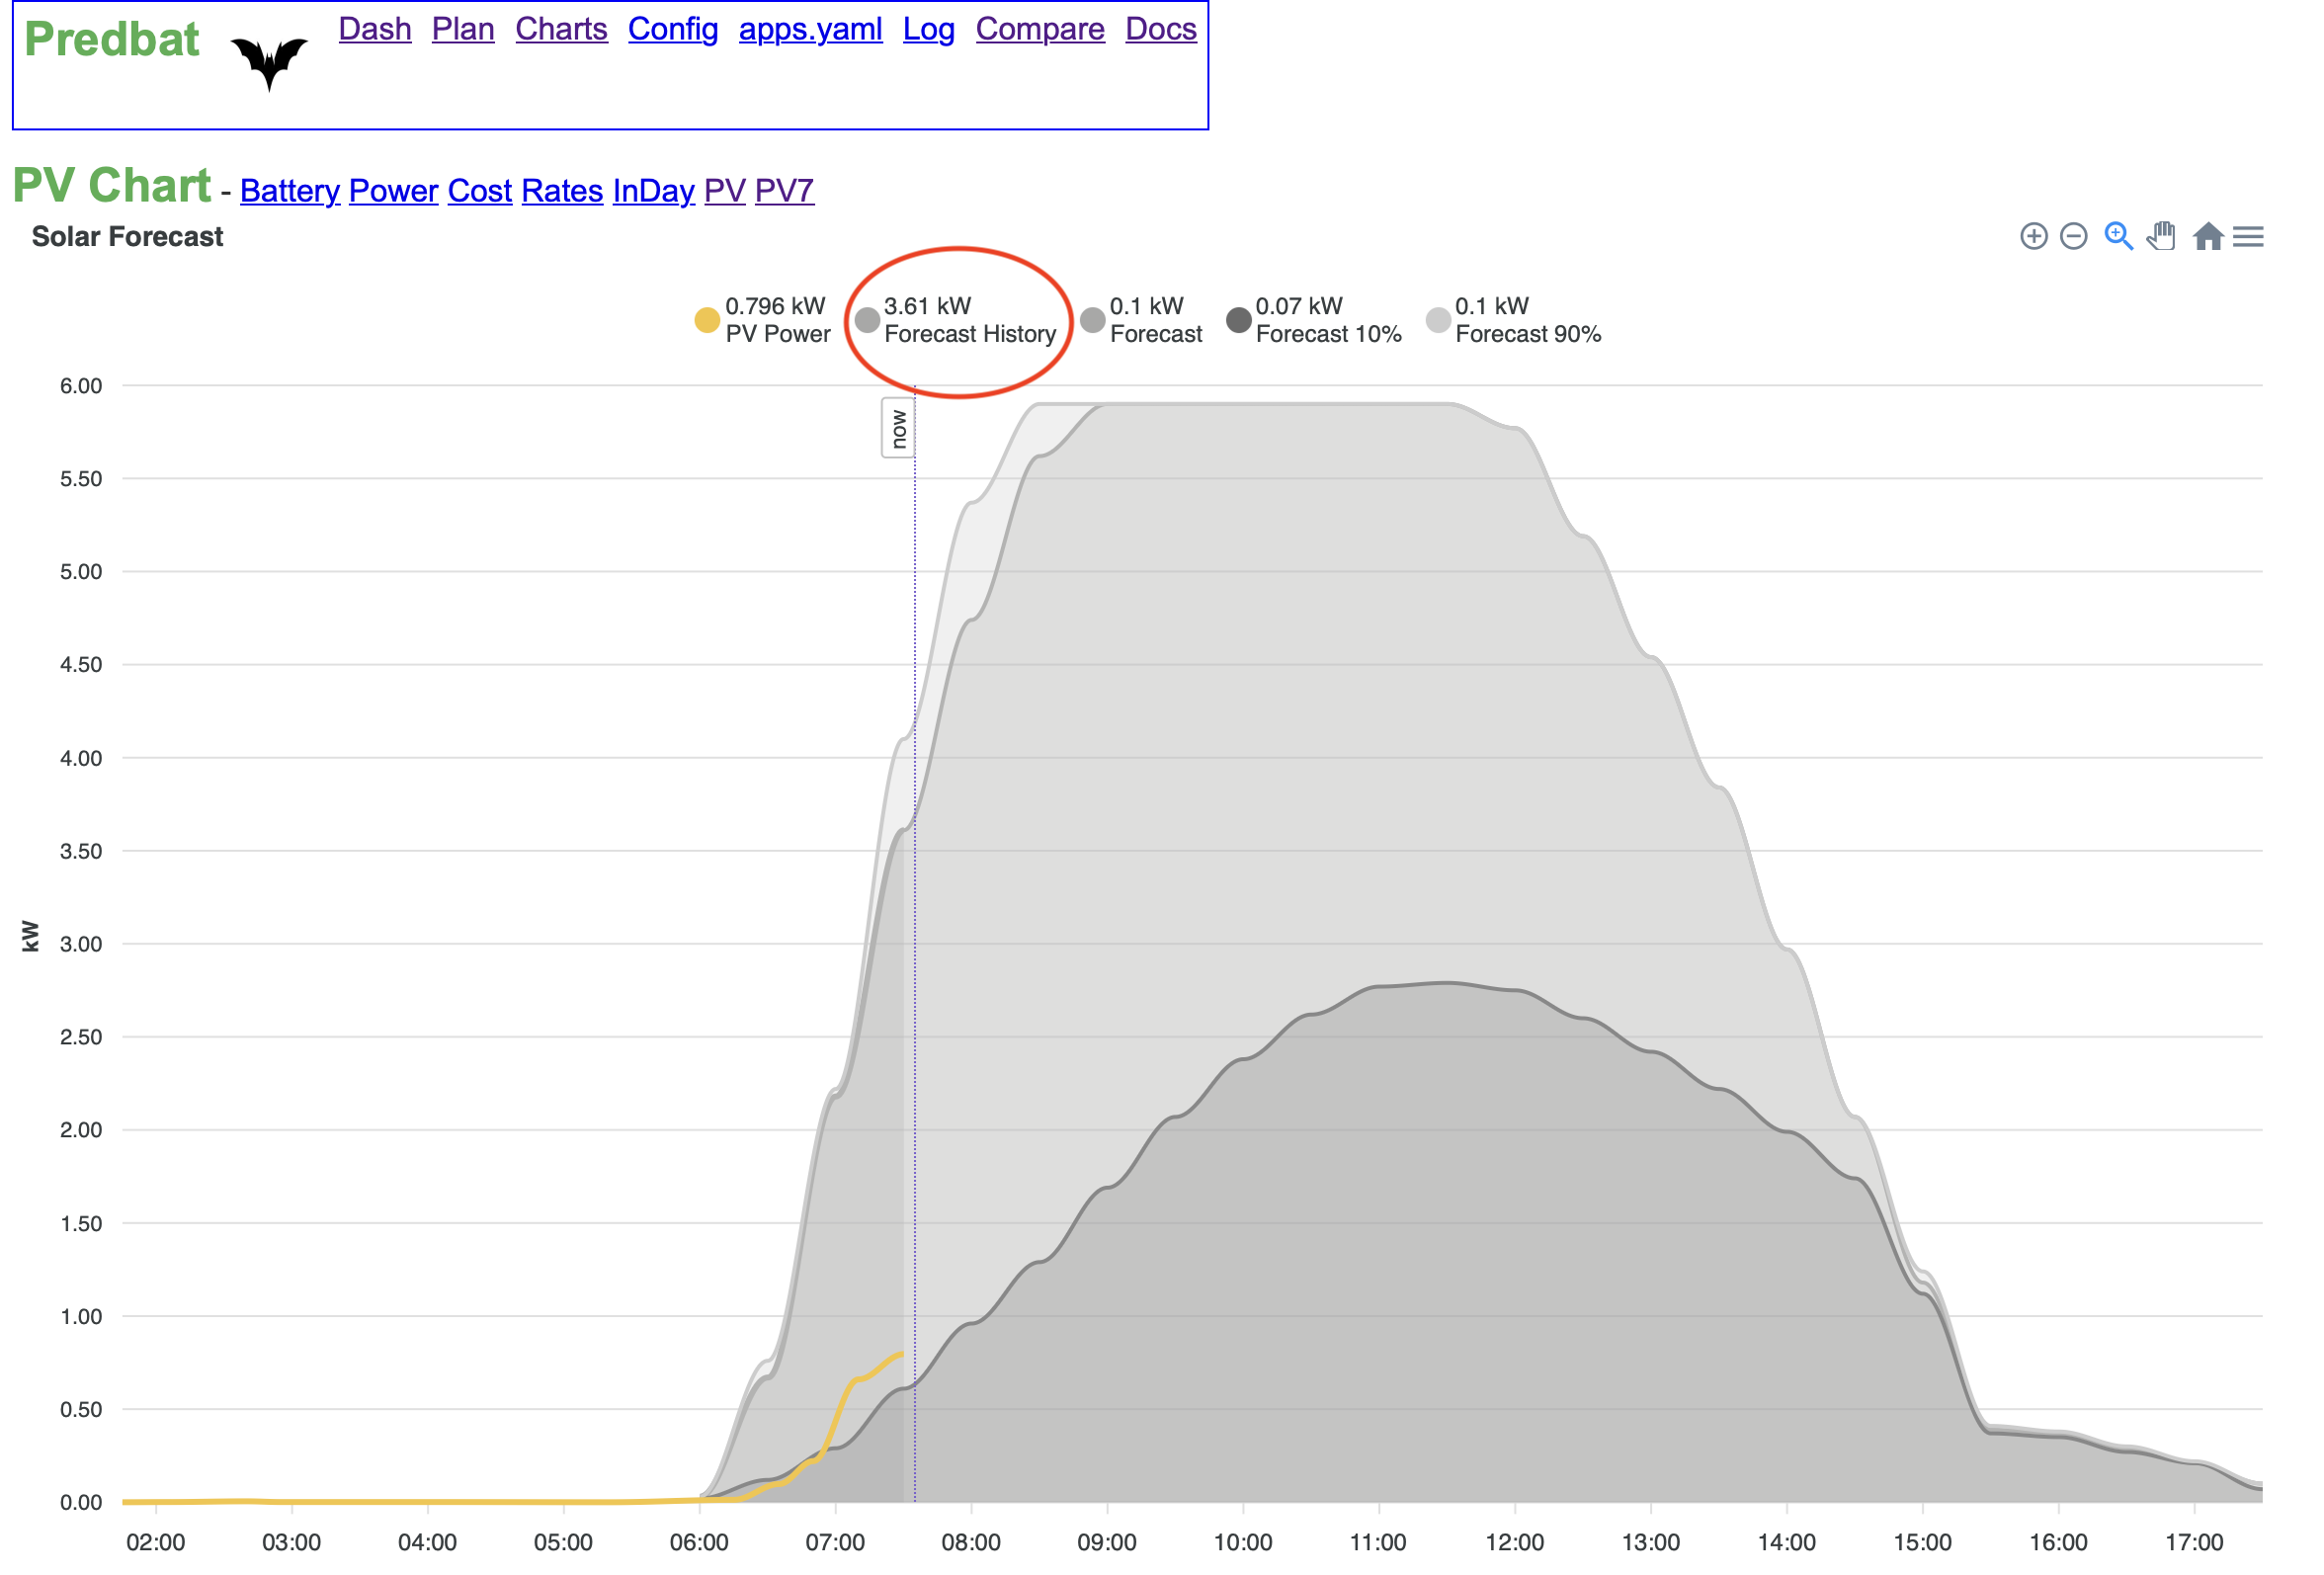
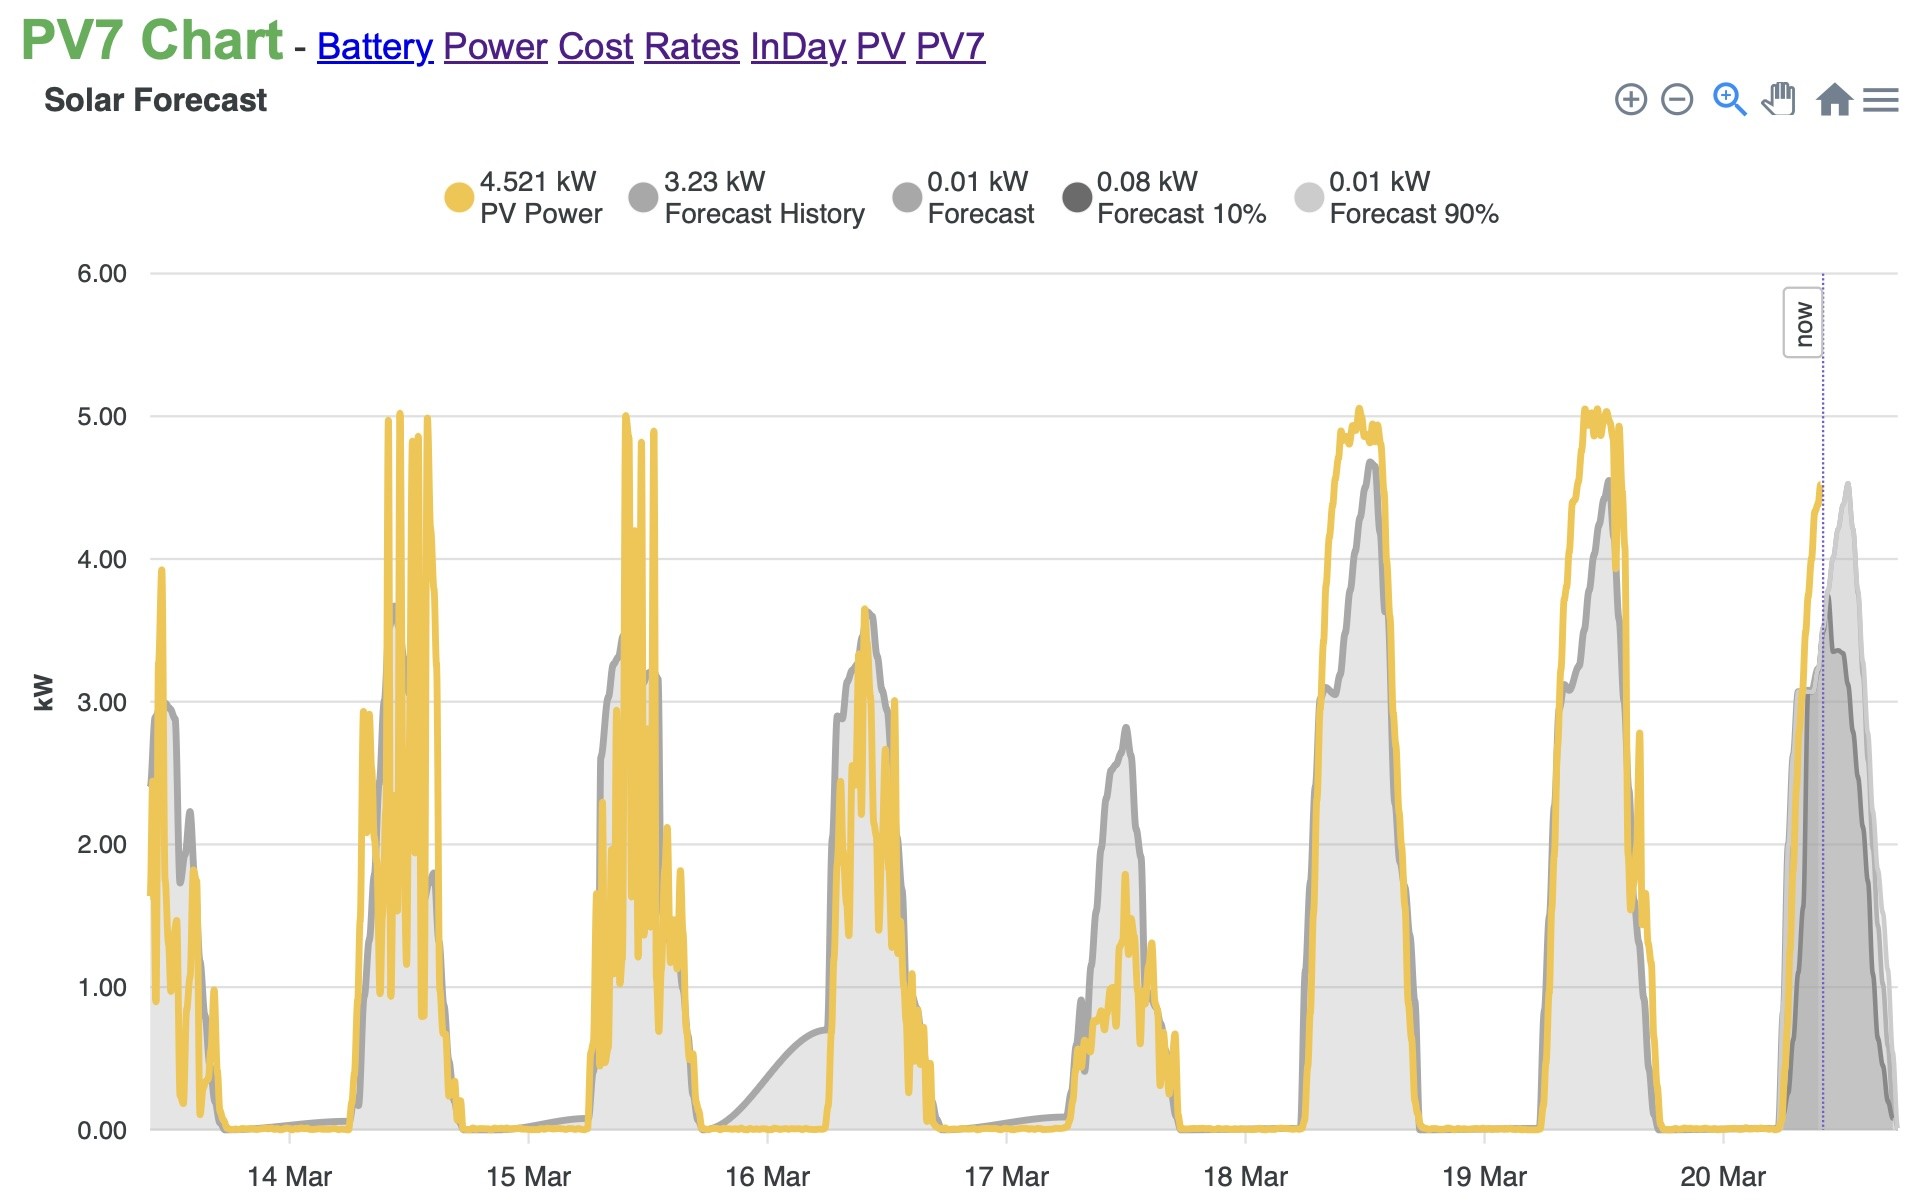
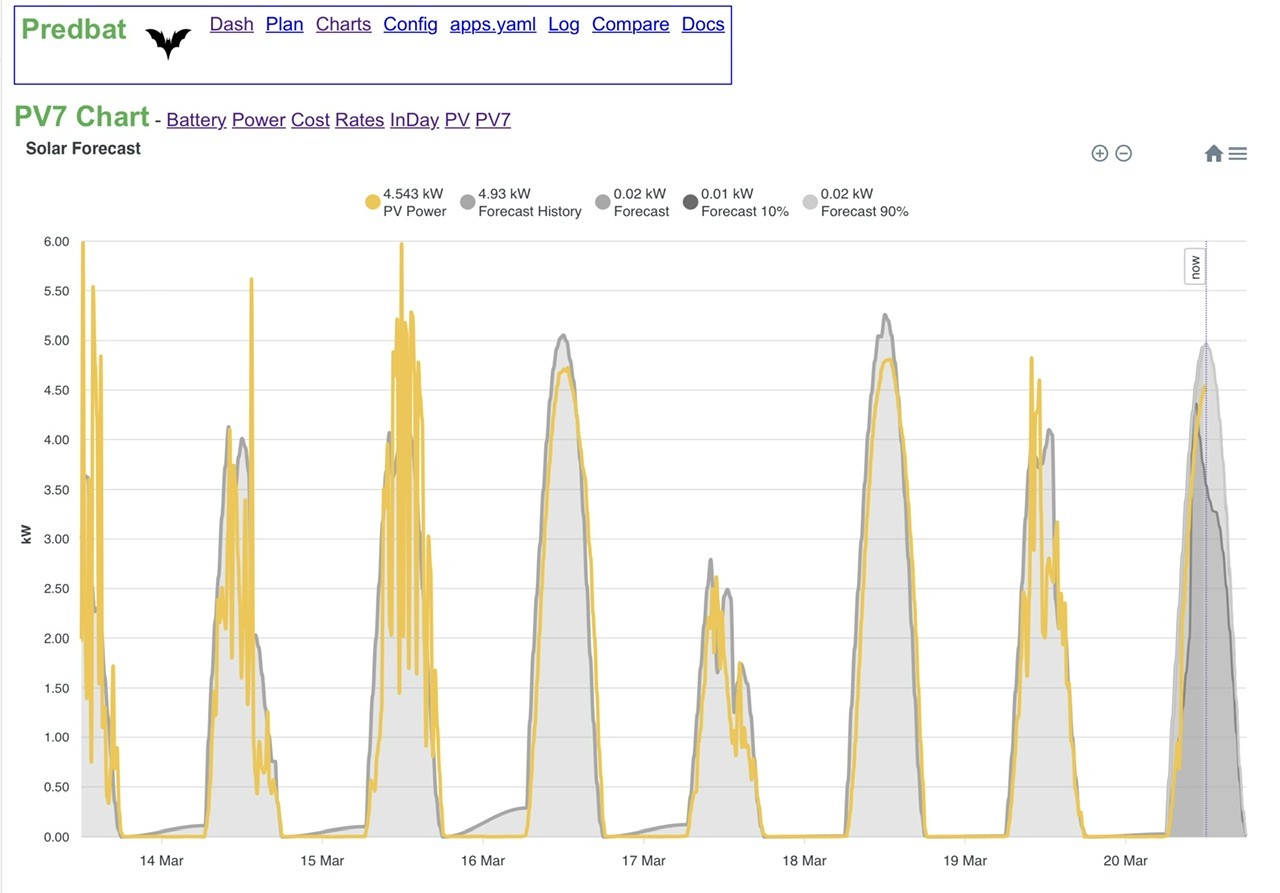
On the Predbat Chart/PV and PV7 I think I understand the Forecast, Forecast 10% and Forecast 90%. But I have never understood what Forecast History is supposed to be showing me.
Enlighten me, please!
geoffreycoan Have to admit I don’t understand what the problem is you have Dave, each of the ‘day’ entities has a PV10 forecast (estimate10 attribute), PV50 (estimate) and PV90 (estimate90)
It’s just a visual thing I noticed, all the other graphs have 3 plots except tomorrows, and this is what I was trying to fix.
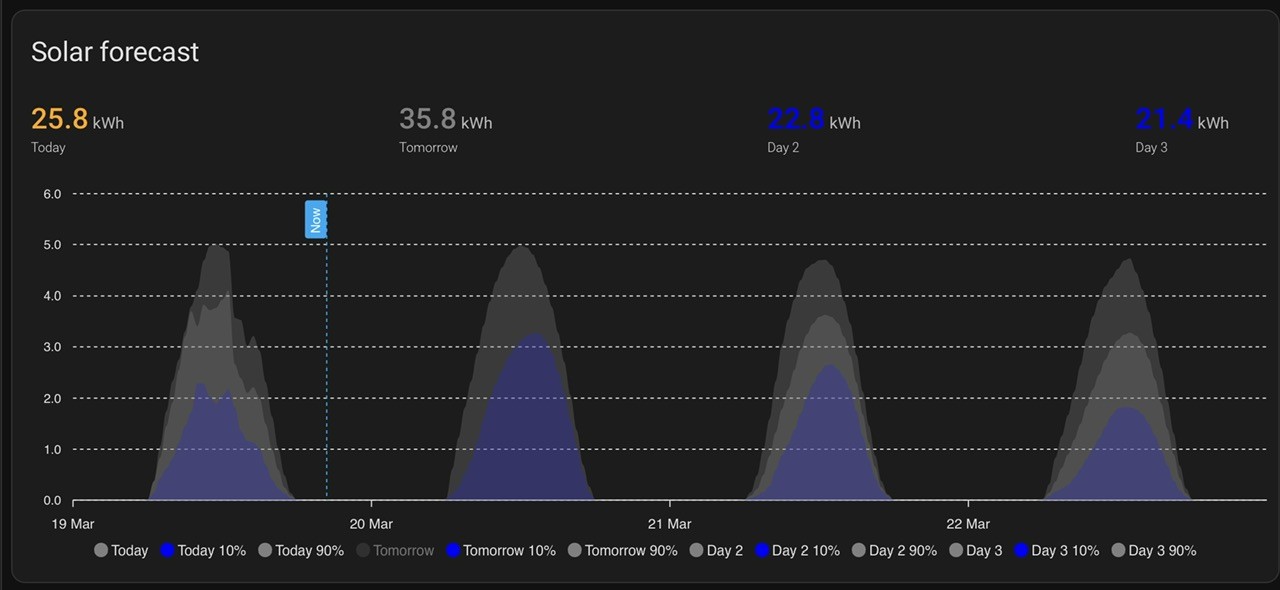
If I untick the Tomorrow dot at bottom I can see (dark grey and blue graphs)
If I tick Tomorrow dot at the bottom (light grey) it is the exact same as the 90% dot reading so covers it up (if that makes sense), none of the other charts do this?
The 10% blue is good.
I can see the Solcast Sensor Tomorrow. (I am not using the Predbat sensors)
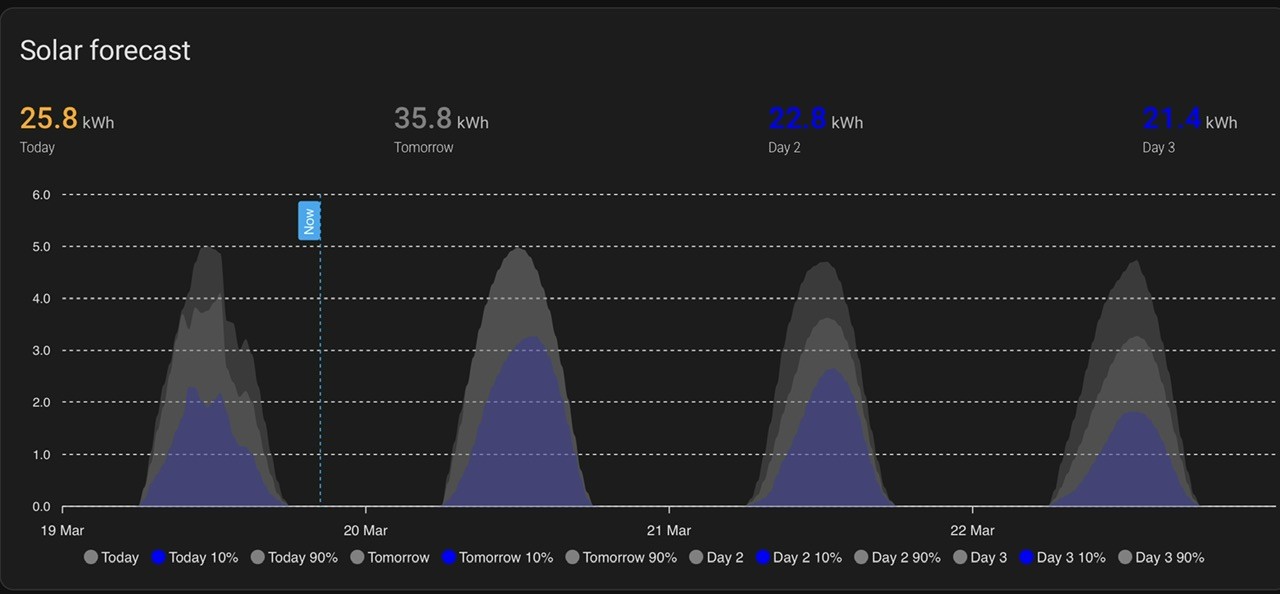
Daveb01 I can’t see all the Apex chart code in your screenshots, so check that in the data generators you have the attribute name correct for tomorrow’s estimate / estimate 10/ estimate 90 - the ["pv_estimate90"] bit.
Here’s mine for pv tomorrow (remember my entity names have been changed)
  - entity: sensor.solcast_pv_forecast_tomorrow
    yaxis_id: kwh
    type: area
    name: Tomorrow
    color: grey
    opacity: 0.3
    data_generator: |
      var today = entity.attributes.detailedForecast.map((start, index) => {
        return [new Date(start["period_start"]).getTime(), entity.attributes.detailedForecast[index]["pv_estimate"]];
      });
      var data = today
      return data;
    show:
      legend_value: false
      in_header: false
    stroke_width: 1
    float_precision: 2
    extend_to: false
  - entity: sensor.solcast_pv_forecast_tomorrow
    yaxis_id: kwh
    type: area
    name: Tomorrow 10%
    color: grey
    opacity: 0.3
    data_generator: |
      var today = entity.attributes.detailedForecast.map((start, index) => {
        return [new Date(start["period_start"]).getTime(), entity.attributes.detailedForecast[index]["pv_estimate10"]];
      });
      var data = today
      return data;
    show:
      legend_value: false
      in_header: false
    stroke_width: 0
    float_precision: 2
    extend_to: false
  - entity: sensor.solcast_pv_forecast_tomorrow
    yaxis_id: kwh
    type: area
    name: Tomorrow 90%
    color: grey
    opacity: 0.3
    data_generator: |
      var today = entity.attributes.detailedForecast.map((start, index) => {
        return [new Date(start["period_start"]).getTime(), entity.attributes.detailedForecast[index]["pv_estimate90"]];
      });
      var data = today
      return data;
    show:
      legend_value: false
      in_header: false
    stroke_width: 0
    float_precision: 2
    extend_to: false
The other thing could be simply that the forecast is the same. If you look at the attributes, do you see different values for the estimate/estimate10/estimate90?
PianSom On the Predbat Chart/PV and PV7 I think I understand the Forecast, Forecast 10% and Forecast 90%. But I have never understood what Forecast History is supposed to be showing me.
If I look on the predbat web console, charts, there is PV and PV7, but I don’t see Forecast History anywhere.
I’m guessing it is something to do with accuracy of forecast (vs actuals) but I don’t see it, nor is it an Apex chart (could be a new one I haven’t copied in of course)
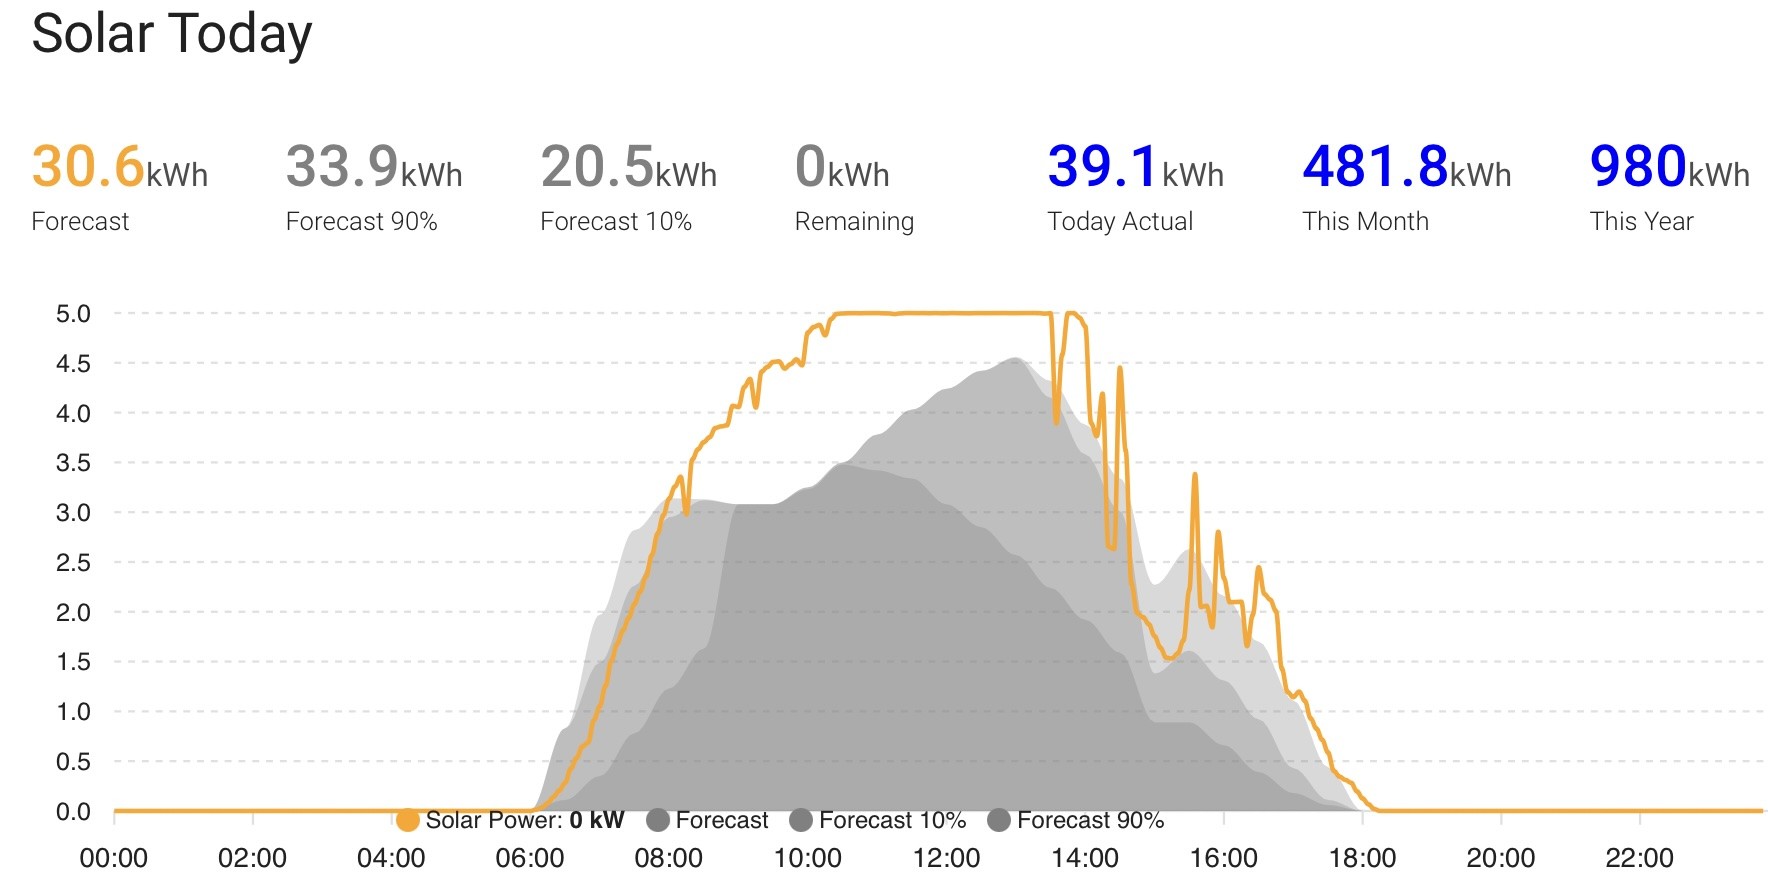
This is my final 'Today' chart showing Forecast, 90%, 10% and remaining in the header.
Header still busy but this is all the info. I certainly can't fit in remaining 90% and remaining10%.
Entities from predbat direct, rather than from the solcast integration.
Rob
Rbor crazy amount of info in the header. The kWh this month and this year can of course be obtained from the Energy dashboard (if you have spent forever loading all your history in of course ....)
I personally don't track the PV90 on the today chart, its almost always between the PV10 and 50 for me
PianSom On the Predbat Chart/PV and PV7 I think I understand the Forecast, Forecast 10% and Forecast 90%. But I have never understood what Forecast History is supposed to be showing me.
geoffreycoan If I look on the predbat web console, charts, there is PV and PV7, but I don’t see Forecast History anywhere.
geoffreycoan The other thing could be simply that the forecast is the same. If you look at the attributes, do you see different values for the estimate/estimate10/estimate90?
Good morning, you were right again and I have spent hours looking for something that was not there. Even worse I got you guys to look as well so I apologise. It is another be patient and wait for the next day to see what happens.
It is the same chart moved to today and new tomorrows chart is correct.
So sorry again guys 🐇🐇🙏
PianSom very strange. I don’t see PV power OR Forecast history on either of my predbat PV charts
Wonder why that is?
I have both pv_today and pv_power defined in apps.yaml, they’re both template sensors but that shouldn’t cause a problem, but they’re just not on the chart.
My guess is Forecast History it actual generation so far today, but should be in kWh if it is.
And have to admit I don’t know what PV7 is either.
I’ll add it to the list …
geoffreycoan
My PV7 is shown below.
This is my interpretation.
I don't know whether this is correct but it seems to make sense to a 🐇.
But we are trying to interpret the Web UI charts without yaml code to help us.
Rob
I had fondly imagined - like you, I guess - that the web interface was the same for everyone. Apparently not. Who knew??
PV7 is just the last week actual v forecast, I think. (For me, at least!) Maybe Forecast history is a cludge because in Trefor-land a forecast is the future and has no past. Dunno. And why the Forecast history sometimes - but not always - increases overnight is another curiosity.
These are probably the charts I am closest to understanding, but even these retain their air of mystery.
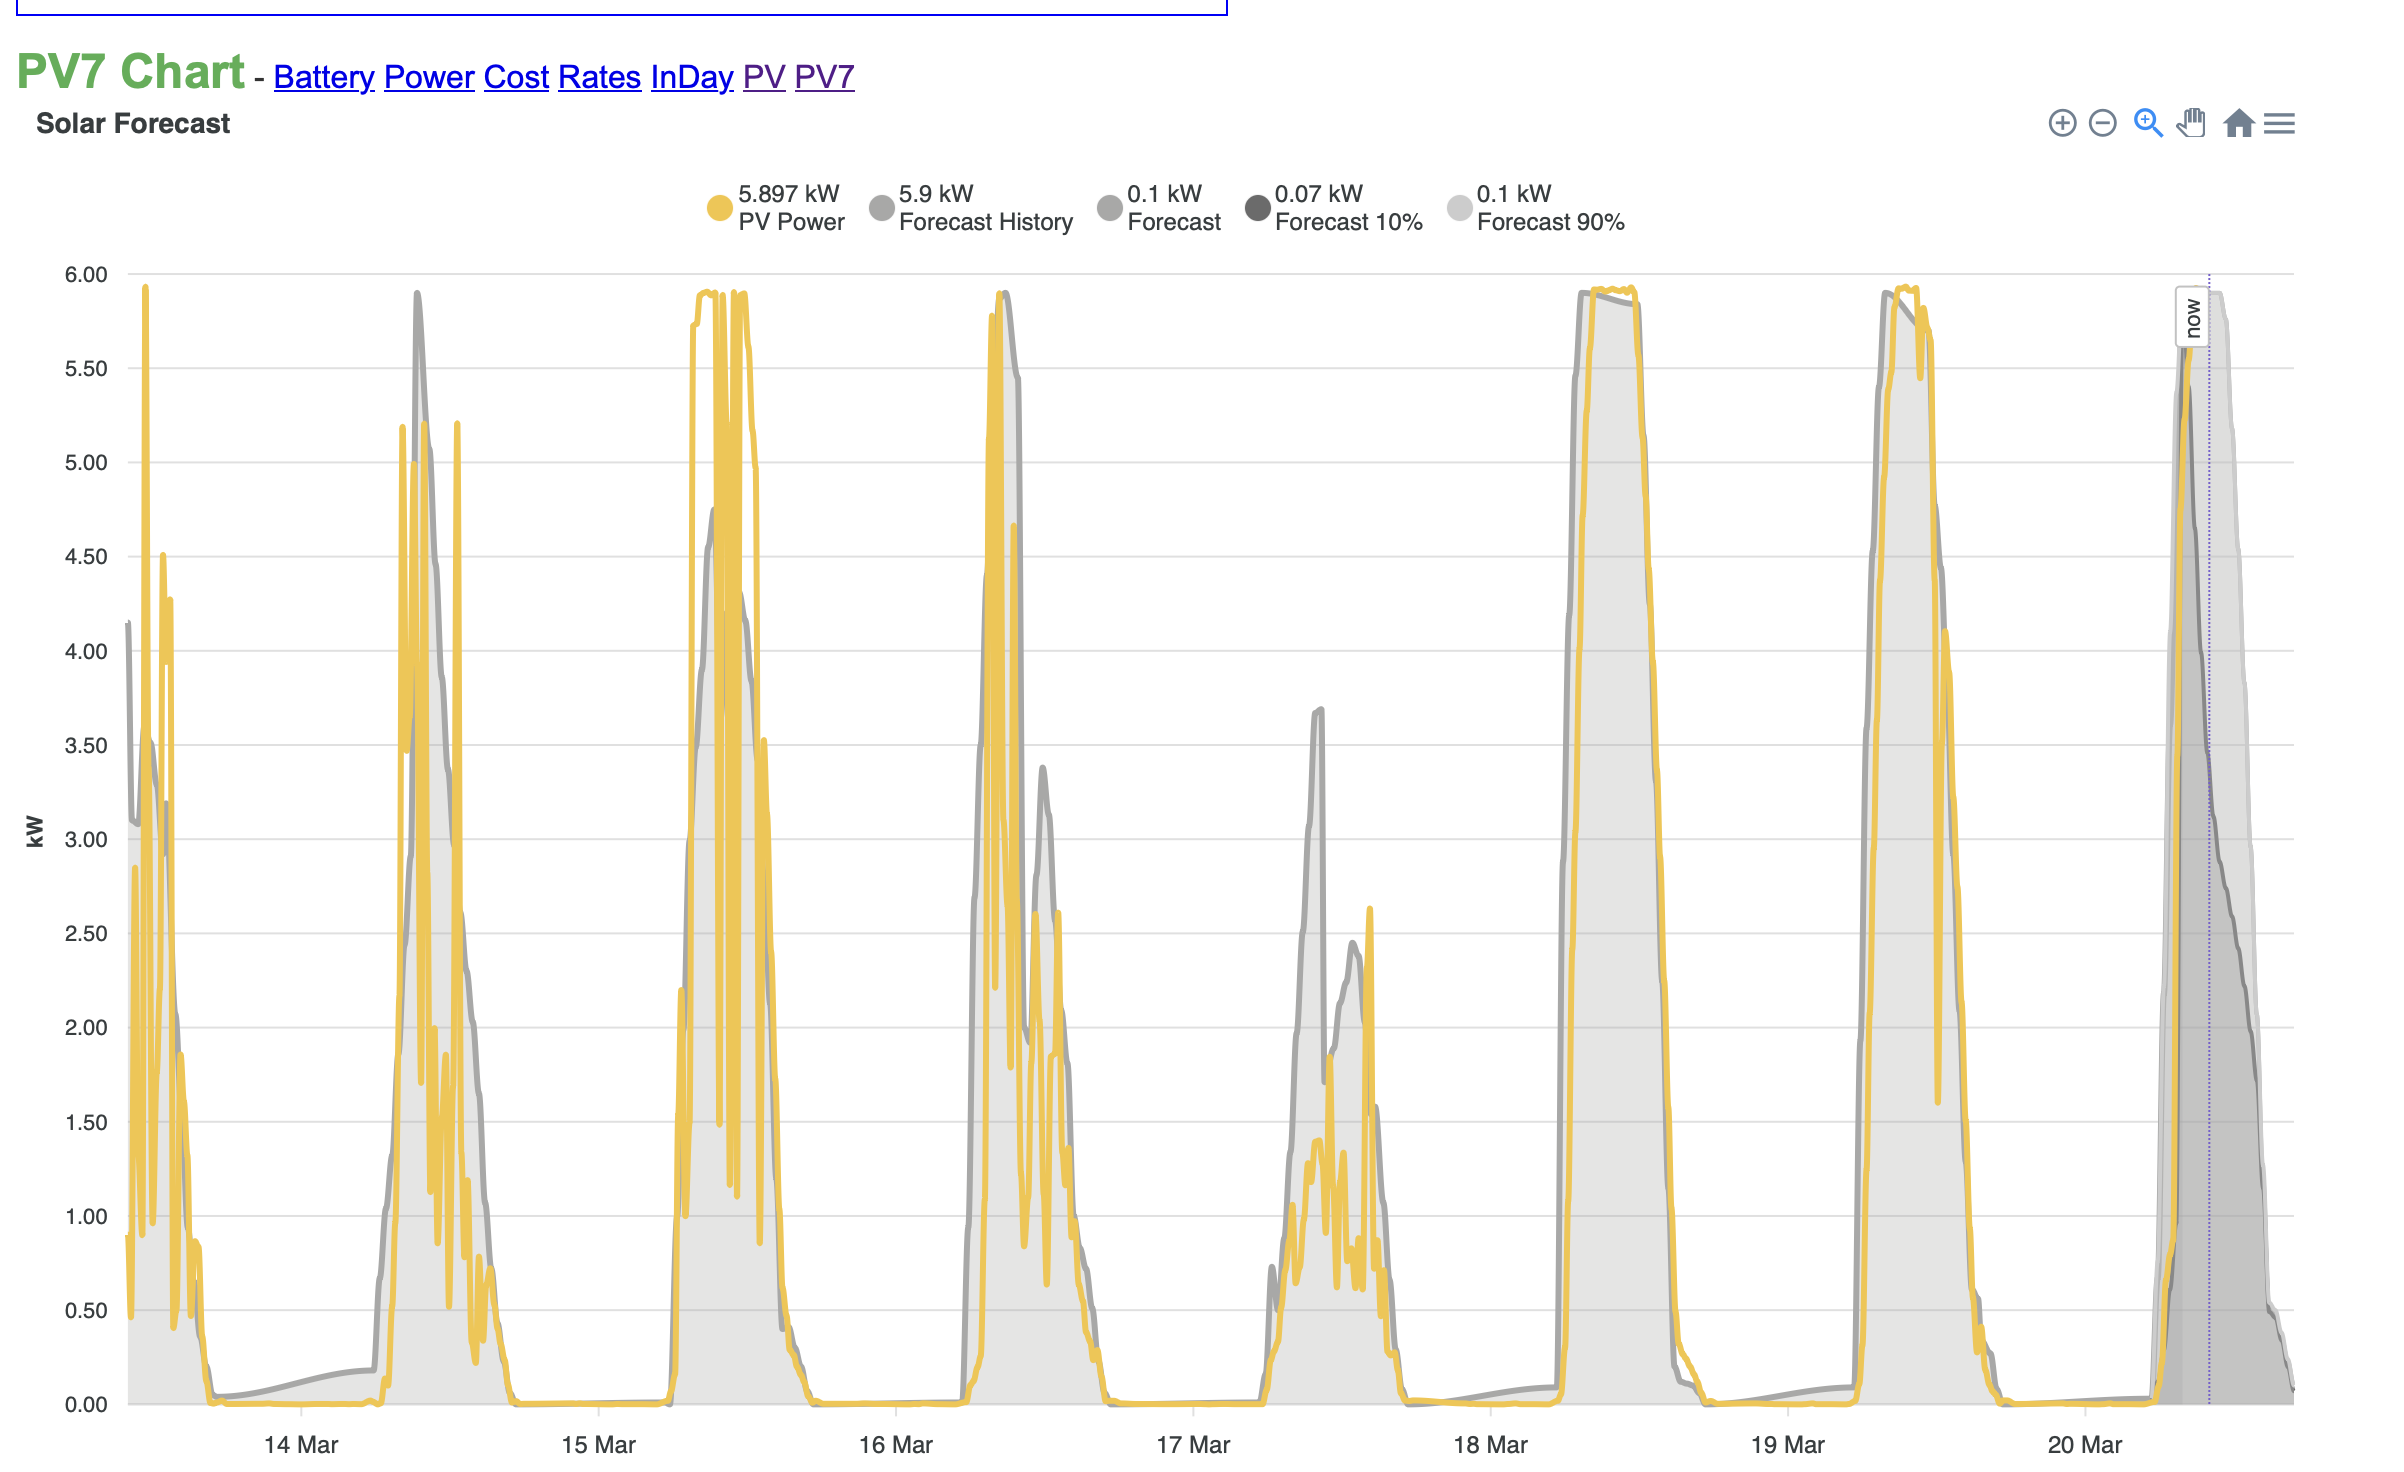
PianSom my PV7 chart shows exactly the same as the PV chart, which is why I never understood what it was showing
the lack of 7 day history may be due to my more aggressive entity purging, but doesn’t explain why I don’t get anything on the today chart which I am still confused about.
will have to look at the code, and yes, it needs more documentation writing
geoffreycoan I have both pv_today and pv_power defined in apps.yaml, they’re both template sensors but that shouldn’t cause a problem, but they’re just not on the chart.
These are the 'today' lines for pv energy and power from my apps.yaml, which I have pointed to the solaredge pv entities from the solaredge integration:
  pv_today:
    - sensor.solaredge_energy_today

  pv_power:
    - sensor.solaredge_current_power
My PV chart gives a line for pv power so perhaps this doesn't show from the givtcp power line:
  pv_power:
    - sensor.givtcp_{geserial}_pv_power
In the energy dashboard, the solaredge energy entity doesn't get accepted by HA.
But the givtcp energy entity is accepted.
A workaround is to use the energy entity from the solaredge modbus integration which is accepted by the energy dashboard:
sensor.solaredge_modbus_ac_energy_kwh
I want to use this in my energy dashboard but all my energy data has been obtained using the givtcp energy entity. I want to merge the two and then use the solaredge modbus entity.
Is this a case of too many entities trying to monitor the same thing (and giving different values!)
Rob
So I've looked at the code and got to the bottom of why I'm not seeing these series' on the graph.
Predbat is using the entity history for predbat.pv_power for the 'PV power' (predicted PV power now) and sensor.predbat_pv_forecast_h0 (which tracks the PV 'power now' forecast).
Text in brackets is the descriptions from the documentation wot I wrote.
They seem very similar descriptions which may be an issue with the documentation, but the reason they don't appear for me is that these are two of the many entities I have disabled from the recorder so I have no entity history. Instead I rely on the input sensors in apps.yaml as you highlight above Rob.
I will need to re-enable these sensors to have another look what they are doing, and then probably change the code to use the apps.yaml input sensors rather than predbat output.
Another looking glass hole to disappear into ...
Wow never really looked at this before, it even took me a few mins to work out where it was (typical for me at the moment). All the tabs are very good and a credit to Trevor.
Or was this a test to see if I am paying attention 🥴😎👍
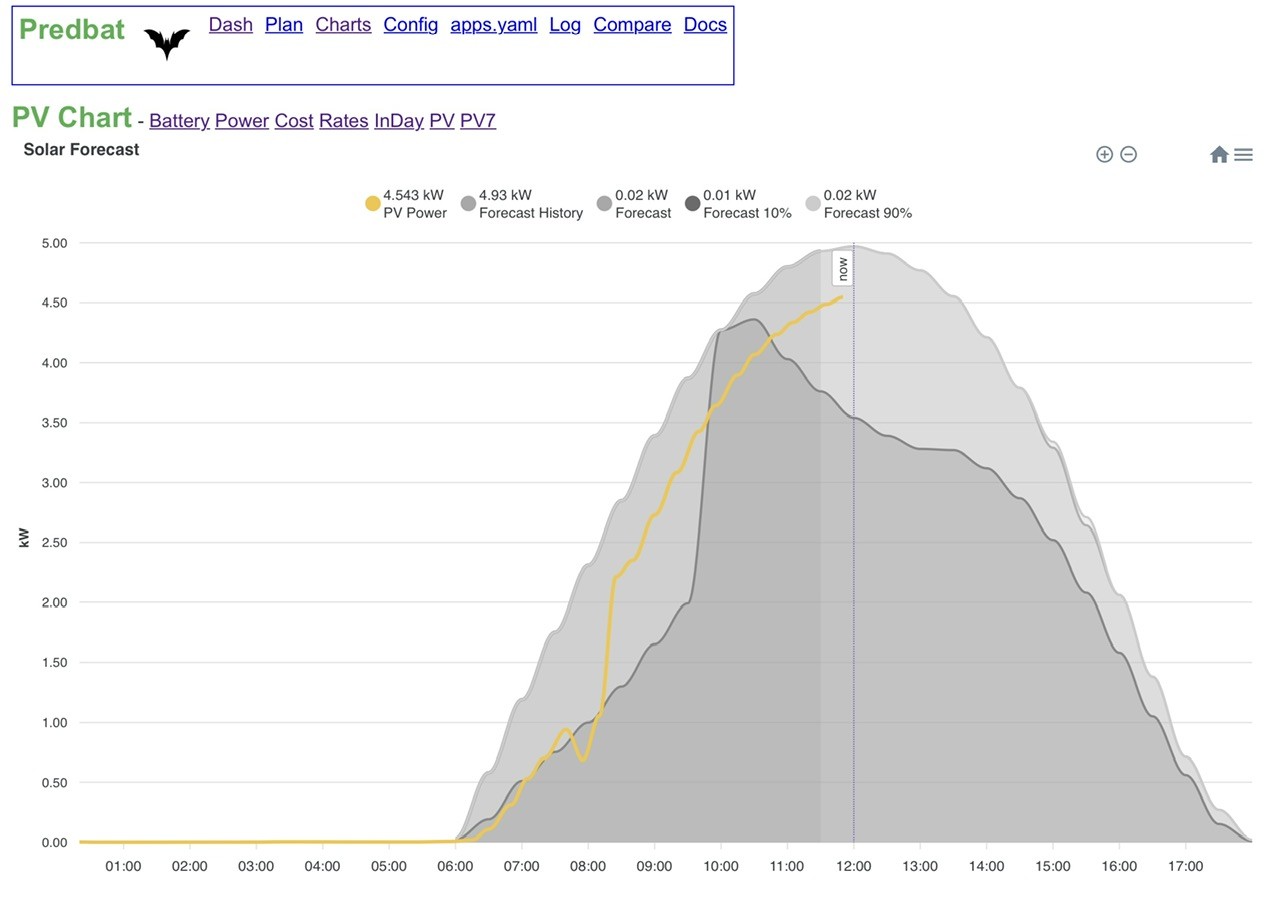
Daveb01 you're clearly not purging your entities enough if it all works 😉
Under the covers it is all HTML rendering and Apex charts, just with the Apex hard coded generated in the code. web.py if you get bored and want to take a look at it