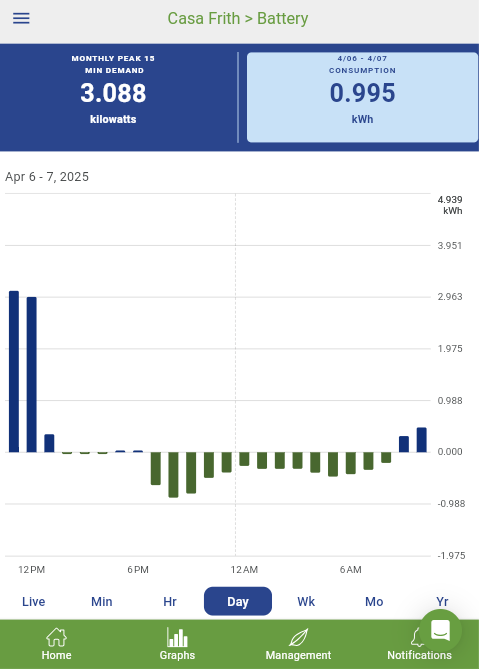
Hey
I have seen something similar.
I have had a gateway and 13.5kwh AIO installed in November.
Until 2 days ago all Giv mobile app data has coincided near perfectly within 3-5% easily put down to losses in Octopus graphs and solaredge appdata.
What changed 2 days ago was the first time I setup the AIO to export power using timed discharge.
The higher I set my export rate on the aio. Load in the app increases whilst load on the web portal shows a lower more normal figure.
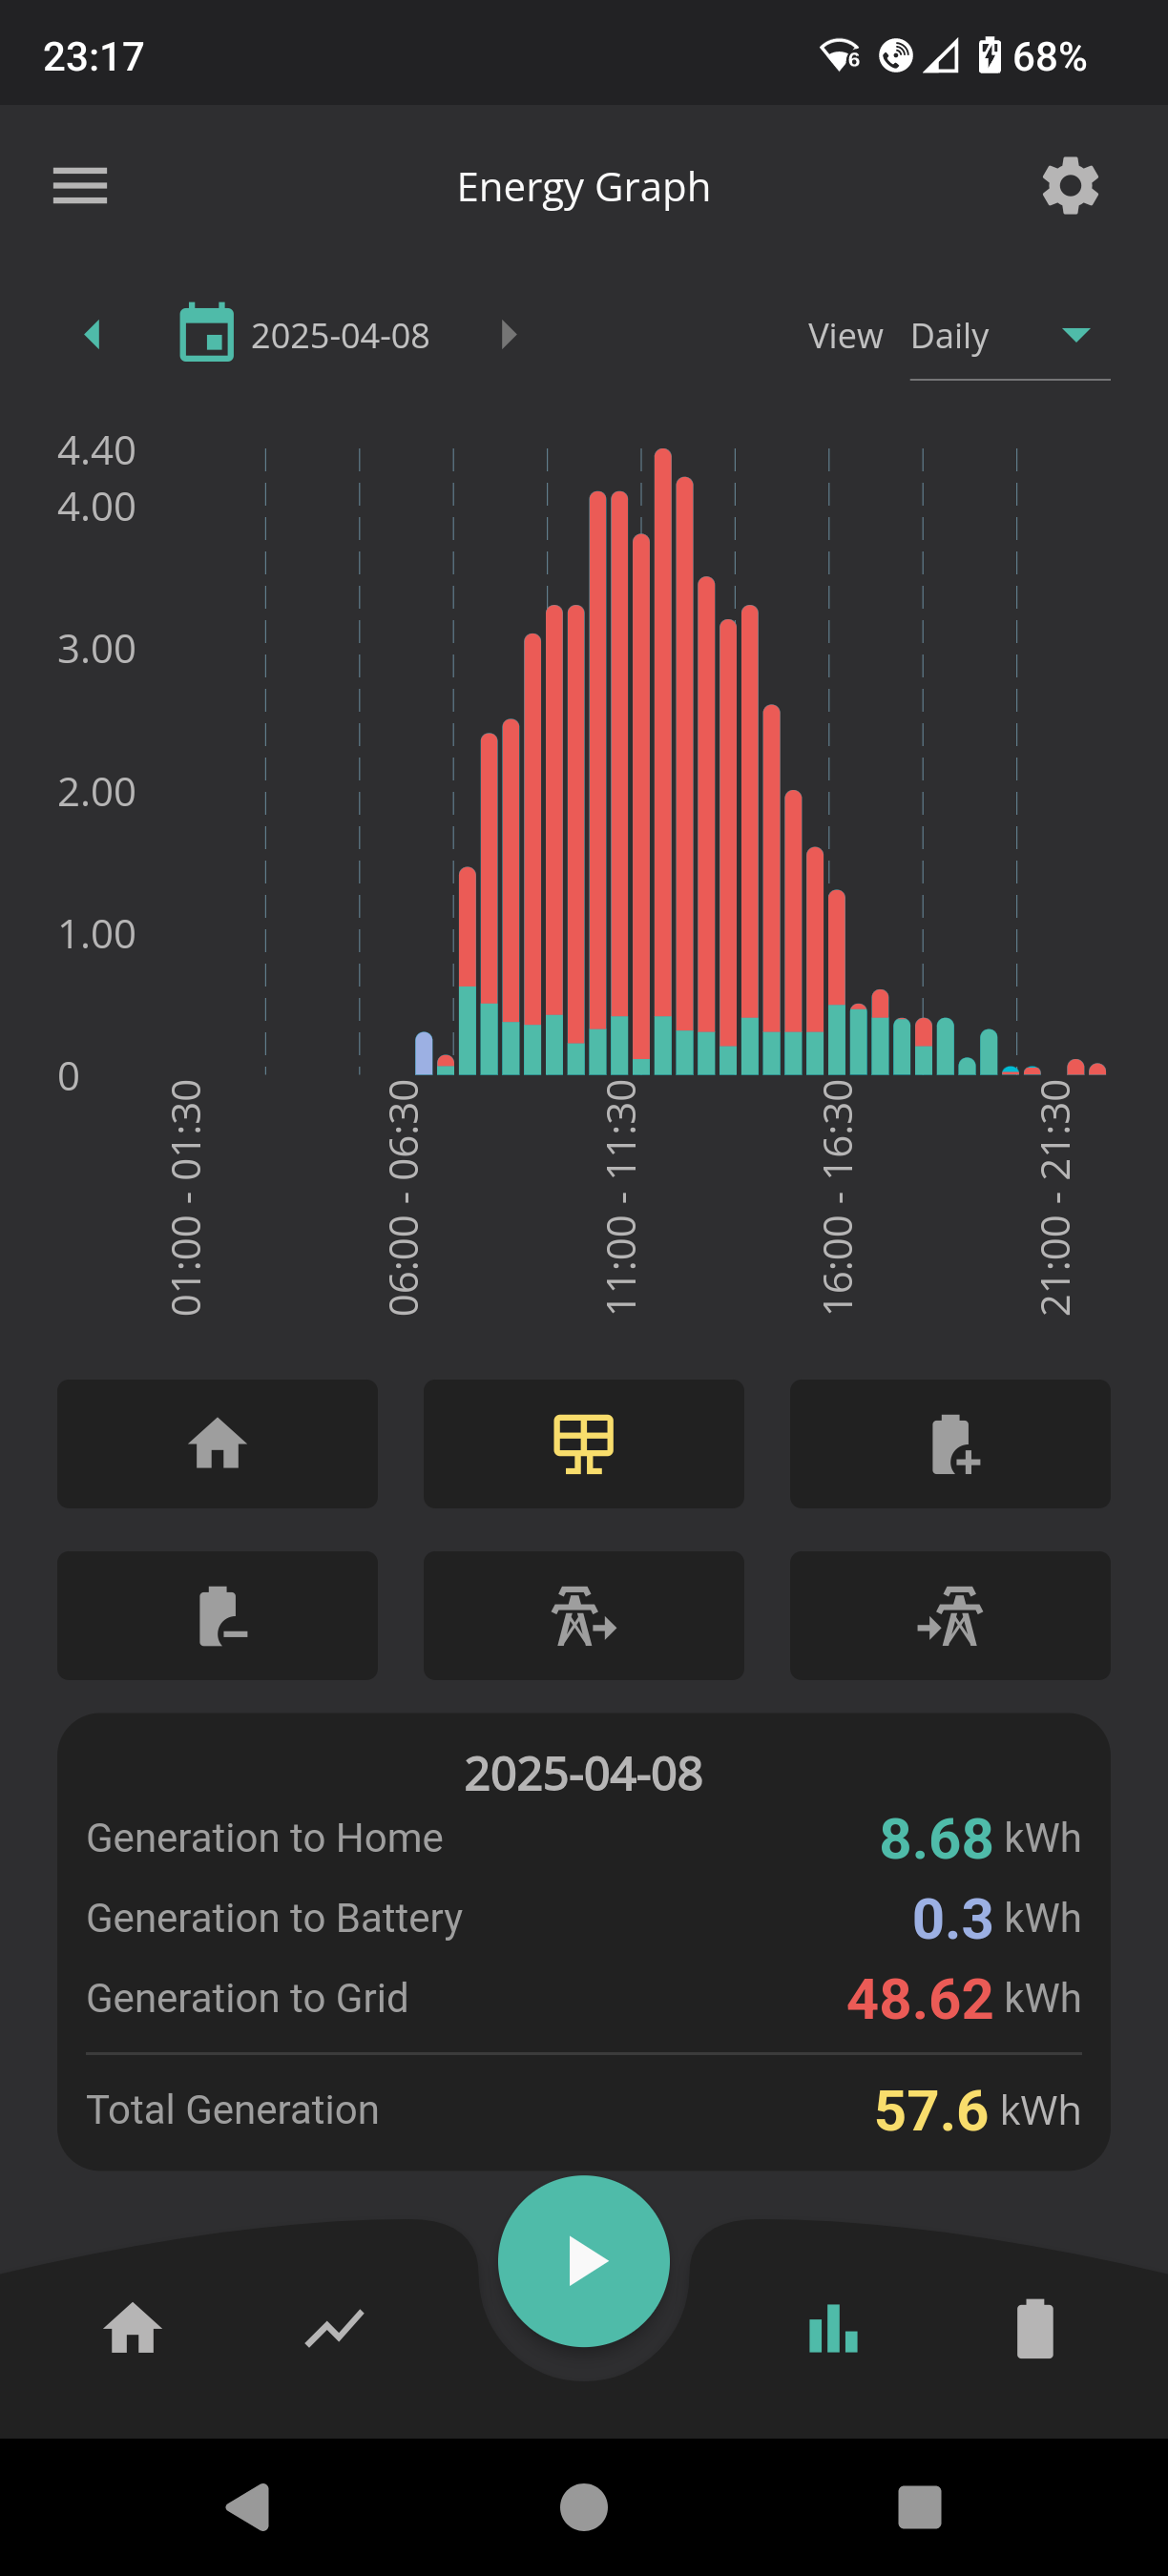
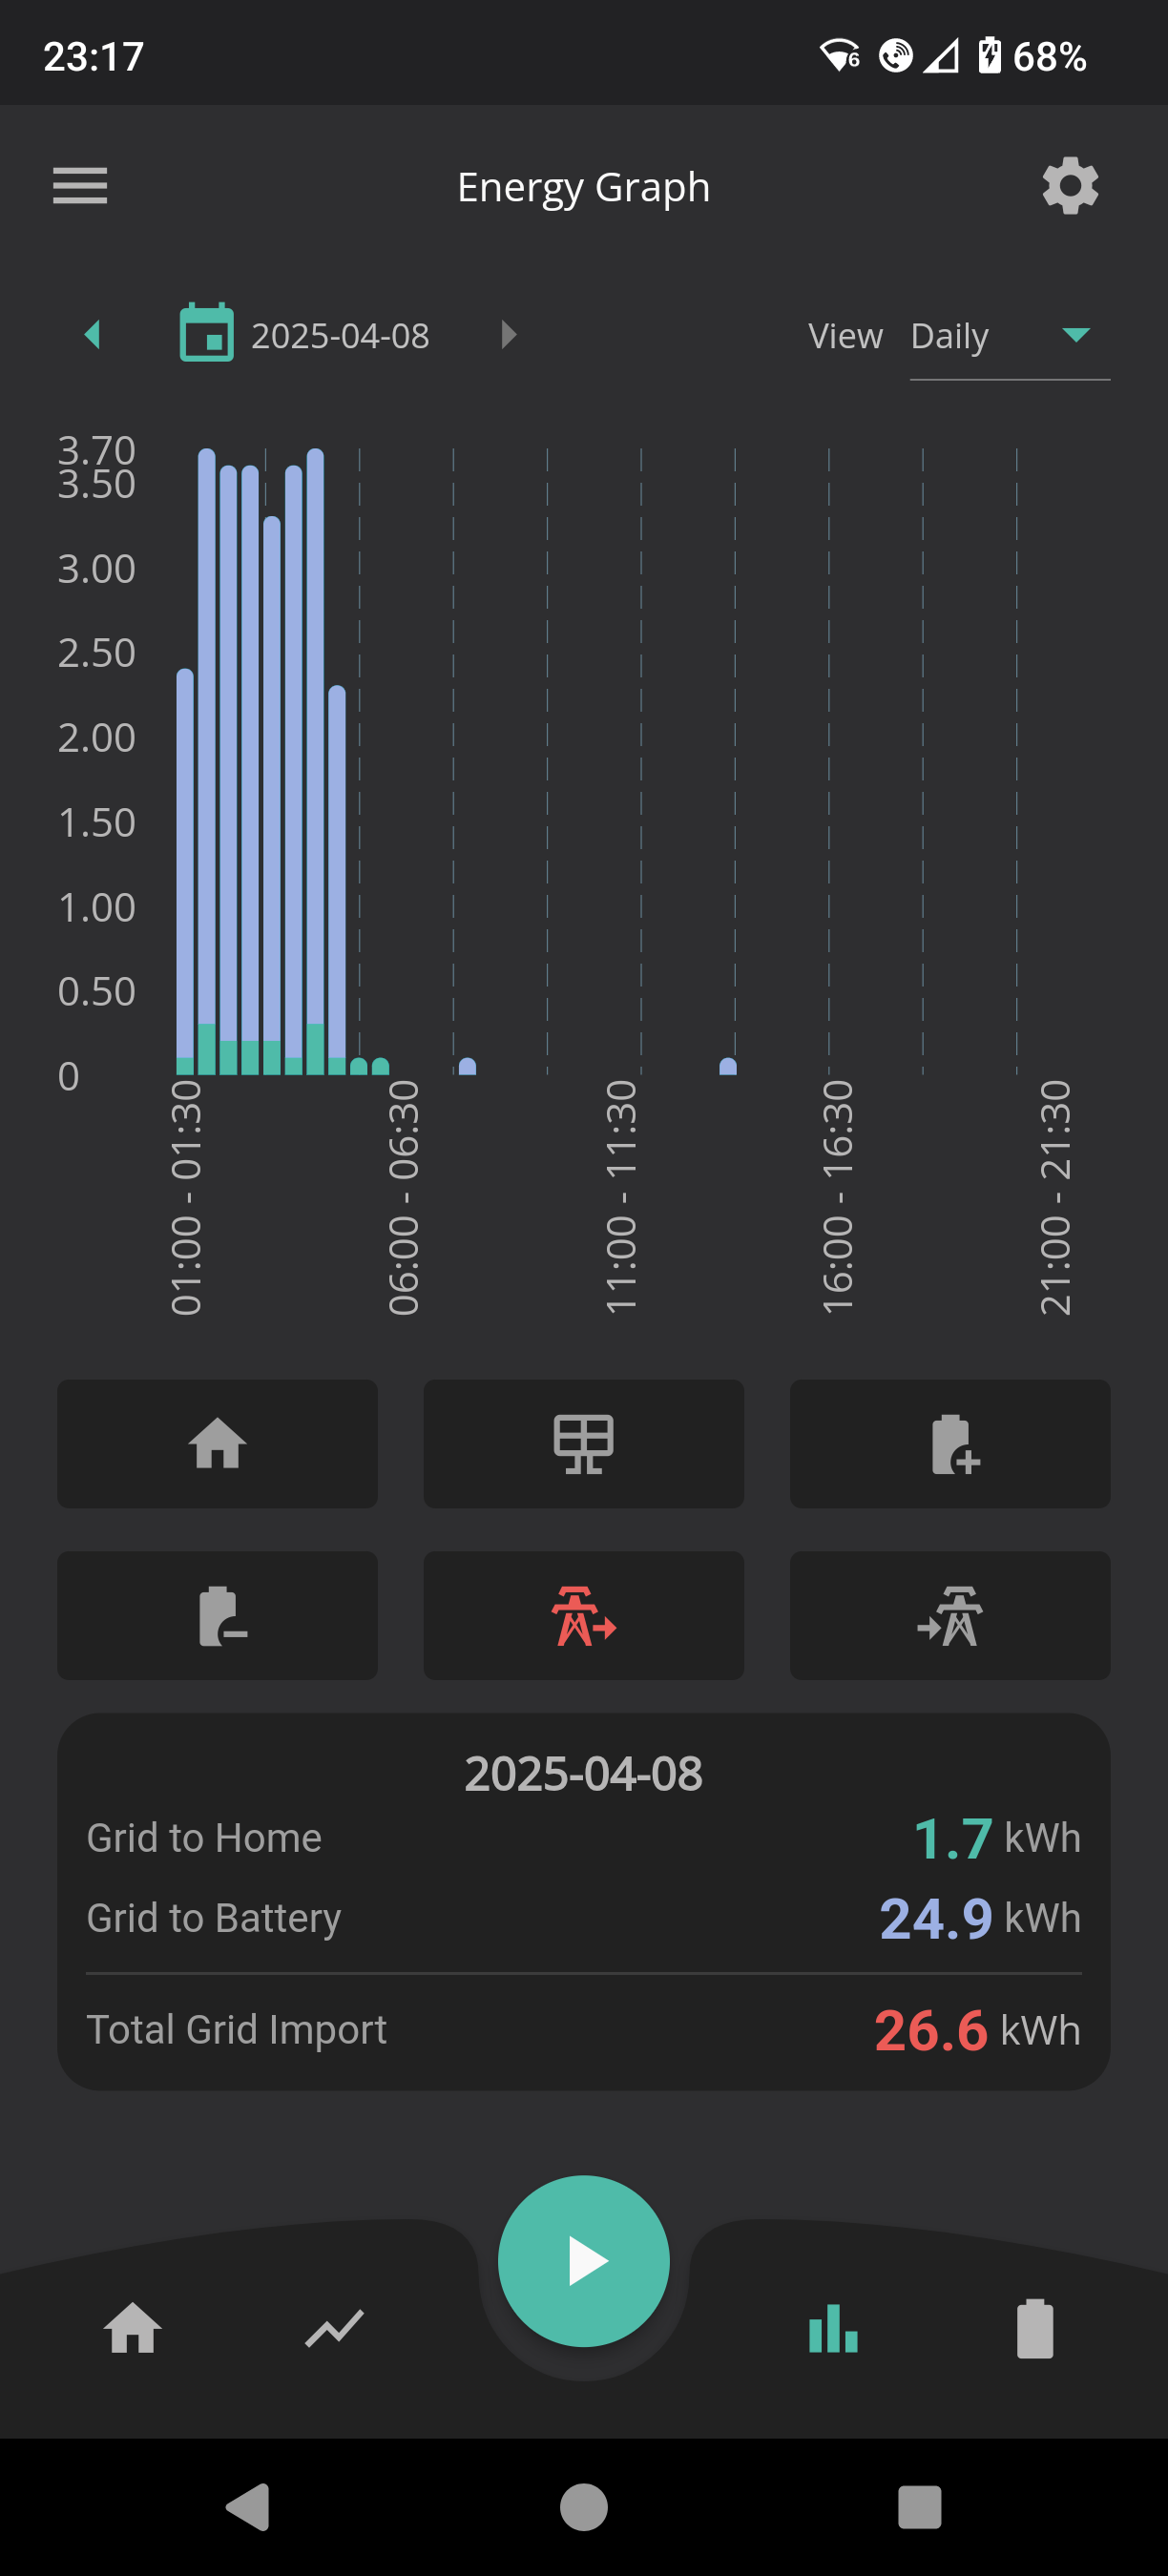
Since doing the export all my graphs in the app are throwing very weird numbers also. Again the giv web portal seems close to the other octopus / solar edge data.
I will contact support and provide all the evidence I can however interesting I'm not the only one seeing this.
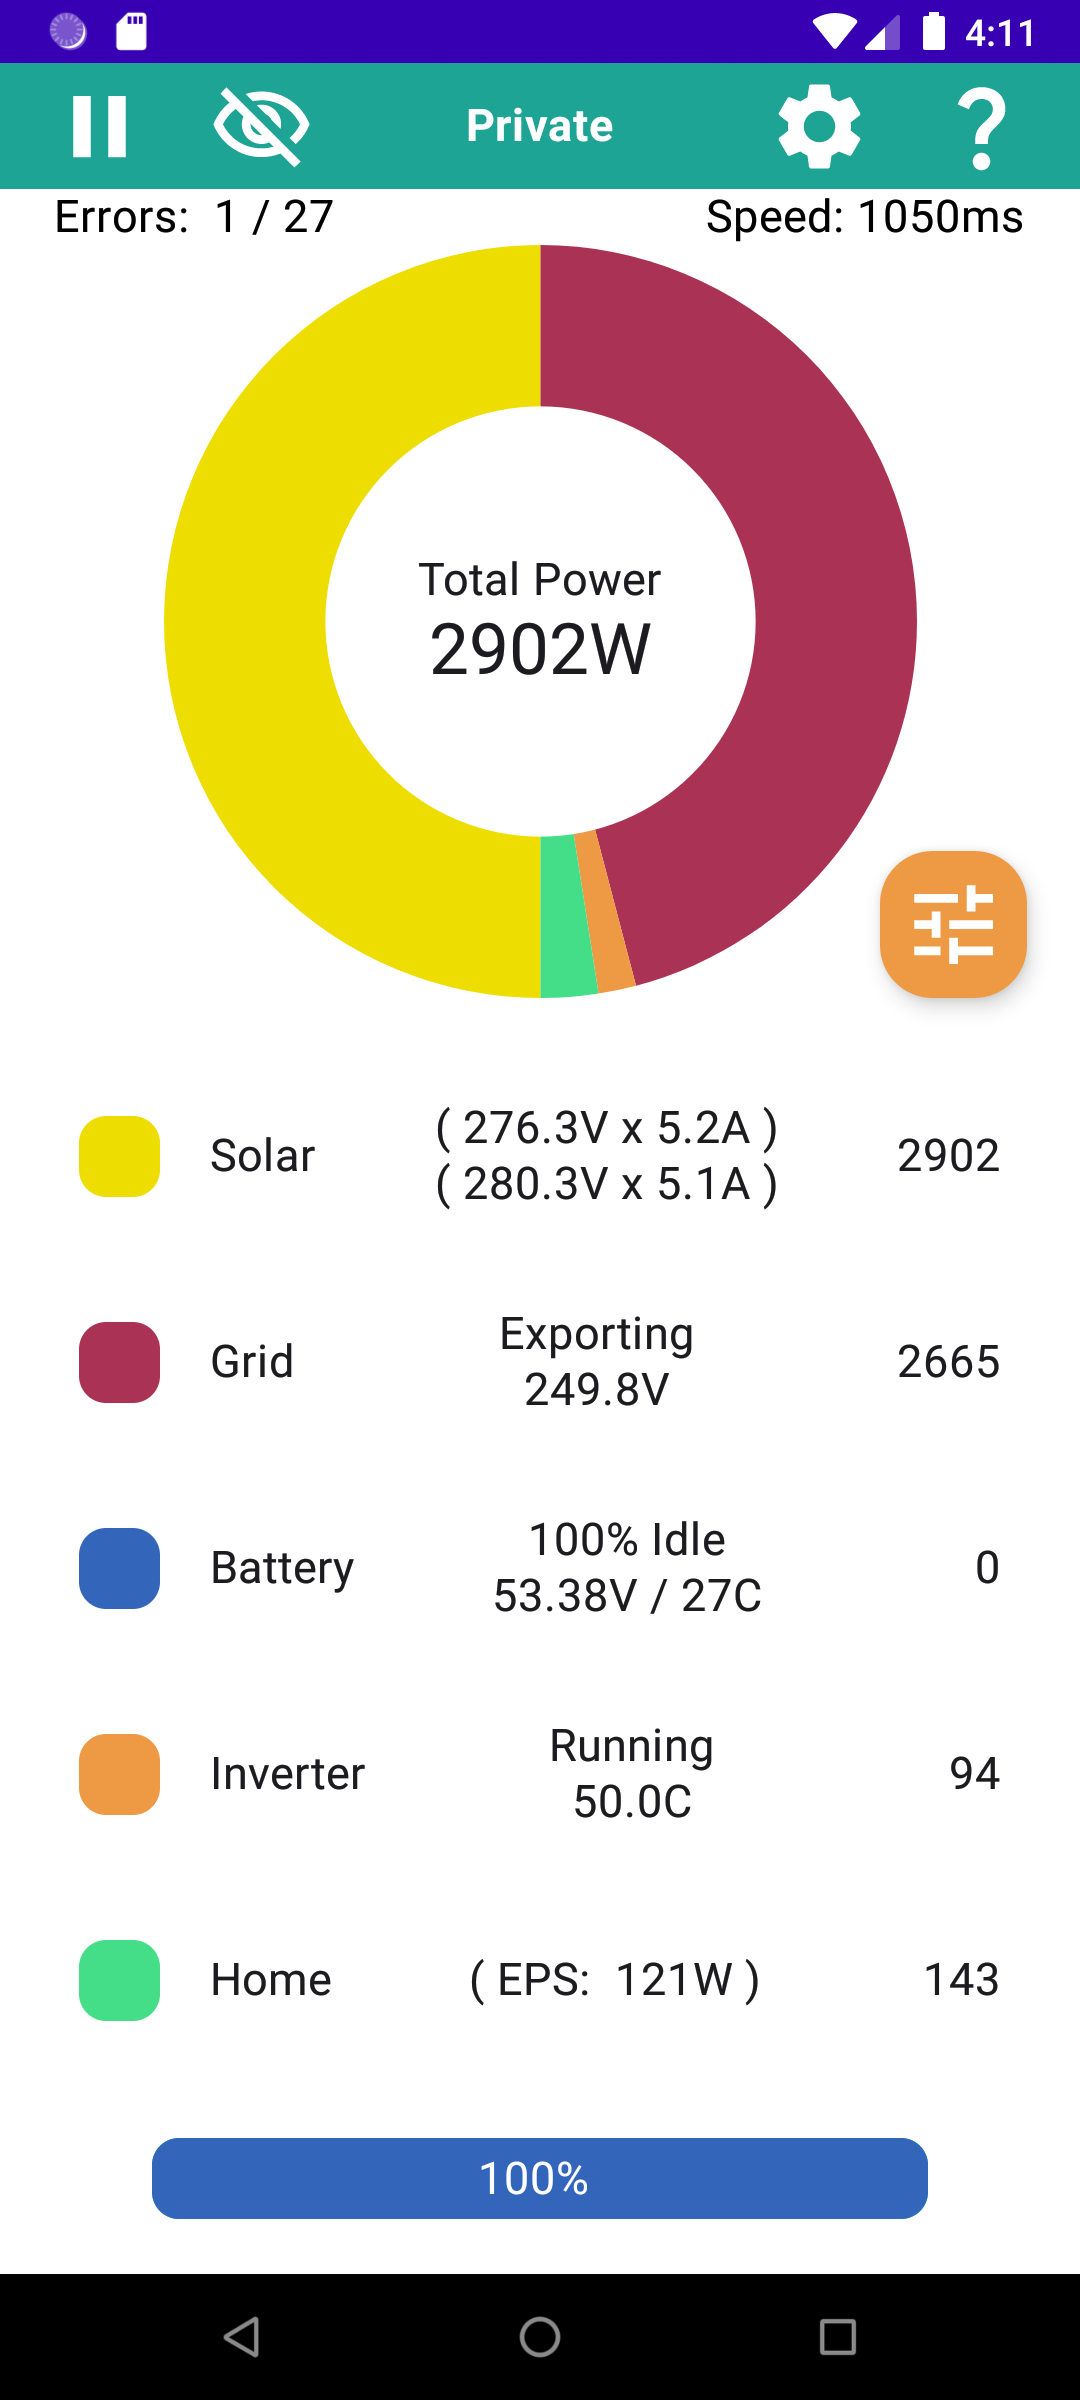
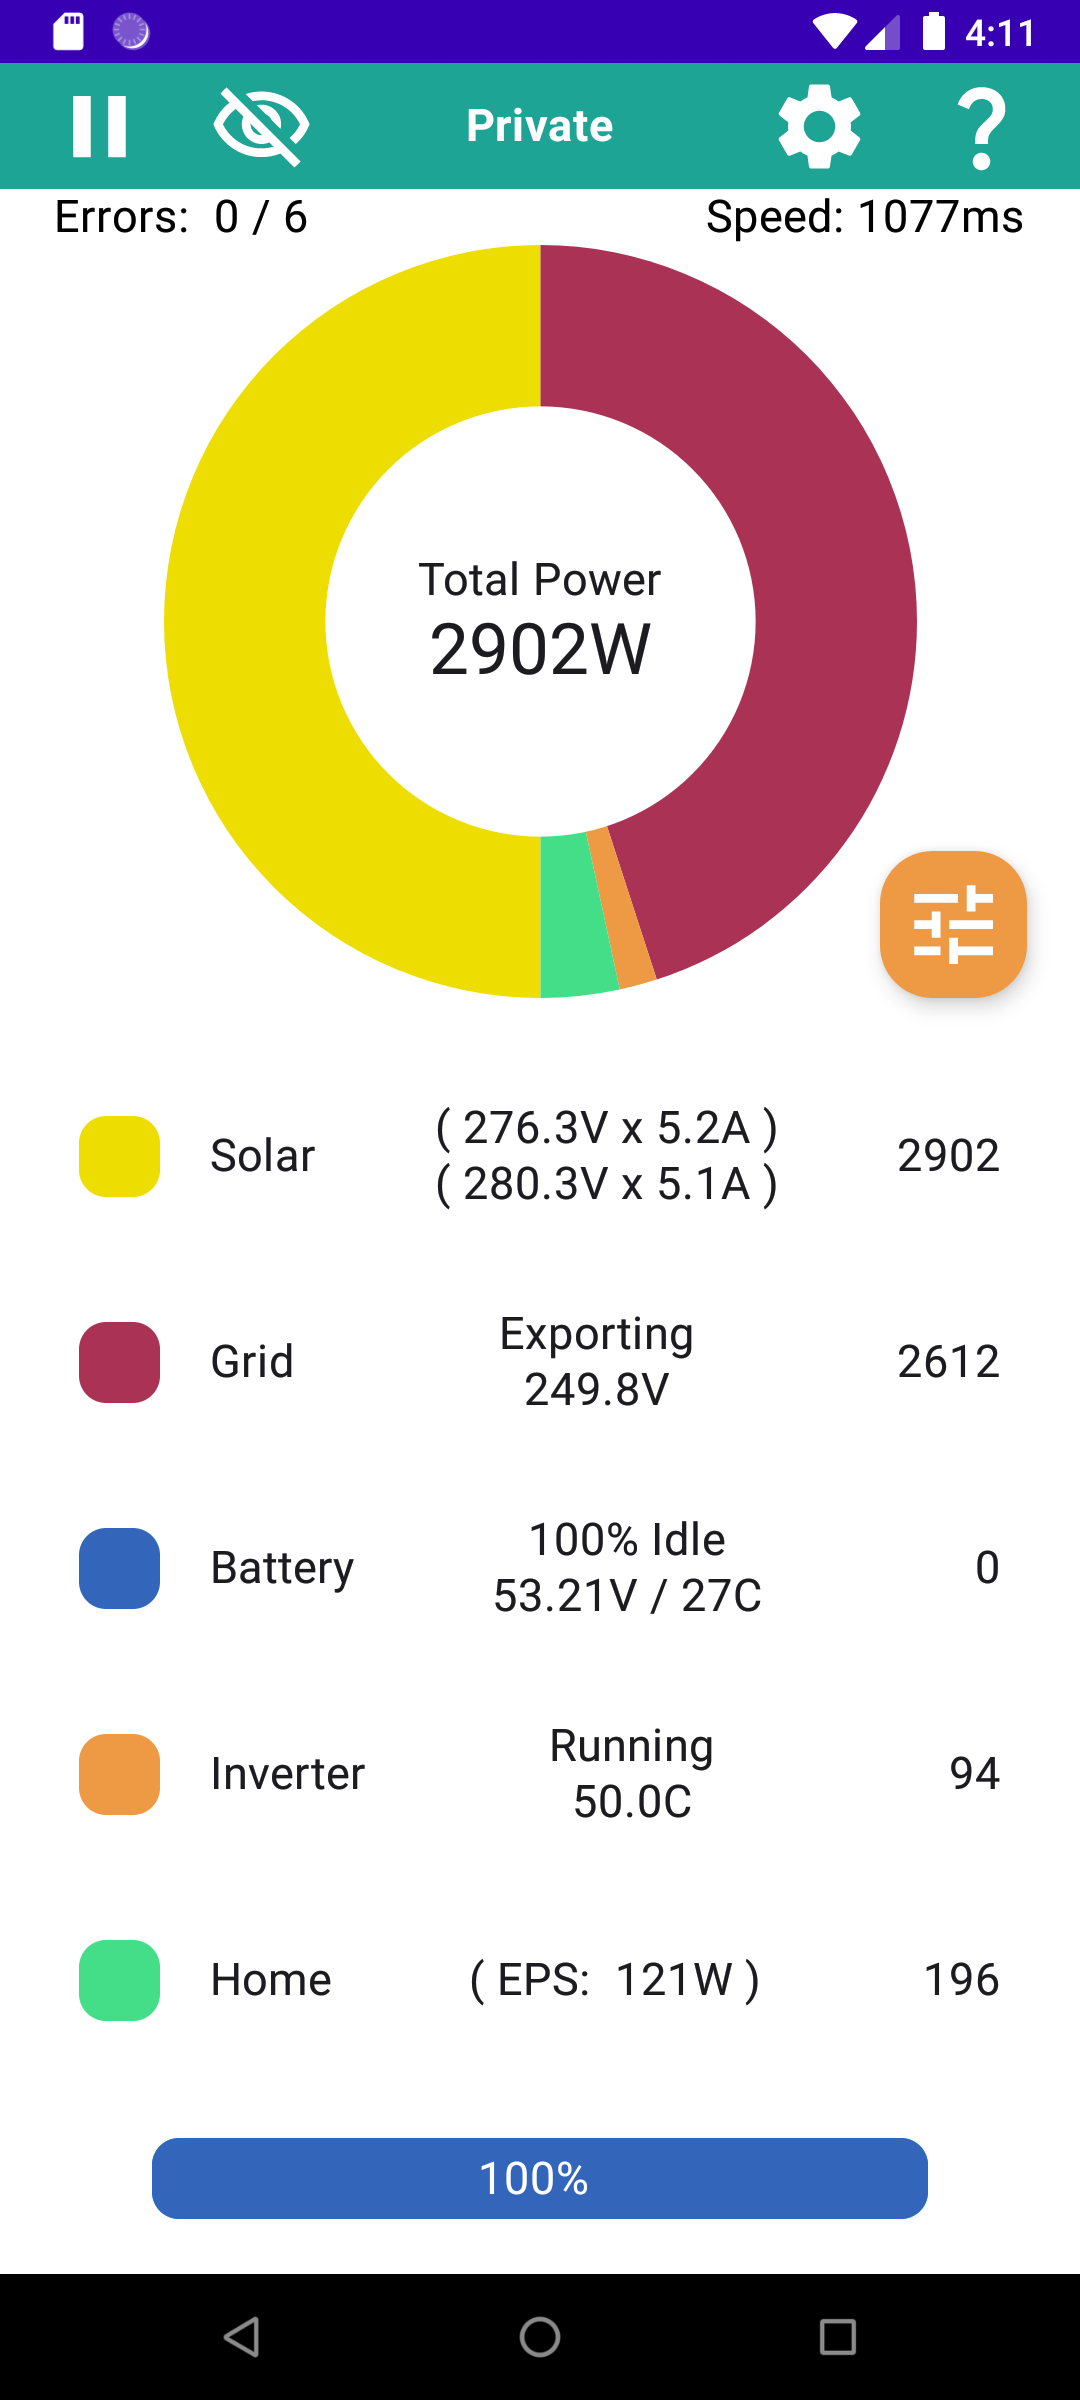
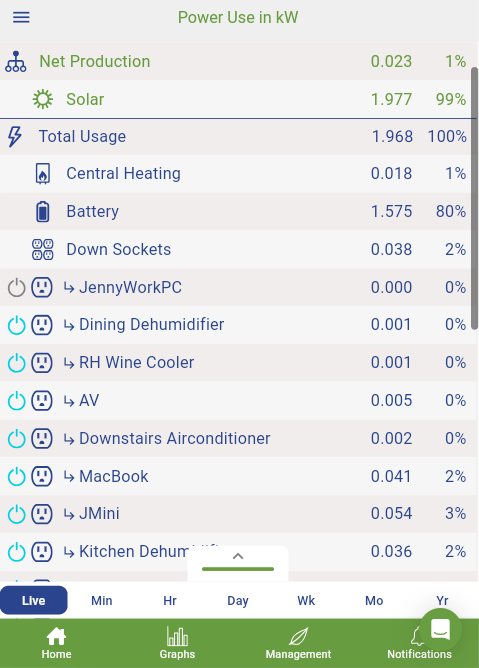
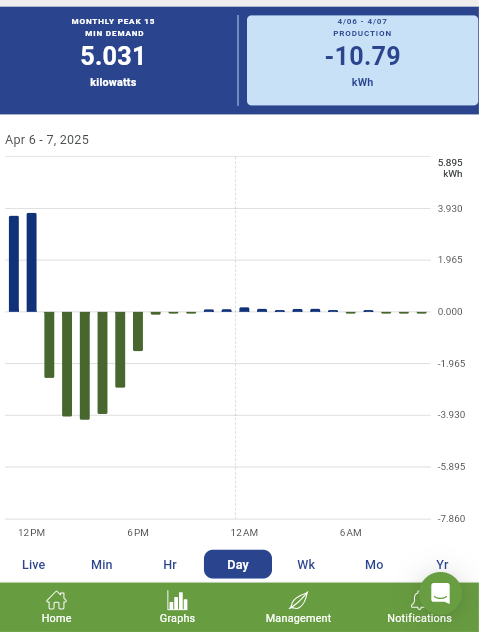
Edit added some screenshots.
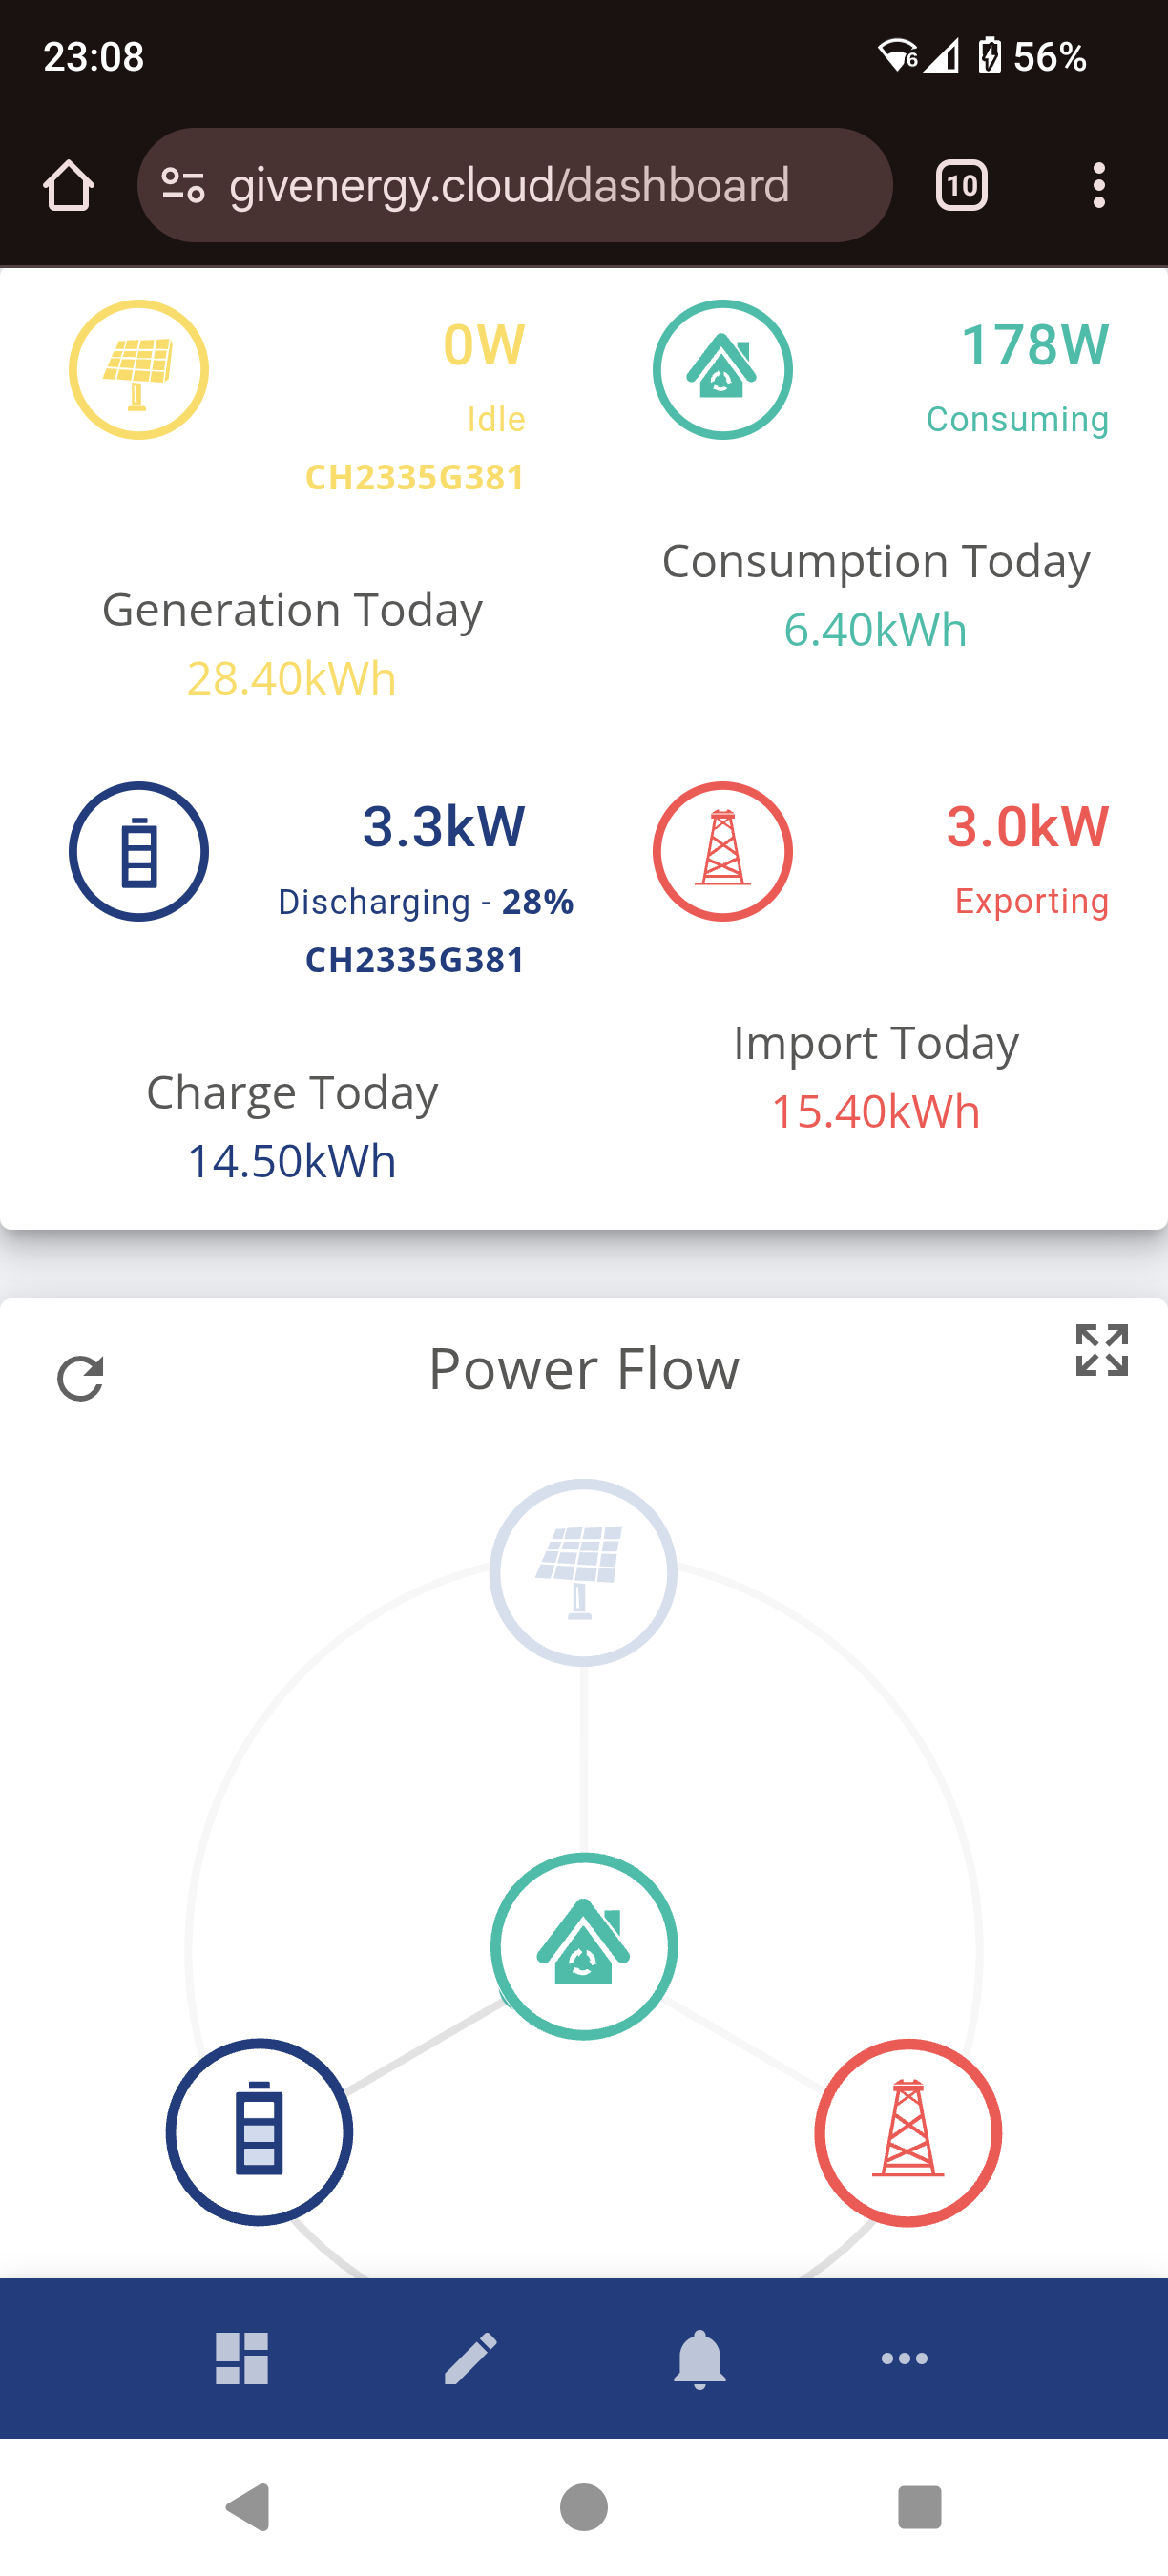
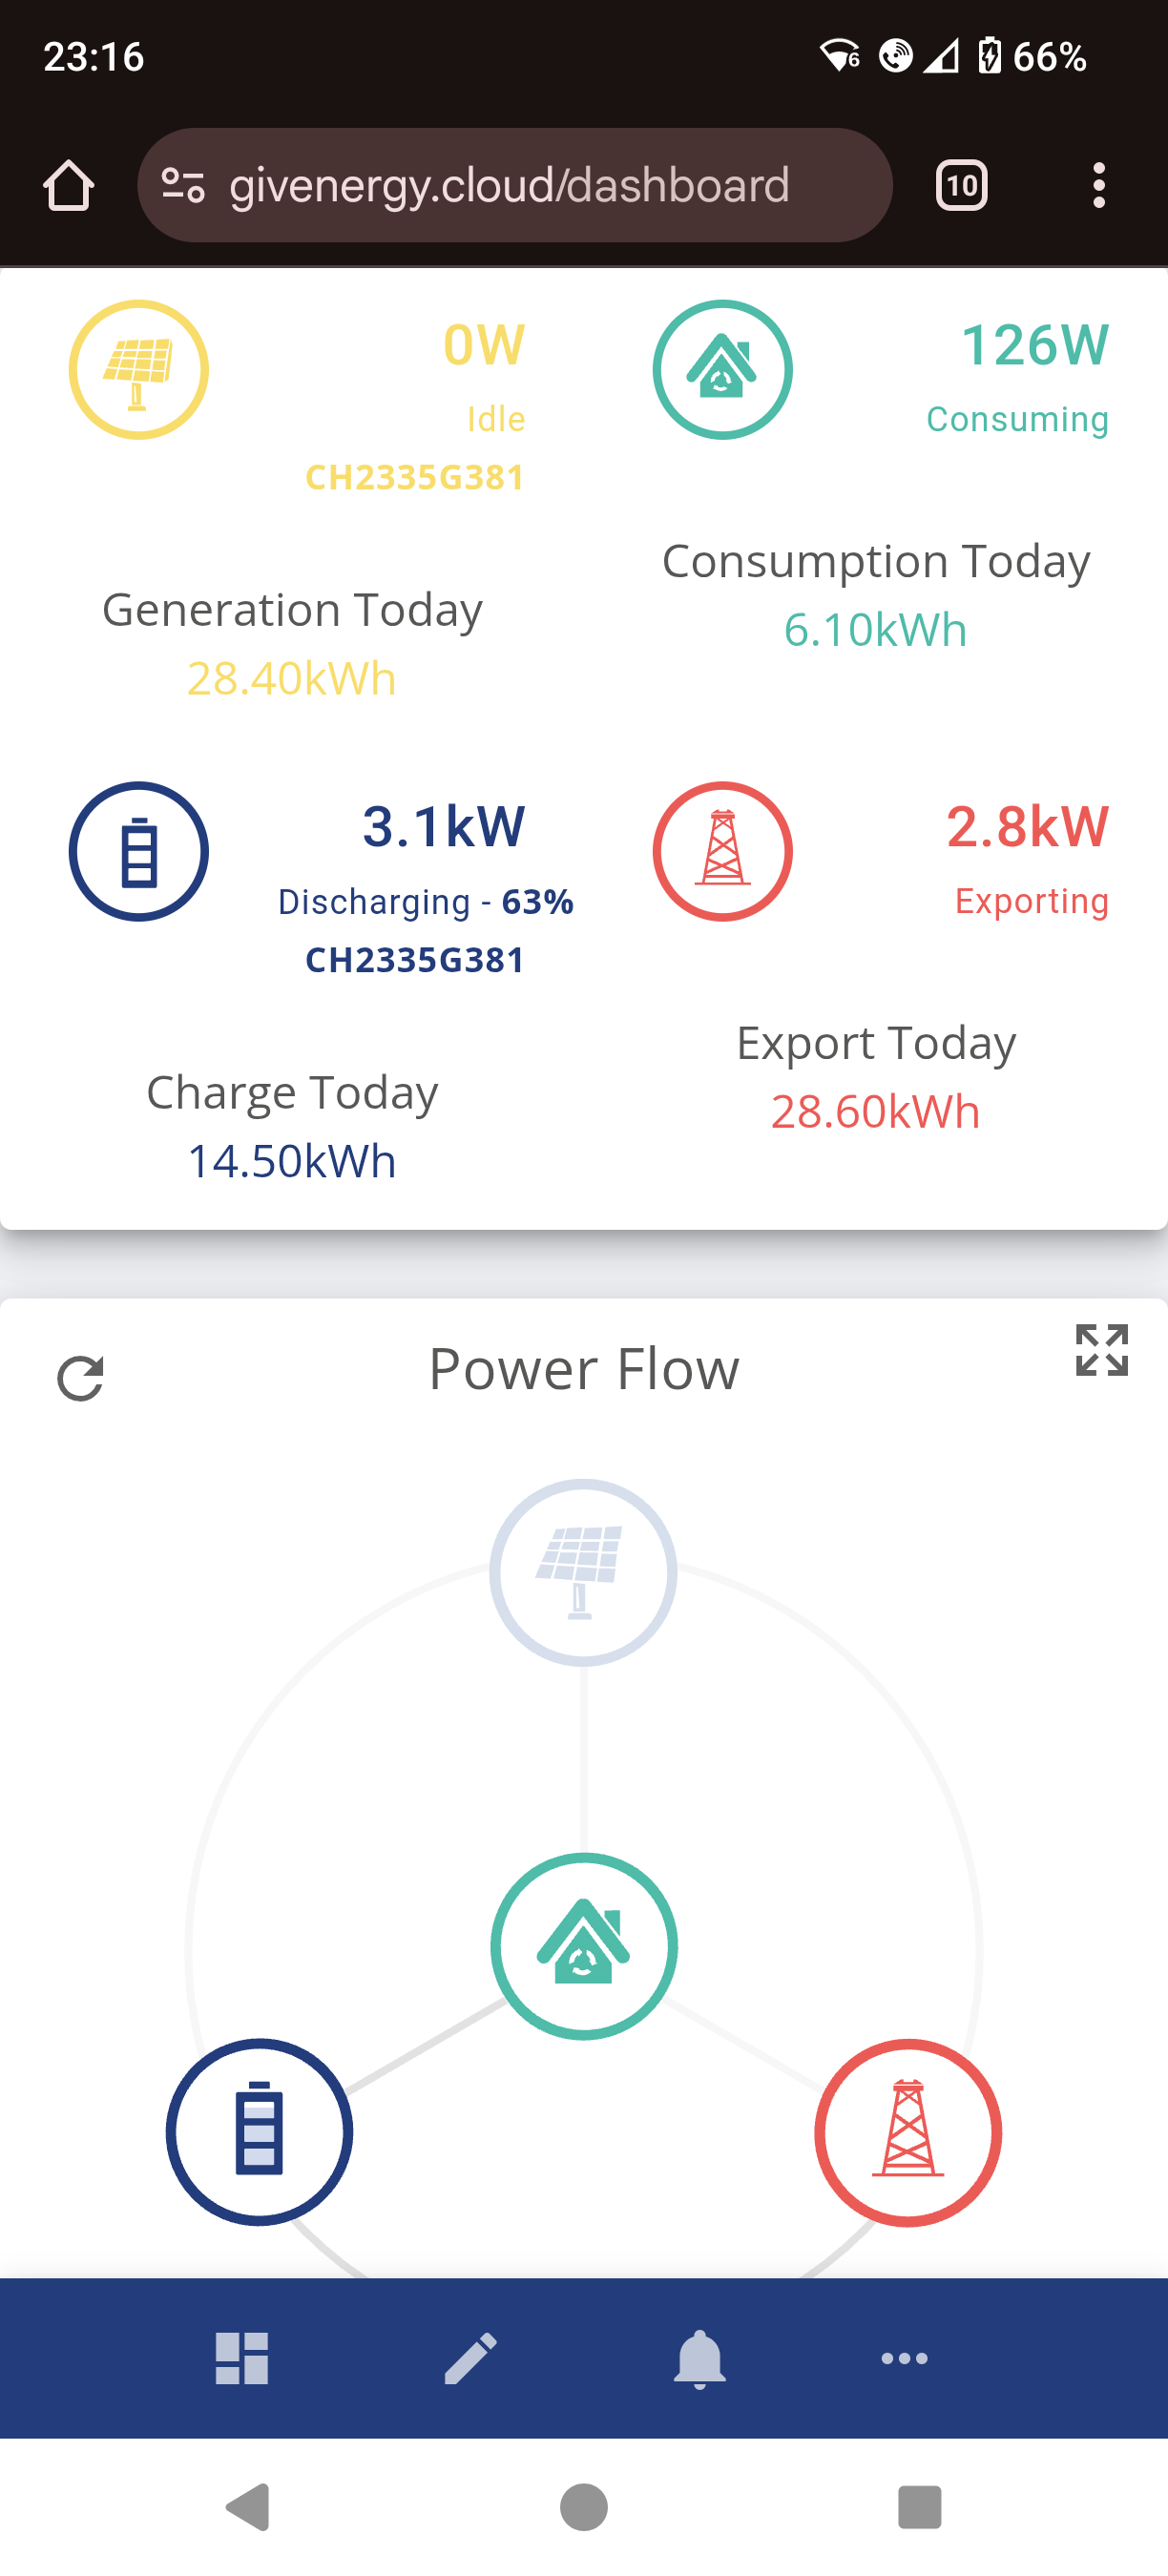
App showing 347. Portal at same time showing 178.
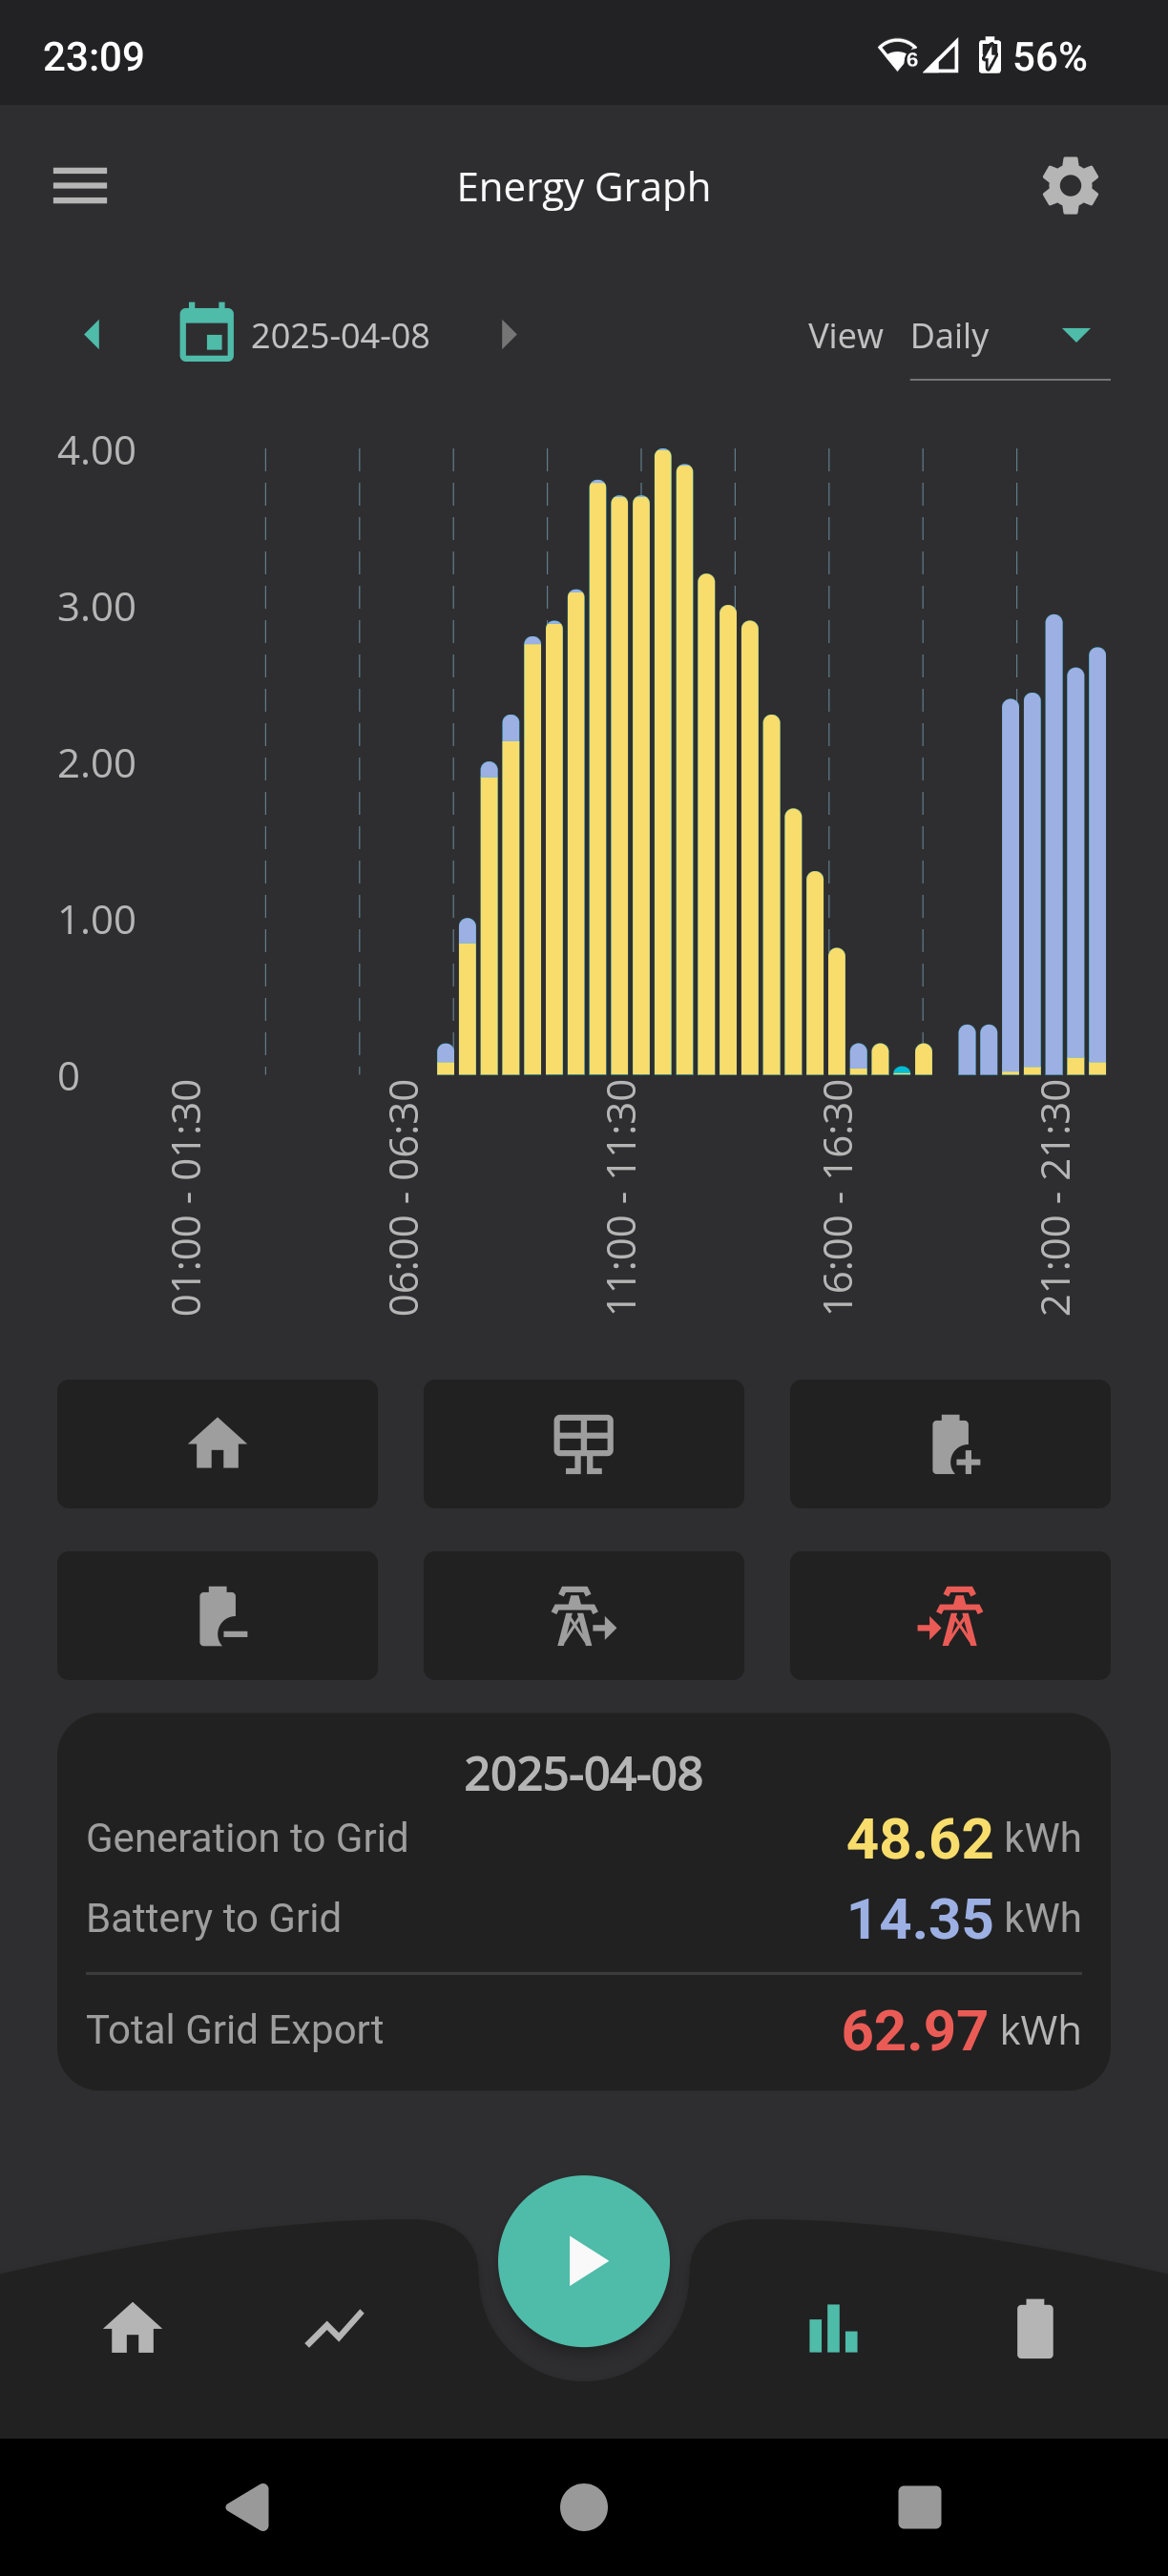
Graphs in app showing obscene numbers. Portal shows actual generation.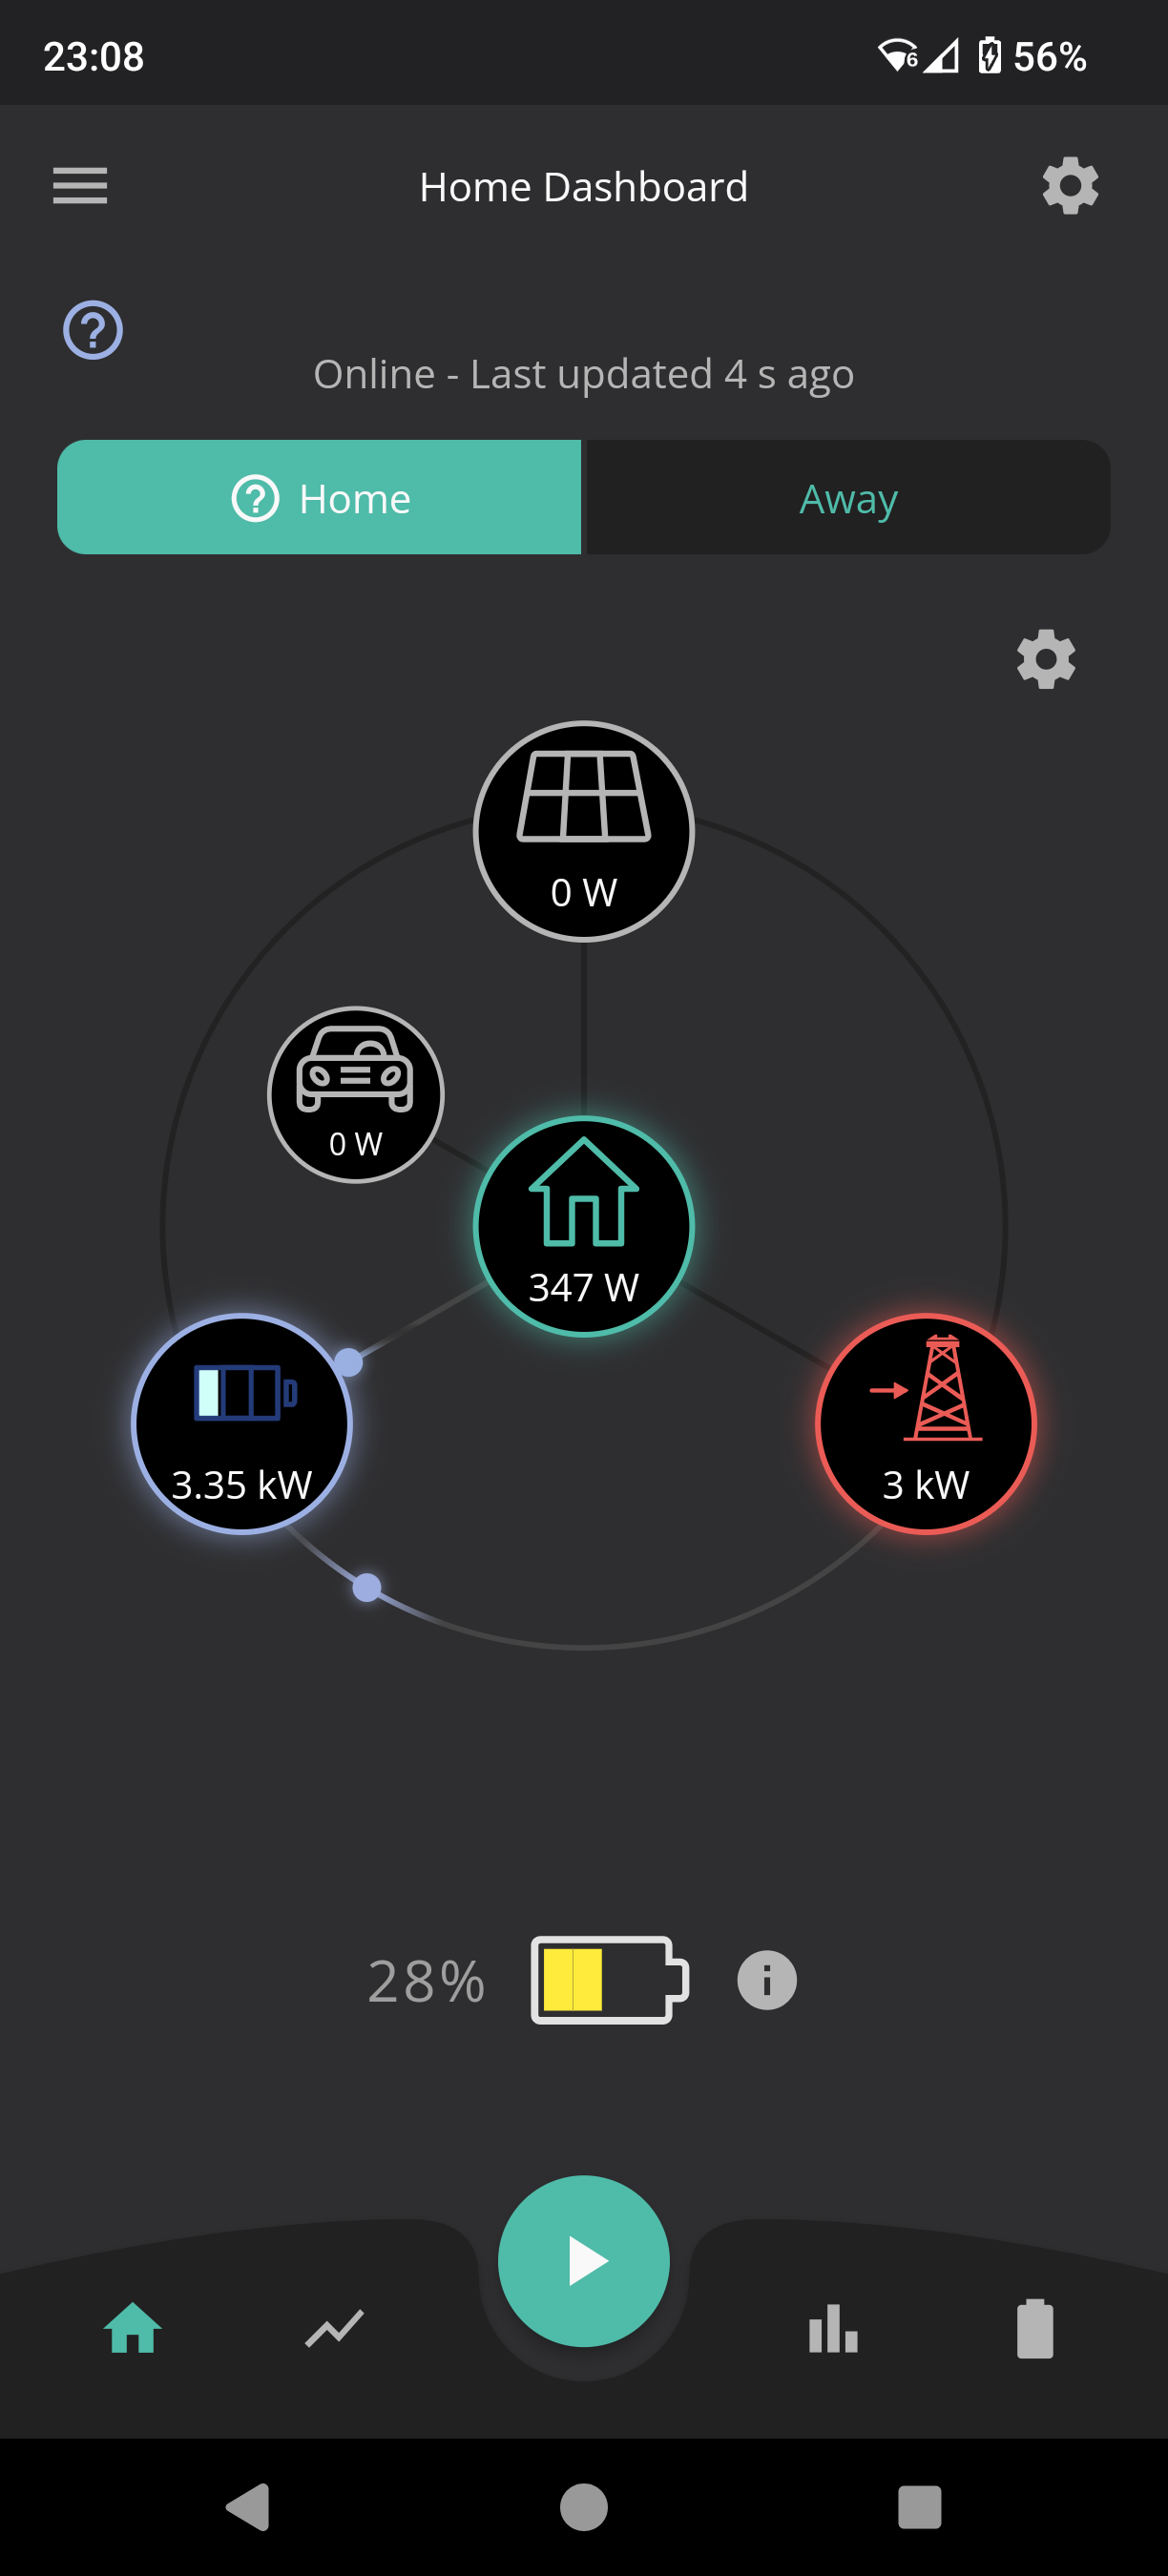
2nd edit.
I think I have figured out some the discrepancy.
The givenergy web portal seems to get it's data from the CT clamps and pulling the load value from the gateway load side. Which seems to be taking losses into consideration.
However the mobile app data isn't calculating house load off the c.t clamps / gateway data directly but instead just taking AIO output and removing the grid CT clamp value. Which results in a higher figure load in the givenergy app.
Thanks
Bob