Hi all
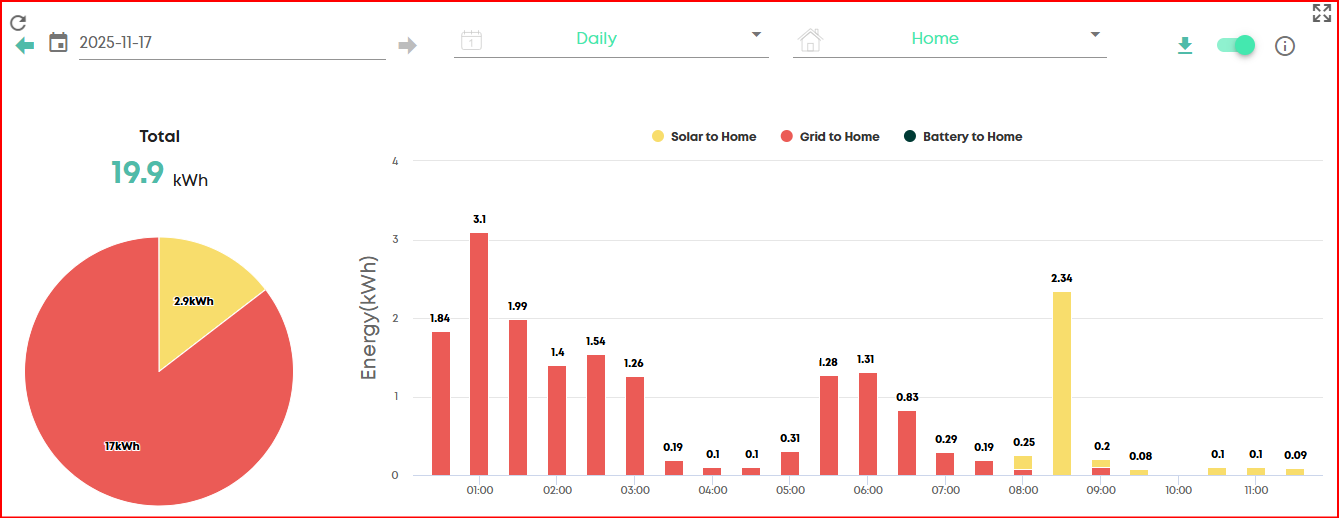
For several weeks I have been seeing a strange spike in solar generation displayed within my portal account. From time of day and orientation of my solar panels this generation is simply not possible.
Has anyone else experienced similar?
B
#2Backegg
Yes, same here. Massive solar generation at around 7am
T
#3TimHutchings
Same with me around 8am on a number of days, with many days last month and this month missing data too. Parts of the portal are working OK, other parts are missing the data.
T
#4TimHutchings
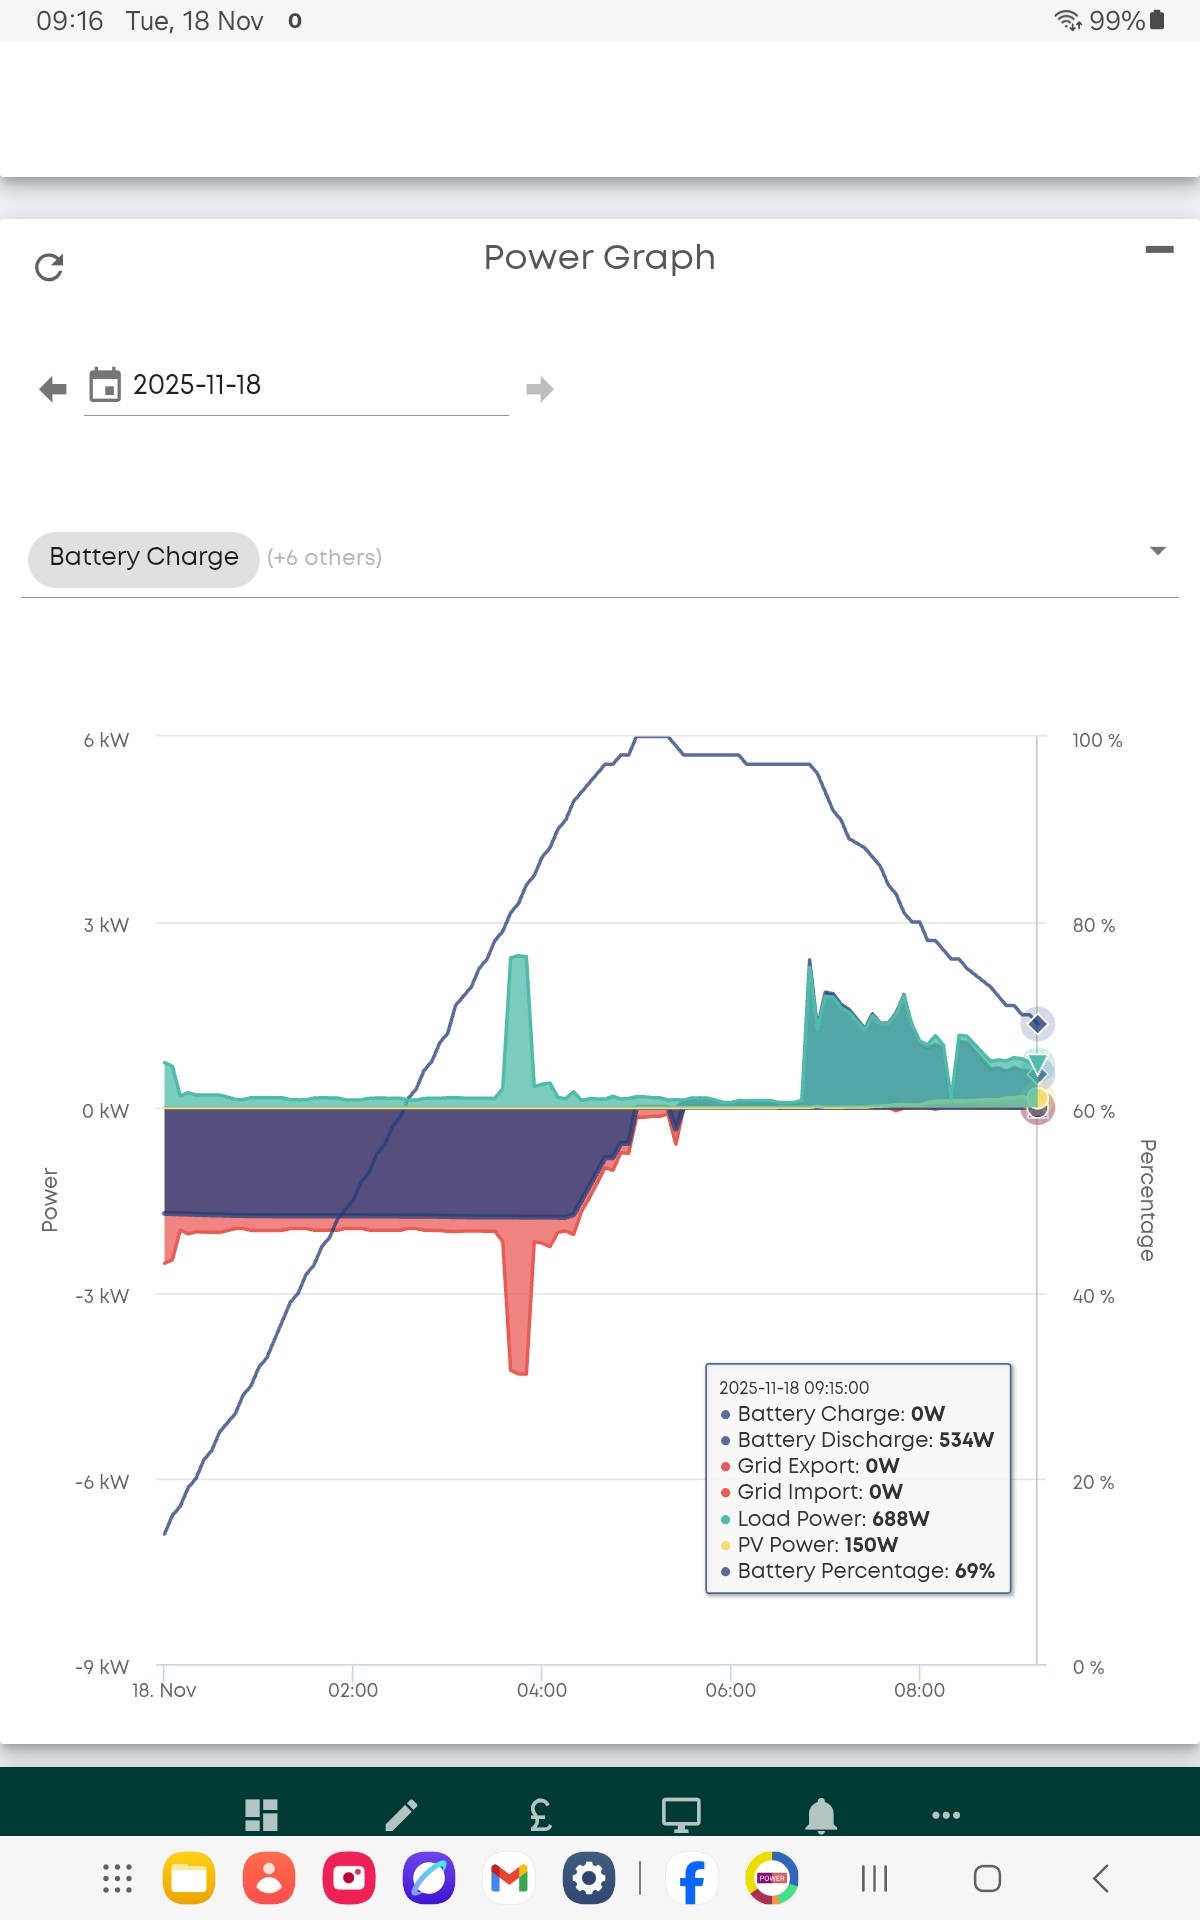
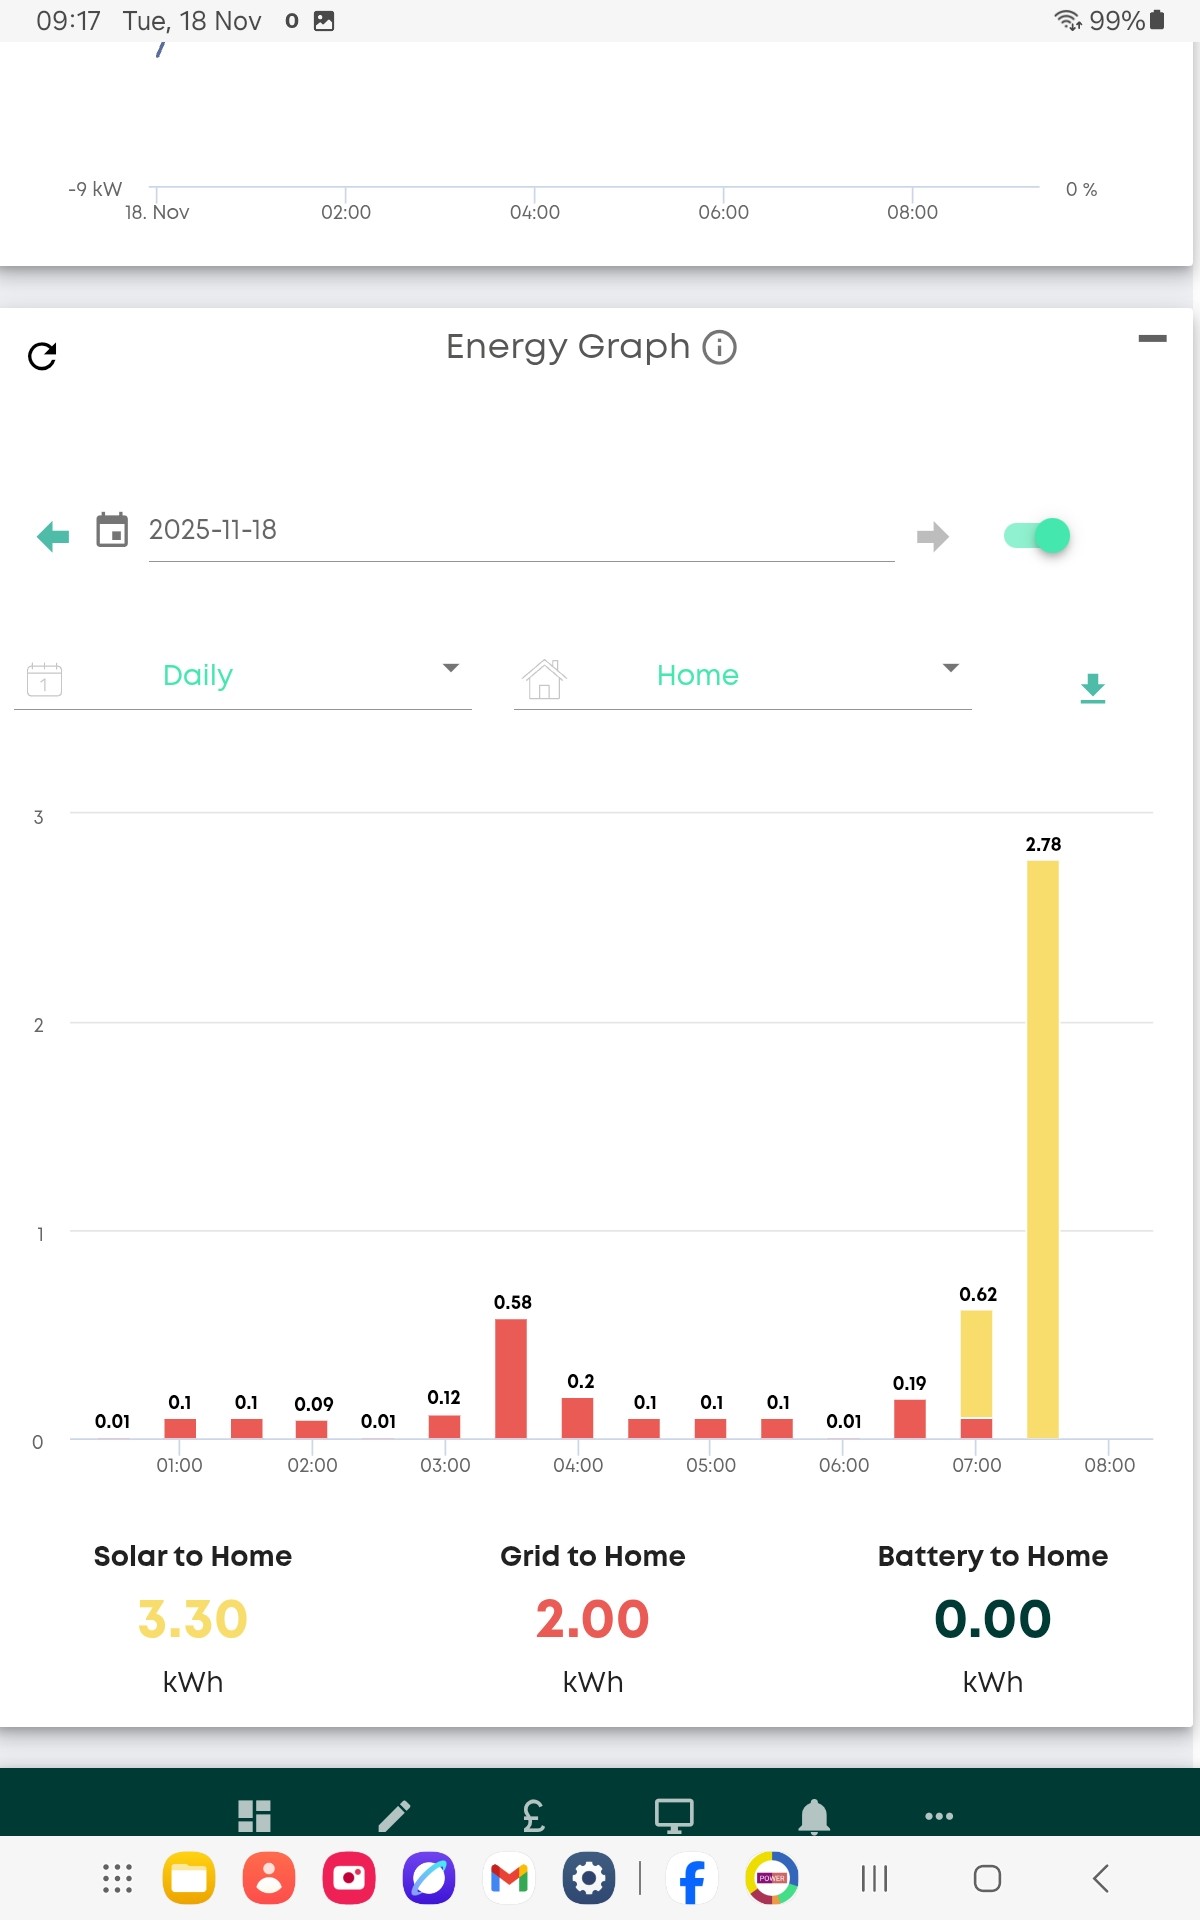
As per my previous comment, here are 2 screenshots of the portal taken at the same time. One is the portal Power graph from midnight to 9.15am which is correct. The second is from the portal Energy graph covering the same time period which is wildly out!
I'm on Intelligent Octopus Go and fill my 9.5kW battery overnight finishing at 5.30am, so I've imported around 10.4kW of electric and my solar generation is 0.2kW to 9.15am.
There appears to be a complete disconnect between the 2 graphs!
#5ChrisLav
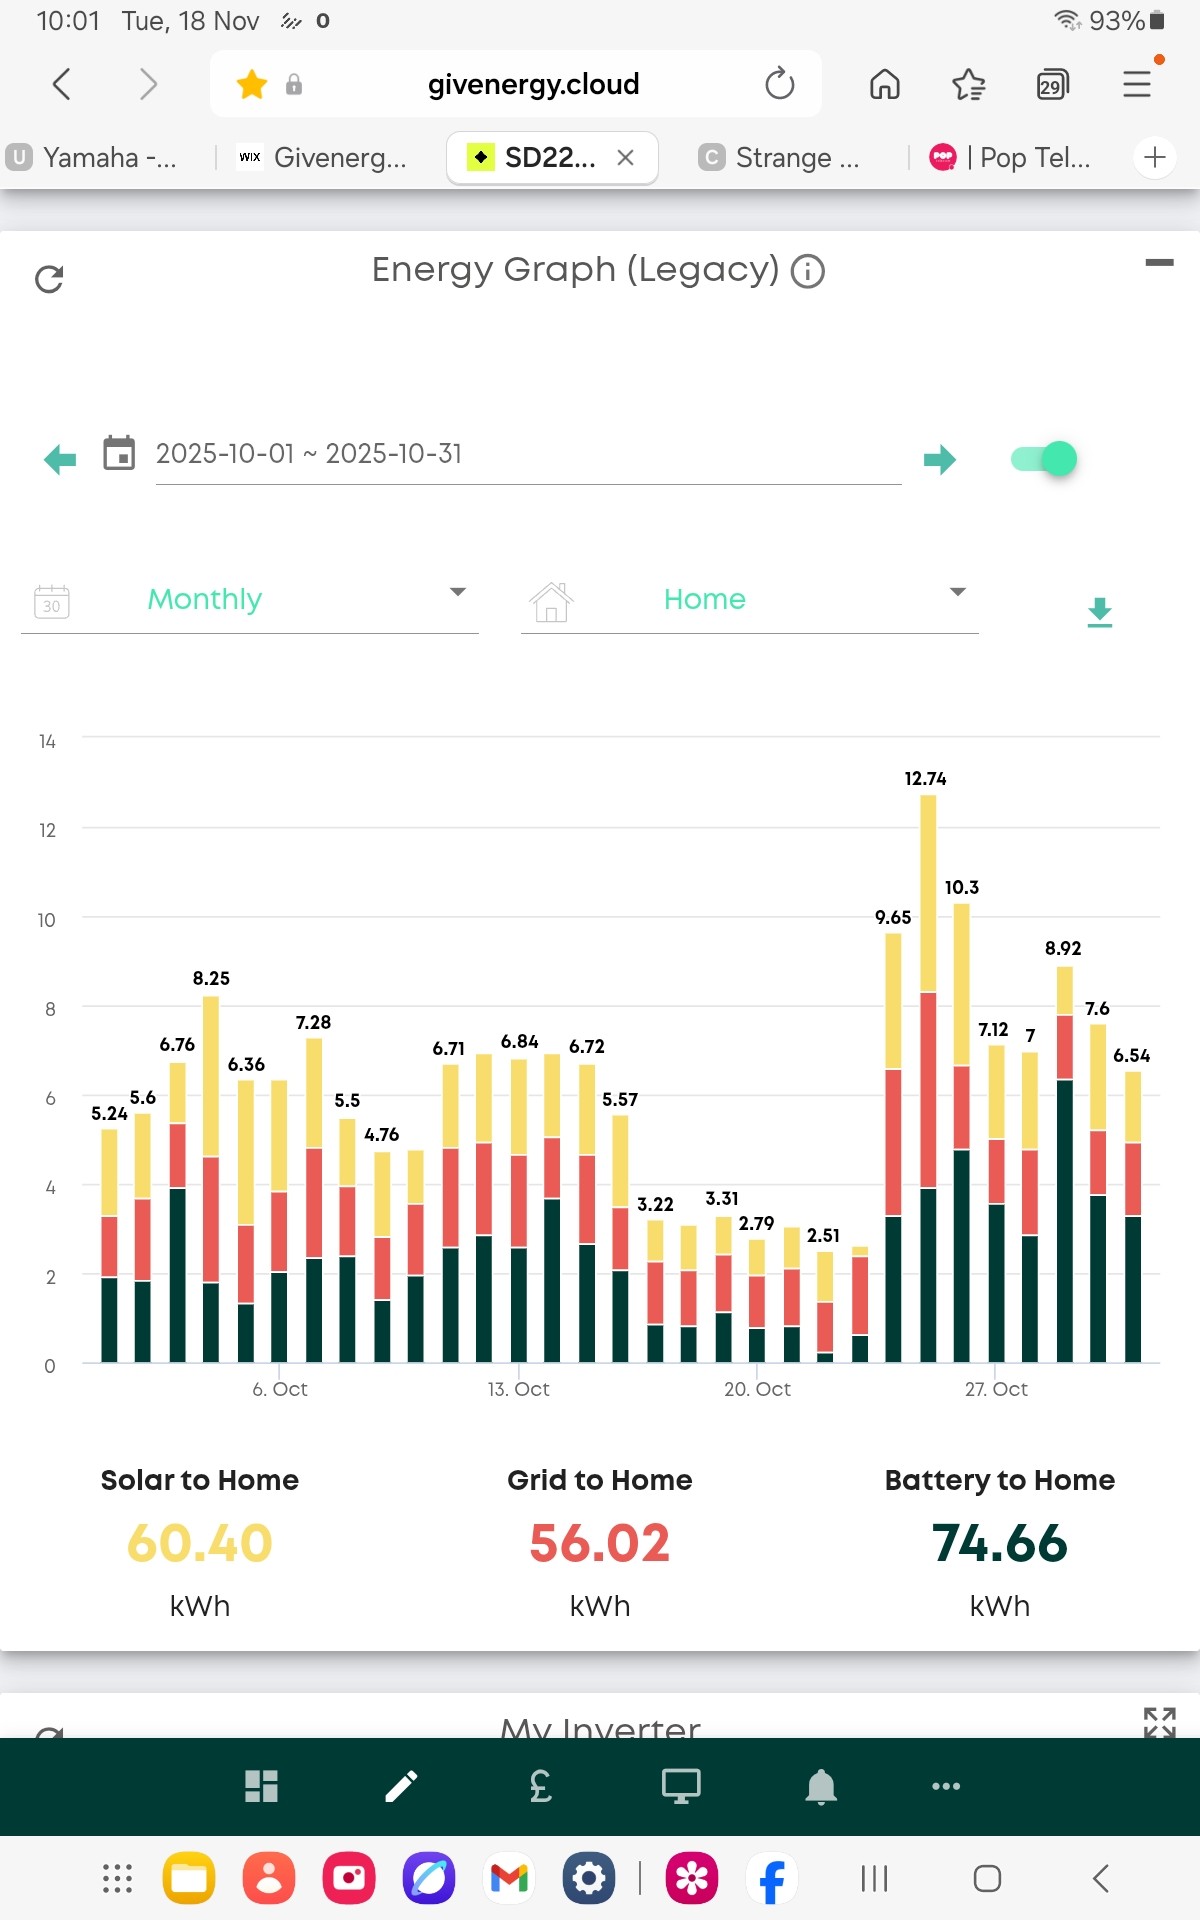
Try using the Energy Graph (Legacy). Its replacement has always given me dodgy data, so I never use it. The Legacy version matches pretty closely with the Octopus figures, so I use that instead. No idea why the non-Legacy version shows different data...
T
#6TimHutchings
Great spot!
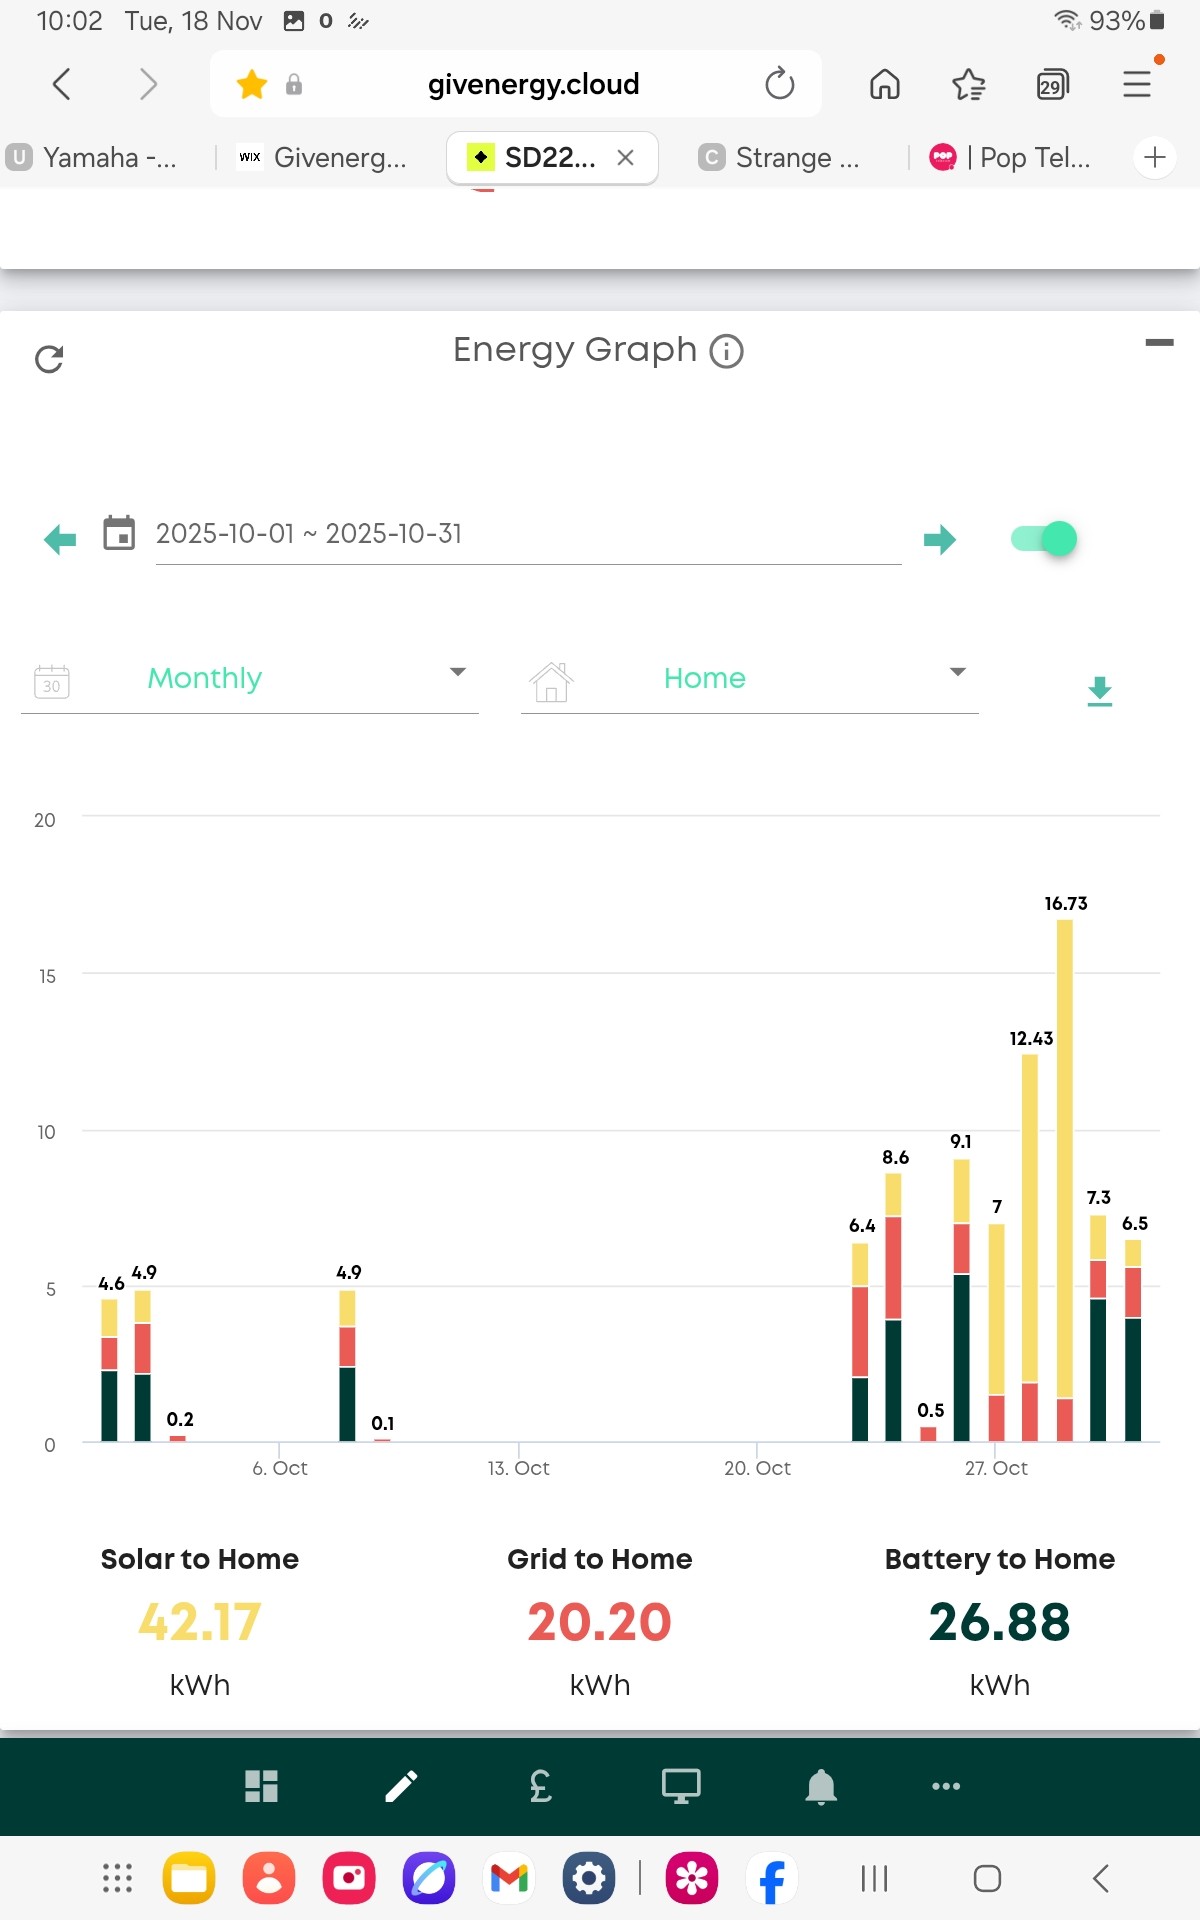
Below are screenshots of the two graphs for October showing great chunks of data missing on the new version, whereas the legacy version shows all the info. It's the same for this month too!
Problem is the app uses the new version so becomes useless, and the weekly and monthly reports use the new version data, so they are useless too!
#7ChrisLav
I hardly ever use the app. Weekly and monthly reports (if I need them) can be generated (and downloaded) directly from the portal using the Legacy version, and they always seem reasonably accurate (0.04 kWh discrepancy between GE and Octopus for November data so far; 0.05 for October). I just import the totals on the monthly download into a spreadsheet, tells me consumption, import and export totals, which keeps me happy...
T
#8TimHutchings
ChrisLav Thanks for the info Chris. I've just sent these graphs to GE in a follow up email I sent to them a week ago, after I actually got a response from them. Hopefully they can get it sorted.
I've just checked on the phone app. Monthly data on the Energy Graph is showing roughly the same as Octopus for every month July through to October (eg July Octopus import = 70.799 v GE app 70.9; export 428.784 v 430.2) so my app at least appears to be using accurate-ish data...
R
#11Rubikcube
RMoore Backegg
Does the peak coincide with using the GivEnergy app?
T
#12TimHutchings
ChrisLav
Interesting how your App Energy graph appears accurate. My App Energy graph for October mirrors exactly the new version Energy graph in the Portal.
If it mirrored the legacy Energy graph that would be great, as would the weekly and monthly reports.
Hopefully GE can sort it out. 🫣
T
#13TimHutchings
Rubikcube
Just like to say that your Inverter Monitor app has run perfectly for nearly 2 years now. No issues at all unlike the GE app.
#14ChrisLav
TimHutchings I'm running version 4.0.3 of the app. It doesn't mirror the portal legacy graph exactly, but within 1 or 2 kWh on the monthly data. July export is 430.2 on the app, 429.02 on the portal. Weekly app 85.5, portal 85.15...
S
#15Steve56
Yes my portal is showing very strange results. If I look at daily data for November each day is complete and seems correct. However if I then ask for the monthly summary many days are missing giving incorrect monthly totals.
T
#16TimHutchings
Steve56
Check it against the 'Legacy' Energy graph which is available by editing the main Portal page as an extra card/tab. Even the daily totals are out! I've had solar generation spikes of 8 or 10kW at around 8am on some mornings which is impossible. Problem is that the app and reports all use the same data, so they're all unusable as they're so inaccurate.
The Legacy graph has all the data on it and matches pretty much the meter data.
N
#17NethyDebbie
Yes, I have this too. Huge wierd generation spikes showing at 3am or other such impossible times. For the last few weeks.