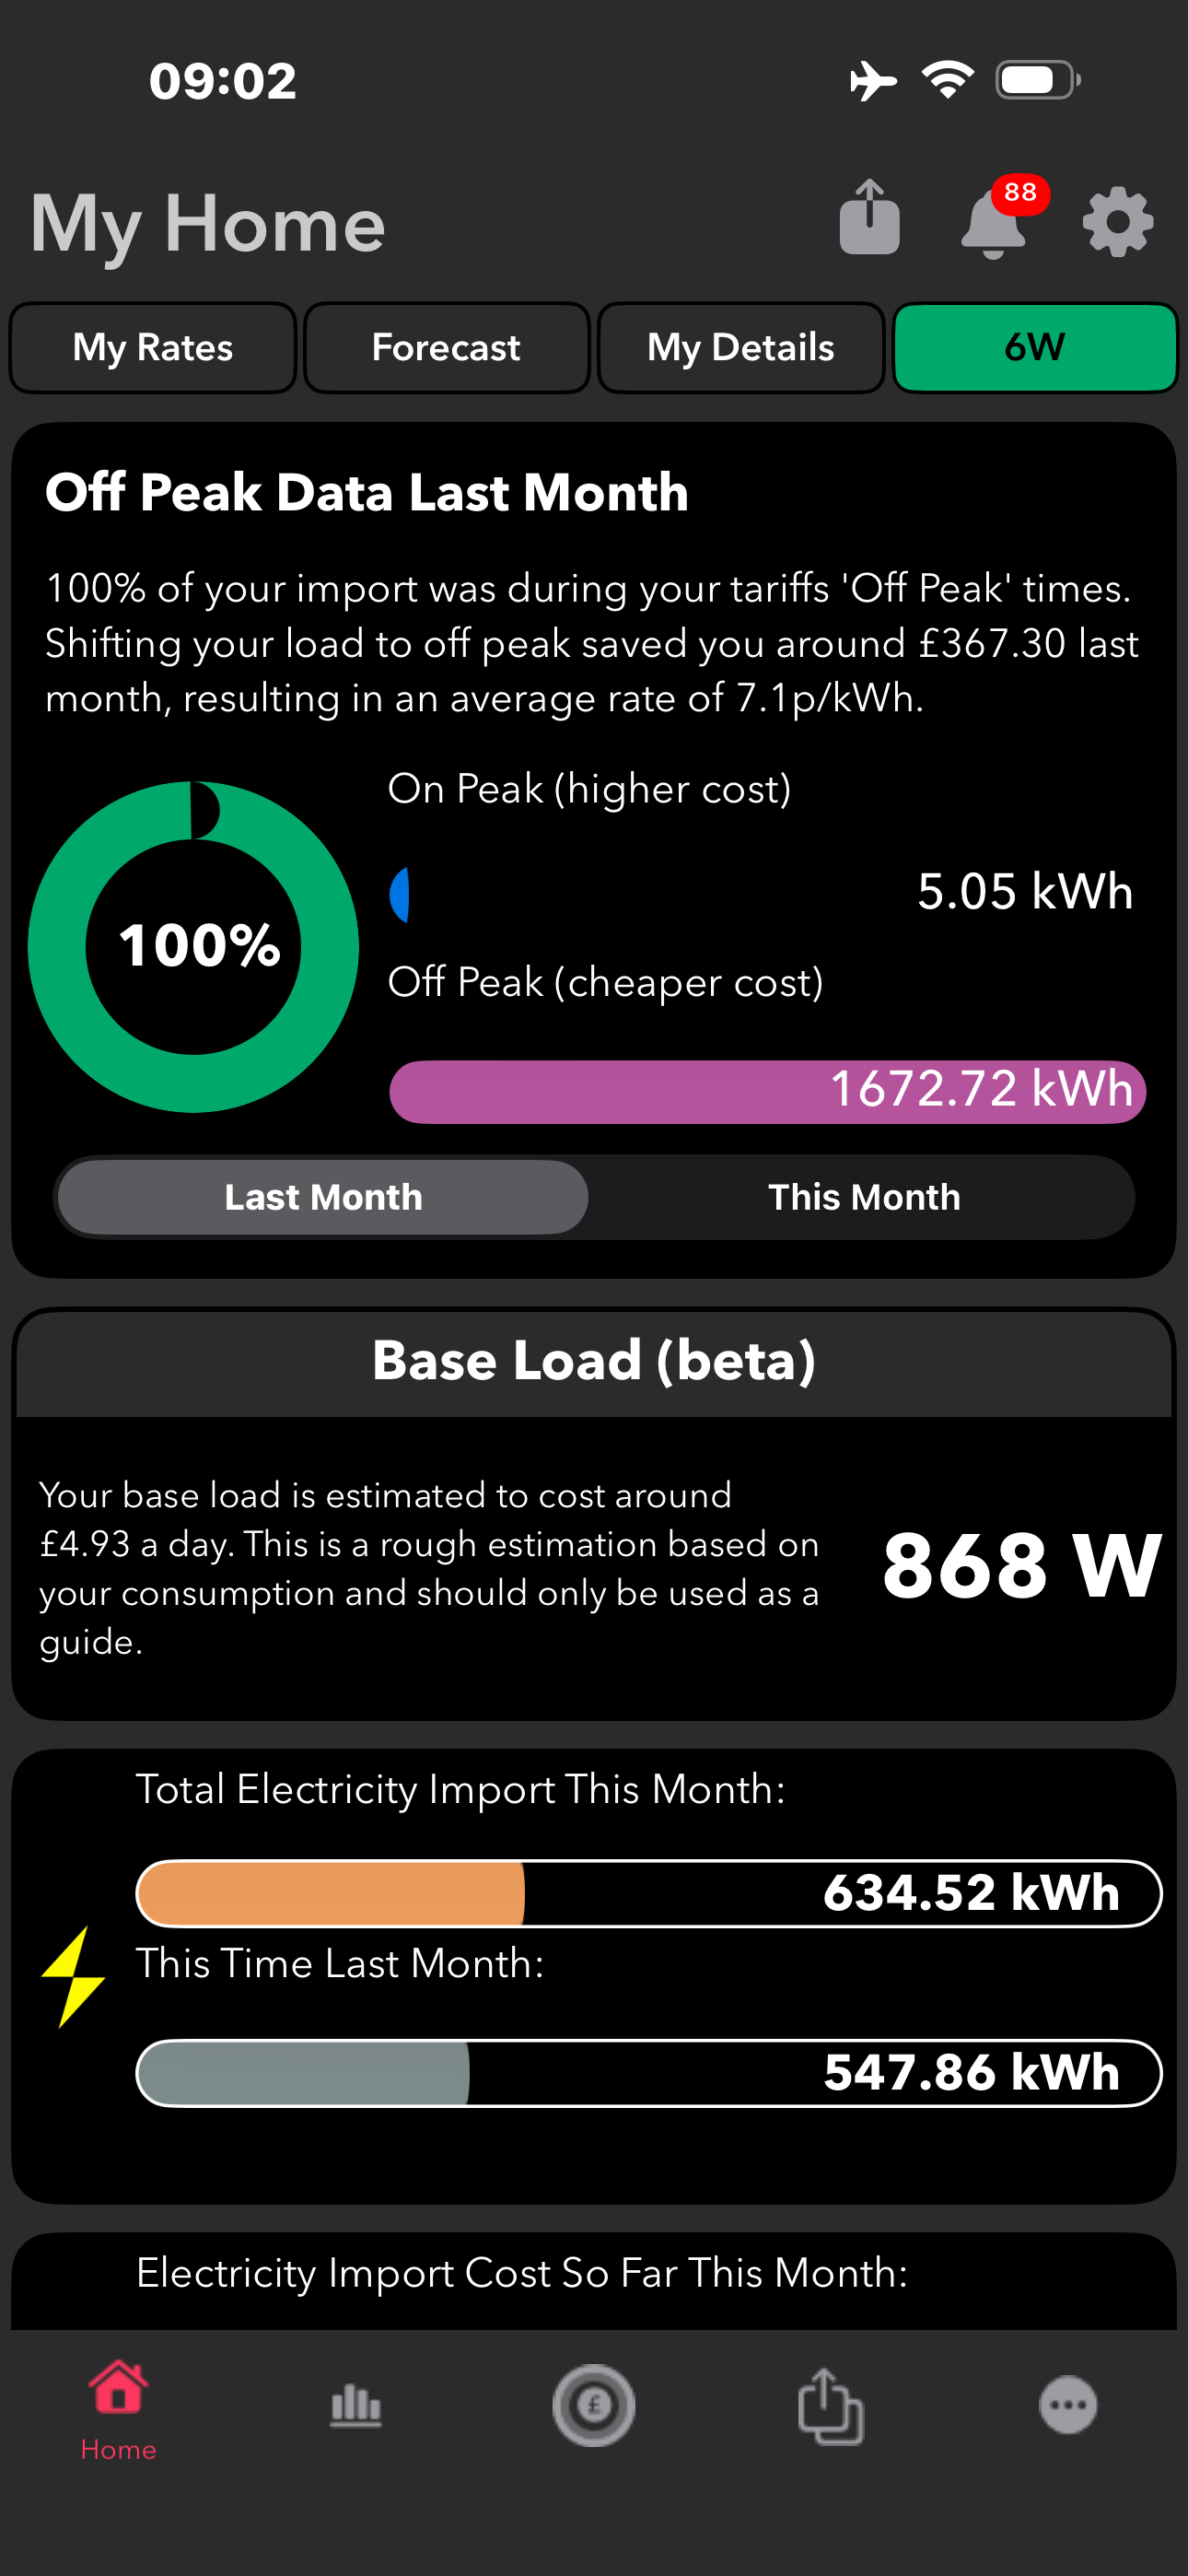
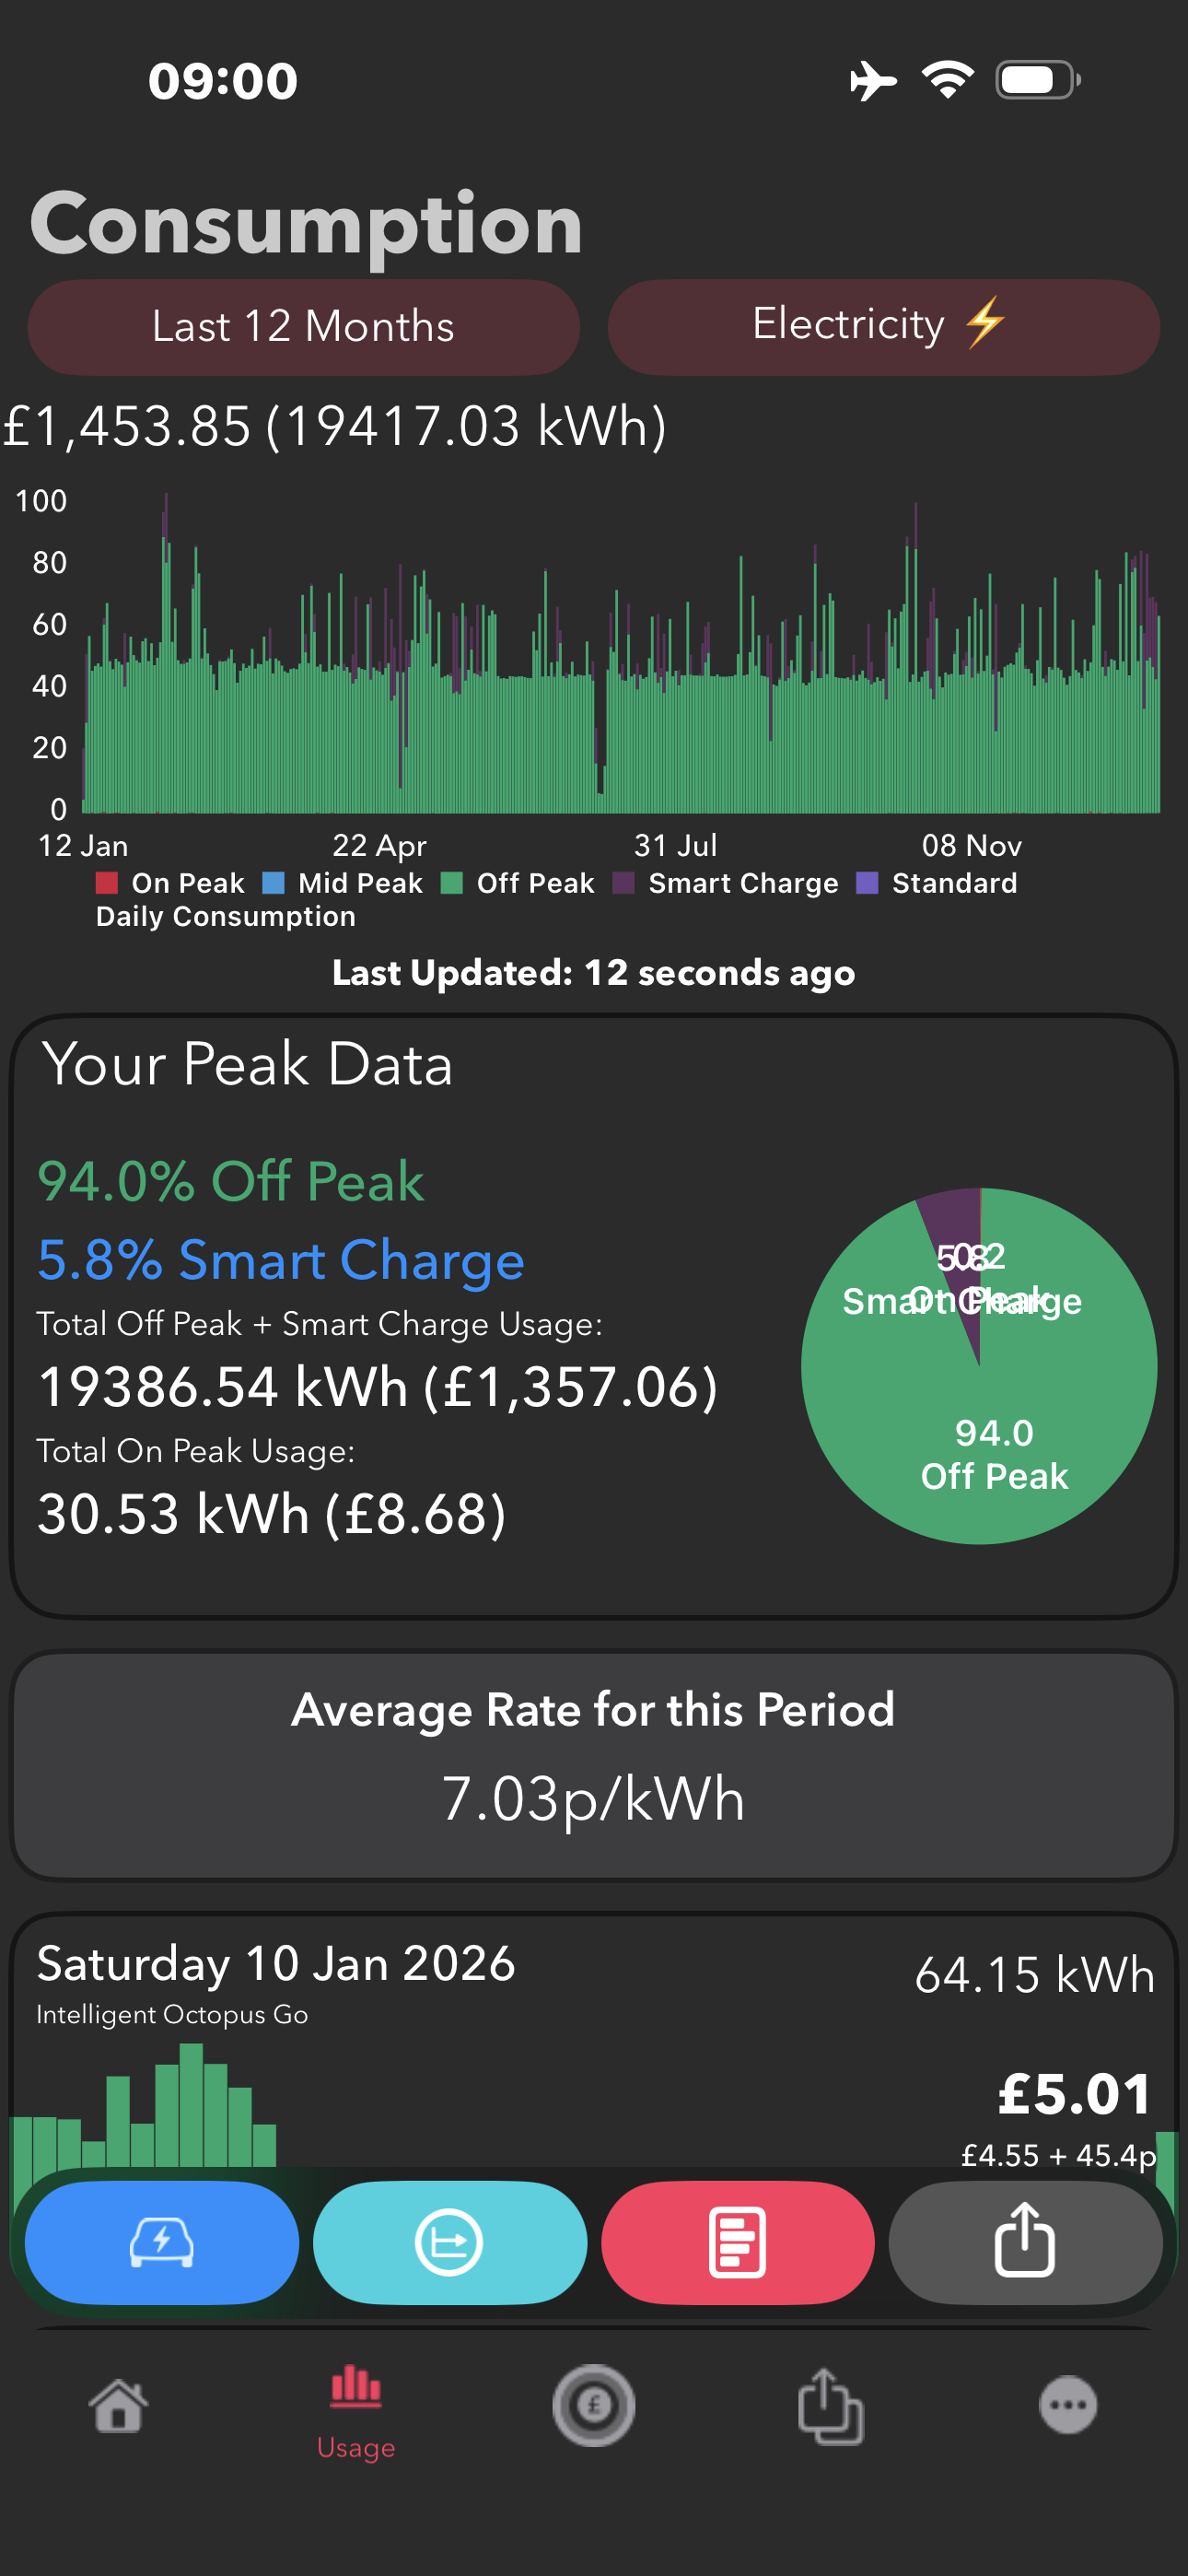
20 month stats / EOY 2025

13 comments started 2025-12-20 last 2026-01-12
GivEnergy ProductsHybridBattery
W
#1 wrighar

I dropped these on Facebook earlier, but thought I'd re-post here:

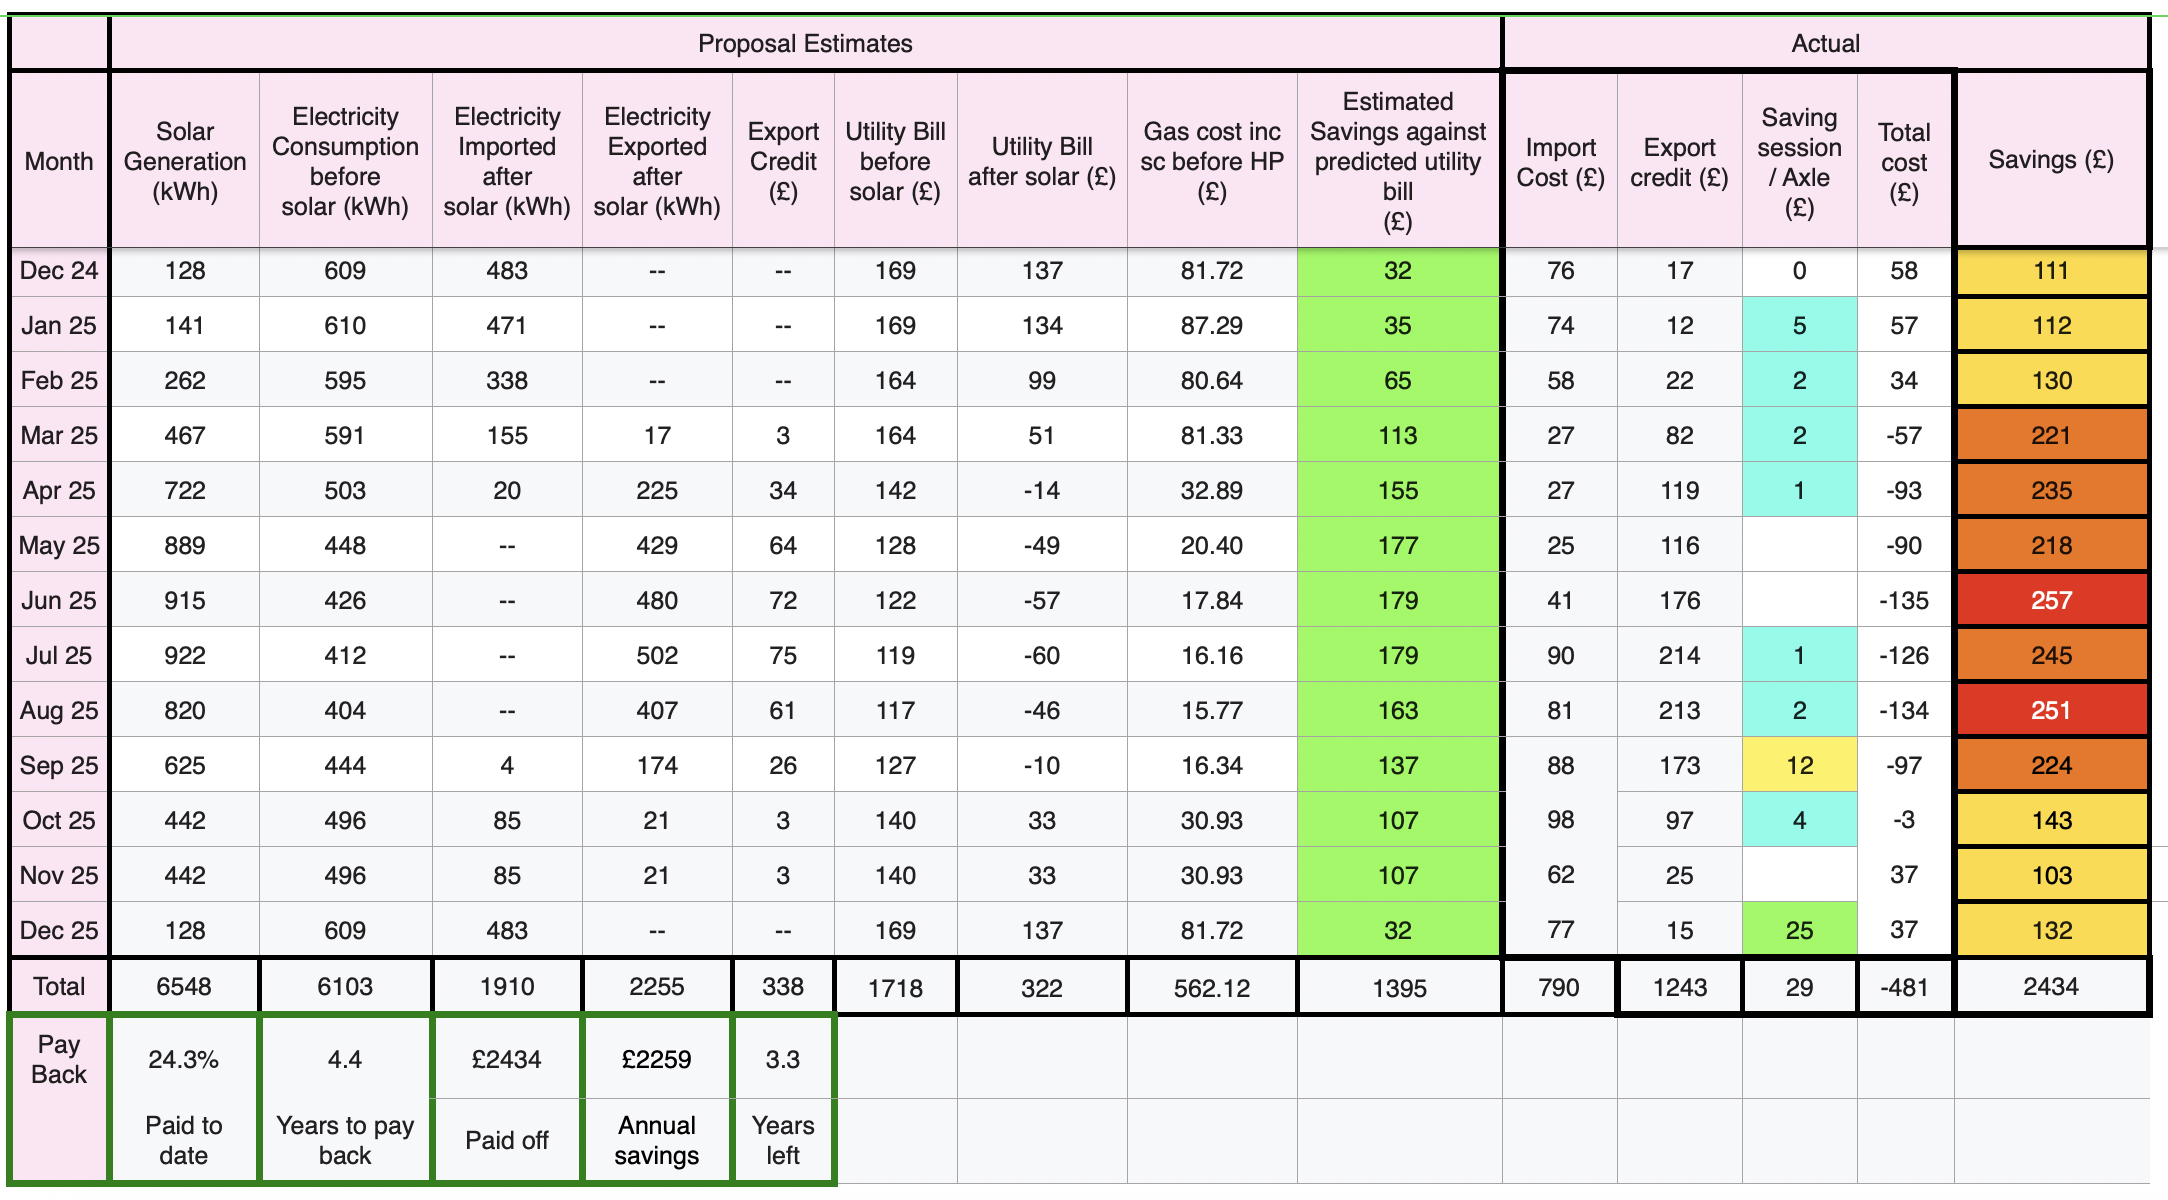
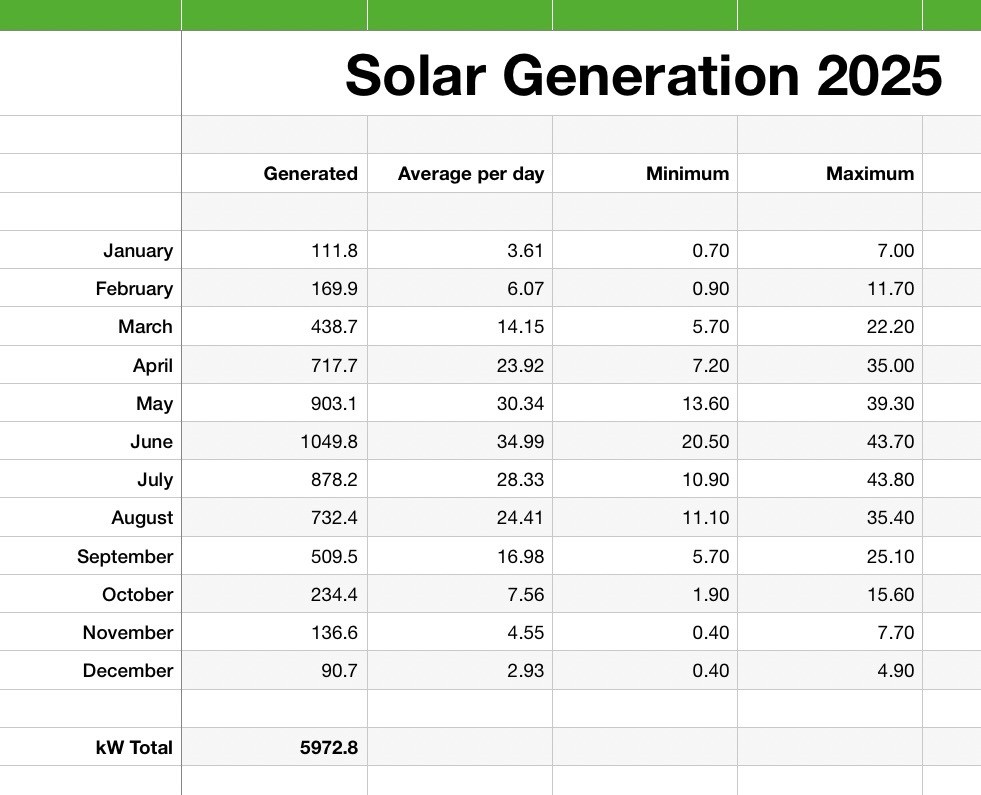
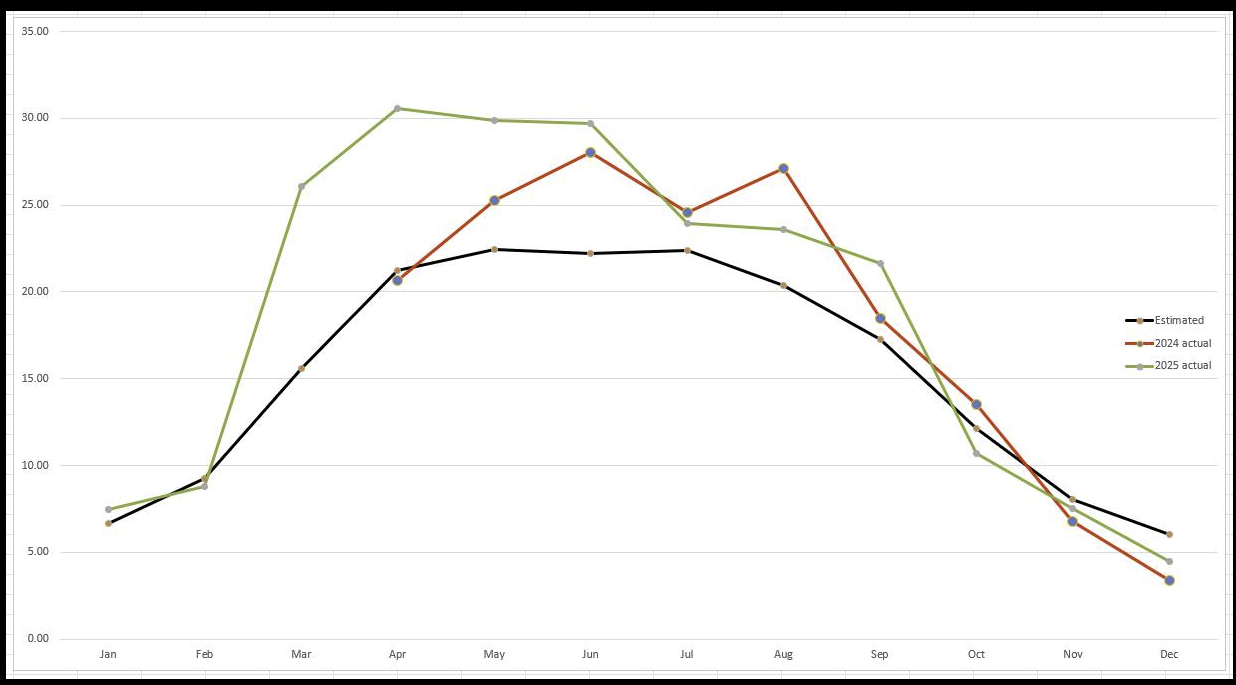
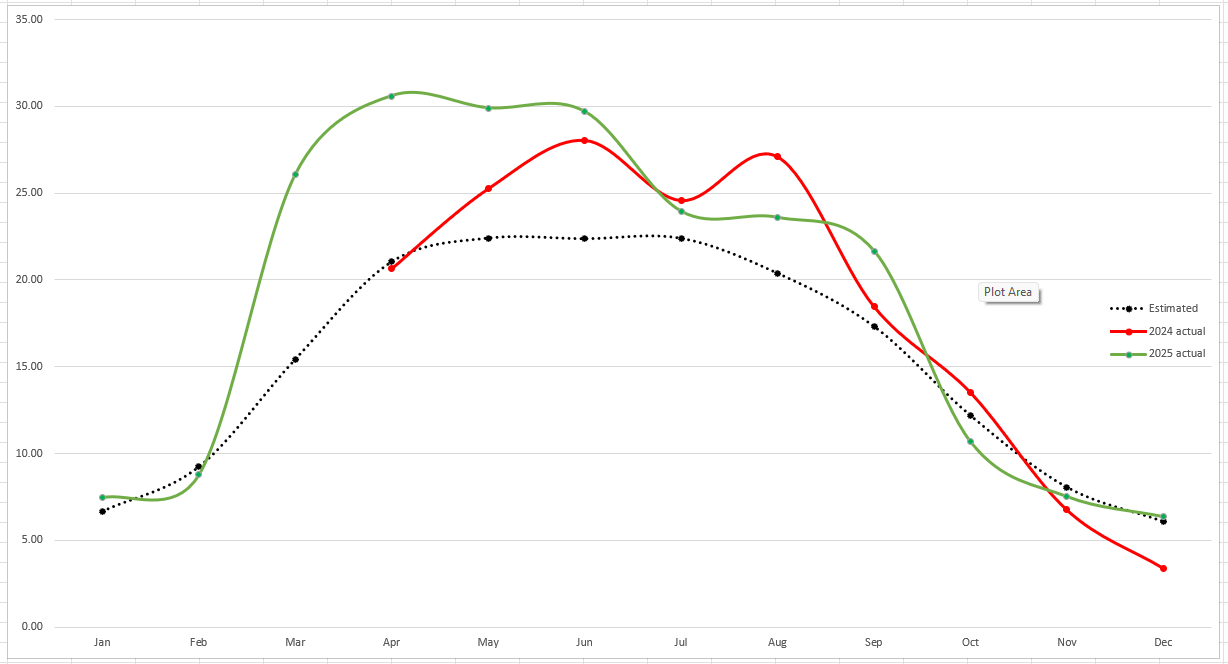
It's close to the EoY, so I've started to look at my daily average kWh generation over the last 20 months vs the estimate I got when quoted for the system:
It's done rather well, and even the months it's not met quoted estimates, it's been pretty darn close.
Give it some summer sun and it's well away!

I may have complained that Aug 2025 was poor compared to 2024, but both were above quote predictions.
G
#2 geoffreycoan

wrighar Good results

I’ve just looked at my own quote and it didn’t have a generation breakdown by month, only an annual figure, decreasing by 1% per year due to degradation, and payback based on exporting 50% of the solar generated and paying 5.5p/kWh.

Year 1 forecast was 7935kWh generated, 3967kWh exported for £218.

Actual year 1 (2023) result was 7595kWh generated, 2895kWh exported for £216
2024 7588kWh generated, 5452kWh exported for £819
2025 YTD 8239kWh generated, 5447kWh exported also for £819

So generally slightly under achieved the predicted generation but significantly over-achieved the export and export income. Year 1 I didn’t signup to an export MPAN until August so hence the much lower income.

The installer prediction was break even at 11 years, I am on track to break even in 7, and that’s after the cost of adding an additional 9.5 battery and then having to replace it ‘cause I broke it so would probably have been about 5 years on the original spend.

W
#3 wrighar

I was only given an annual figure of 5689kWh from 6.020kWp system and some season sun path sweeps.
I then used PVGIS to get a month by month figure for location direction and attitude to give 5689kWh annually

With IOF in summer and Cosy or Go in winter I should see a 4.5 yr payback

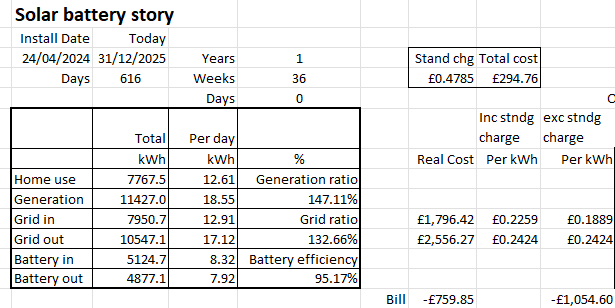
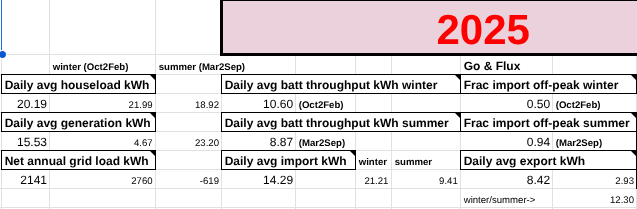
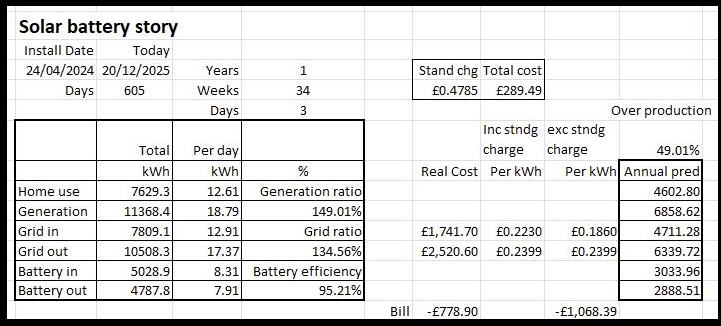
20 months in and 40.6% paid back (49.3 months est) if I exclude standing charge, or 37.6% if I include it (53.2months est).

W
#4 wrighar

Going to call it a year now, suns gone down.
6894kWh generated
1205kWh over our pre-sales estimates
6kWp system, 5Kwh inverter and a single 9.5kW battery
Average kWh import price 18.89p
Average kWh export price 24.24p
Using most of the battery every day, sometime we run out around 10pm, other days we have 30% left
Just hit the 10MWh battery throughput today, only 85MWh/10.3yrs left on the warranty....


G
#5 geoffreycoan

I’ve not got my Octopus bill yet, so figures taken from the app and home assistant:

2025 solar generation was 10% up on previous years, reaching 11,688kWh.

Heat pump consumption down 5% at 4, 200 kWh, house consumption down by 12% to 6,300kWh which together reduced my import to 7,000 kWh (£997). Export almost identical to previous years at 7,500 kWh (£1125).
Average import rate 14.23p. Average export 15.02p.

Key figure is my annual electricity consumption bill (excluding standing charge) which was my best yet at -£128, saving £2,820 off what I’d have been spending on SVR giving me a payback for the GivEnergy kit of 7 years.

With my March 2026 payment my FIT solar panels will have been fully paid back, that has taken 10 years.

L
#6 Leeshore

geoffreycoan one thing I would say is that basing savings on the SVR is to a point not accurate. What I do is base it on what I and you would have done without solar ie look at the cheapest fixed rates every year.

G
#7 geoffreycoan

Leeshore Its a fair point, comparing it to SVR is easy because the data is readily available. Comparing to fixed rates would require more work to search and record rates.

Its further artificial because I had a 4kW FIT array installed in 2016 and then the 10.4kW GivEnergy arrays installed in 2023 but my solar generation and thus import and export costs include both the FIT and GivEnergy arrays. I'm not going to try to work out what just the GivEnergy contributes, way too hard!
On the FIT array I am only counting the FIT generation payments in that payback so I'm not double counting at least.
And I don't include standing order in my payback as I figure I'd be paying standing order regardless and whilst it does vary slightly by tariff, in the grand scheme of things, its not a big difference. Again, trying to keep it simple.

H
#8 Henry3rd


I'm pleased with this, given that we were sold the system on the basis of a 7 year payback

W
#9 wrighar

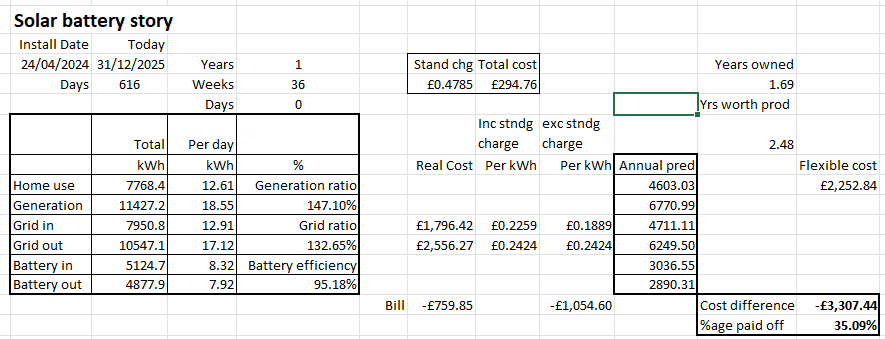
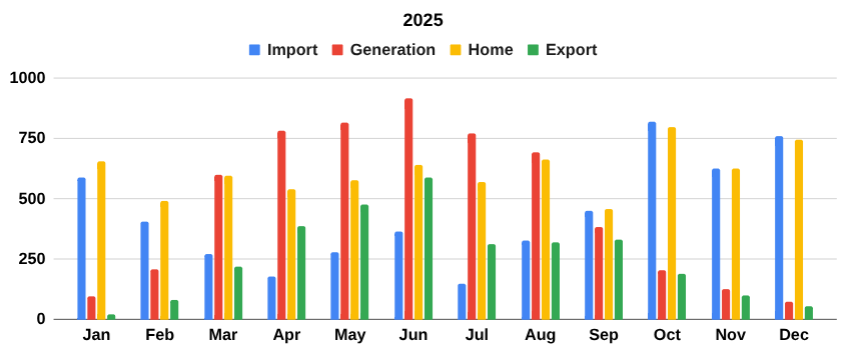
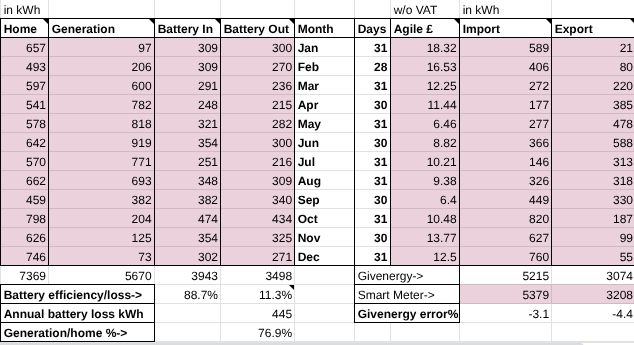
yes, mine has some columns I normall don't show:

Roughly £3,300 of saving for me in 1y8m

C
#10 CW

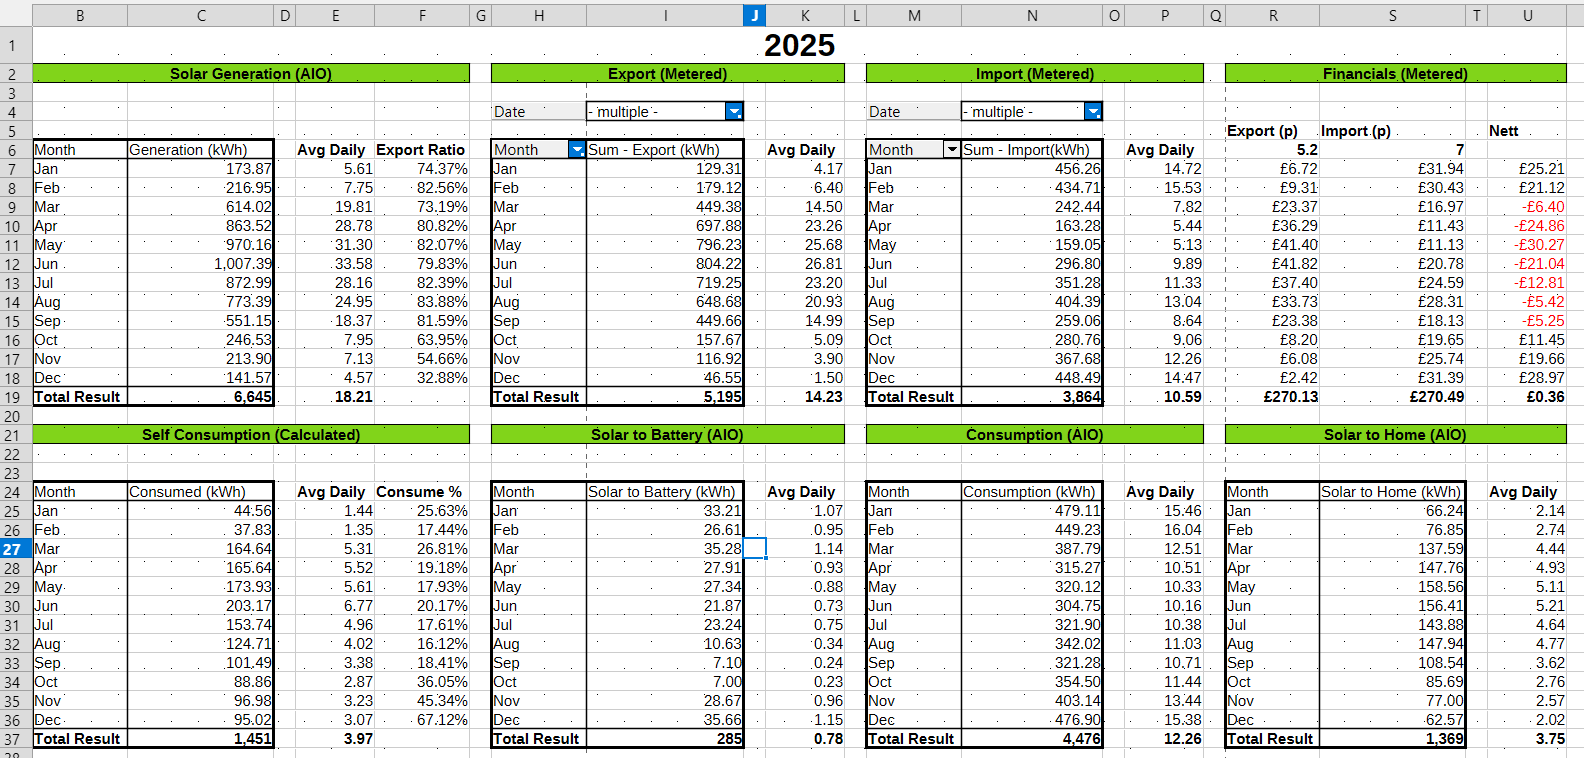
Here are my figures for 2025 (first full year of solar)
AIO figures are taken from the GE web portal.
Metered figures are taken from the DCC (via Glow for Homes)
Financials are for me to see how low an export price goes before I start paying again for electric (SC notwithstanding)
Self consumption is calculated as Solar Generation - Export

R
#11 Rubikcube

Great to see all the effort various people put into their spreadsheets / graphs.

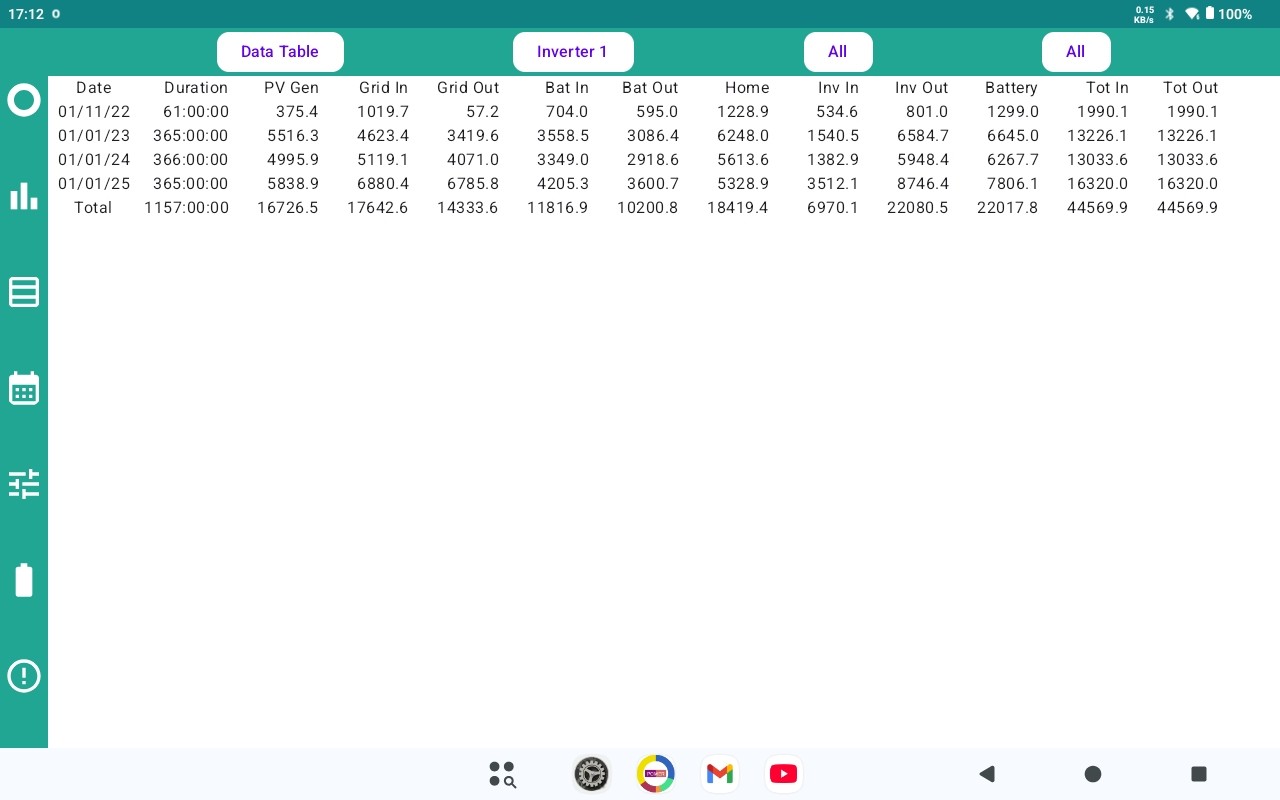
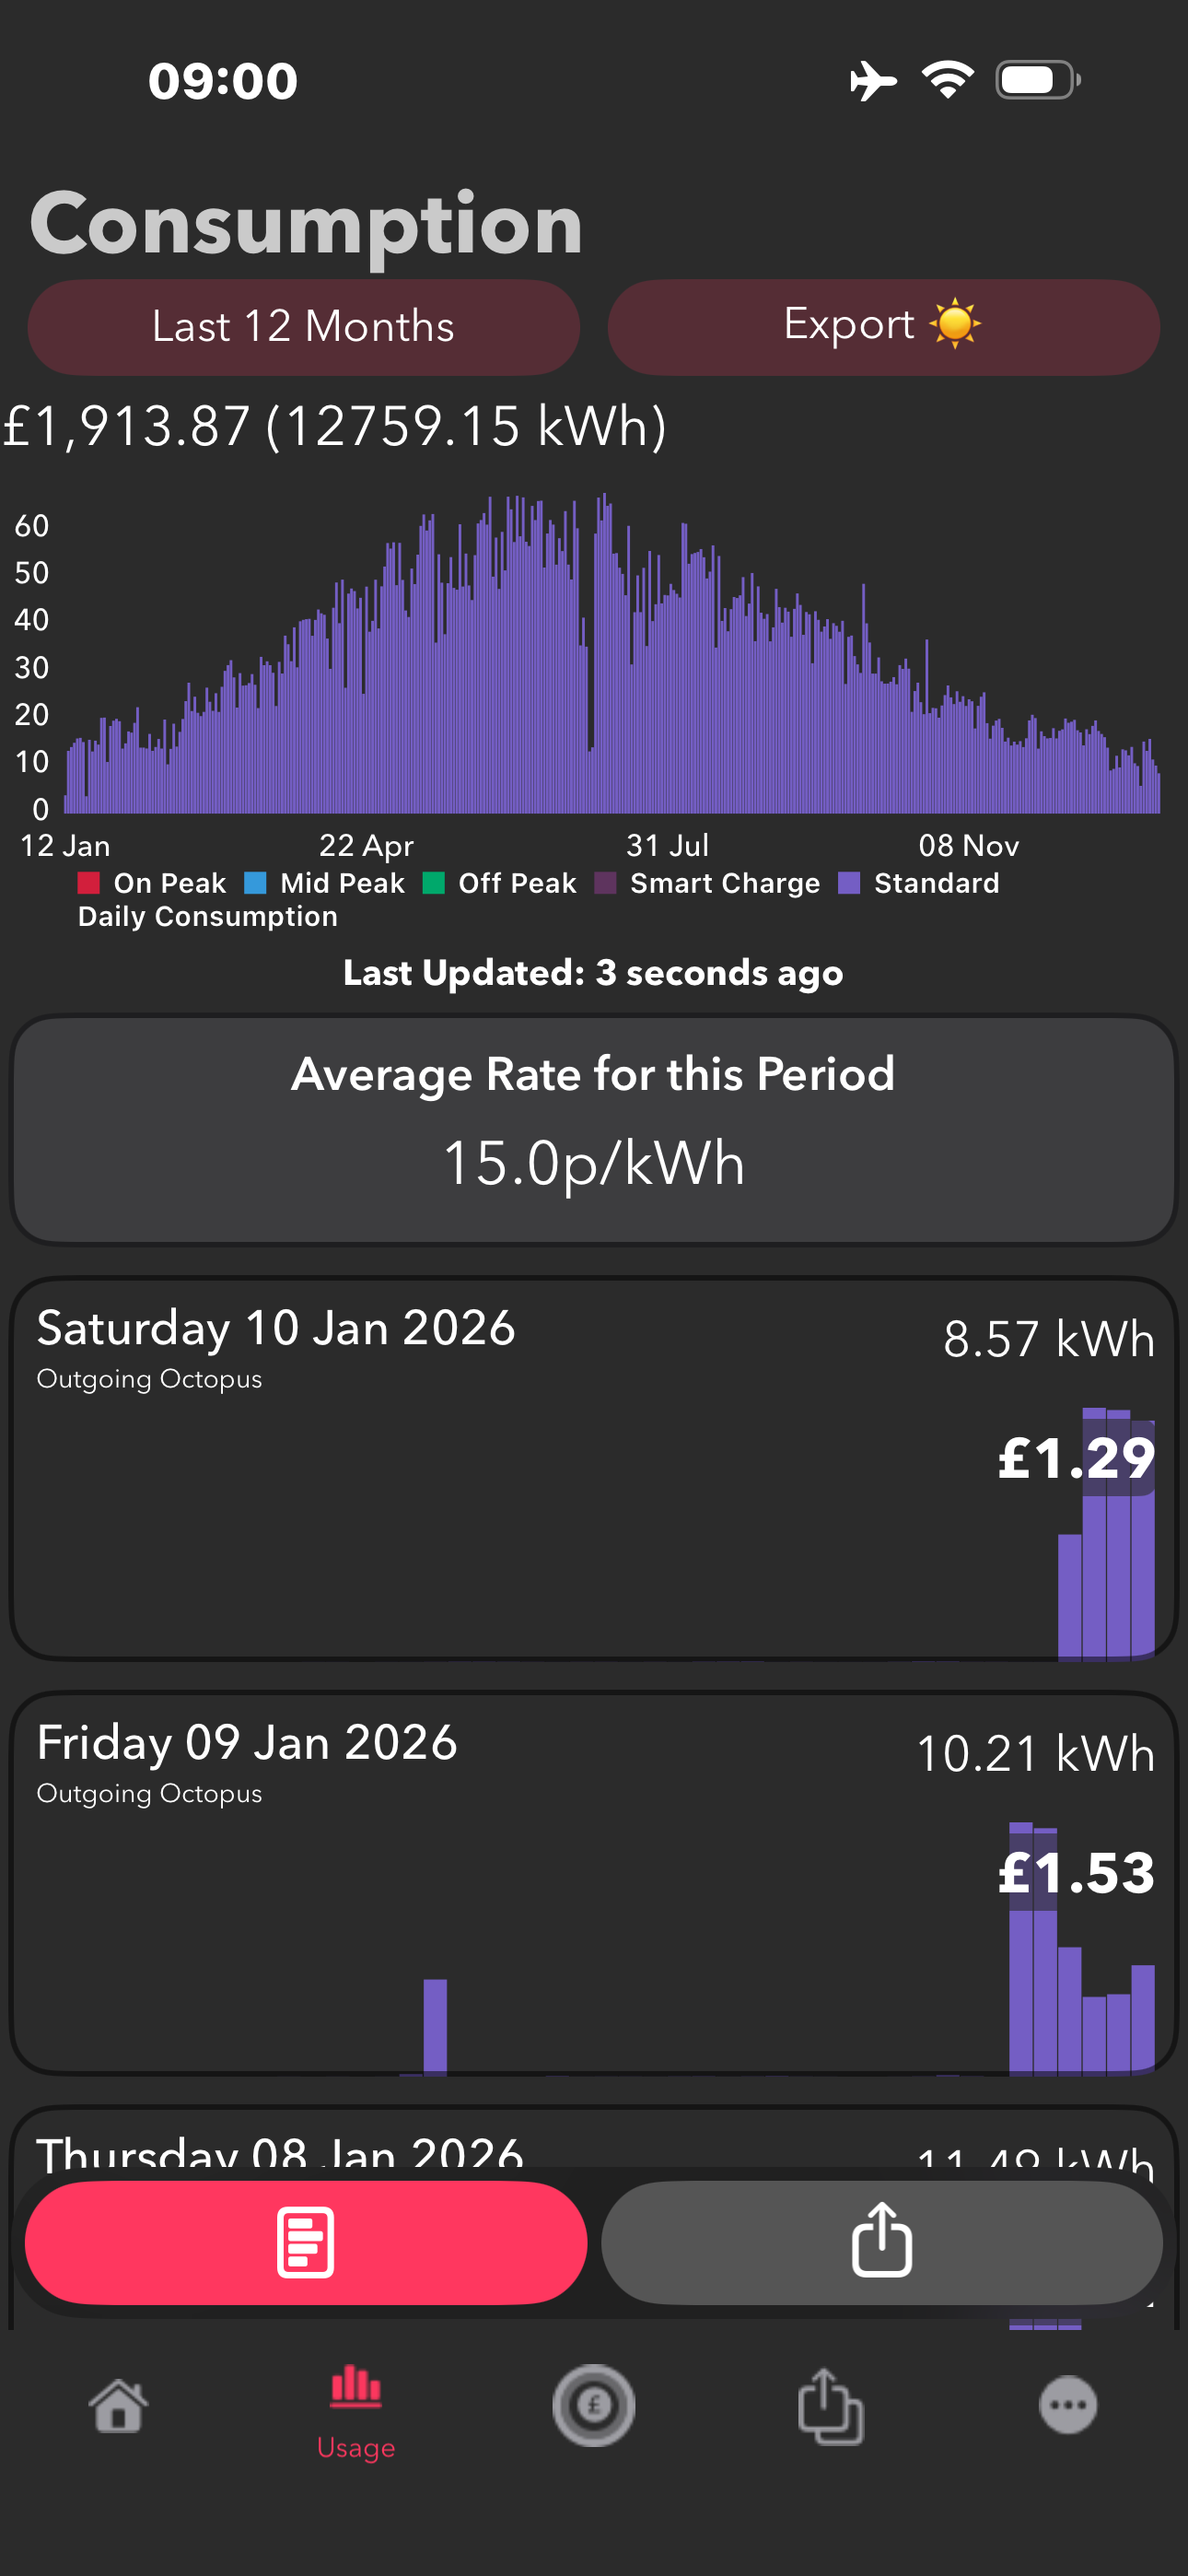
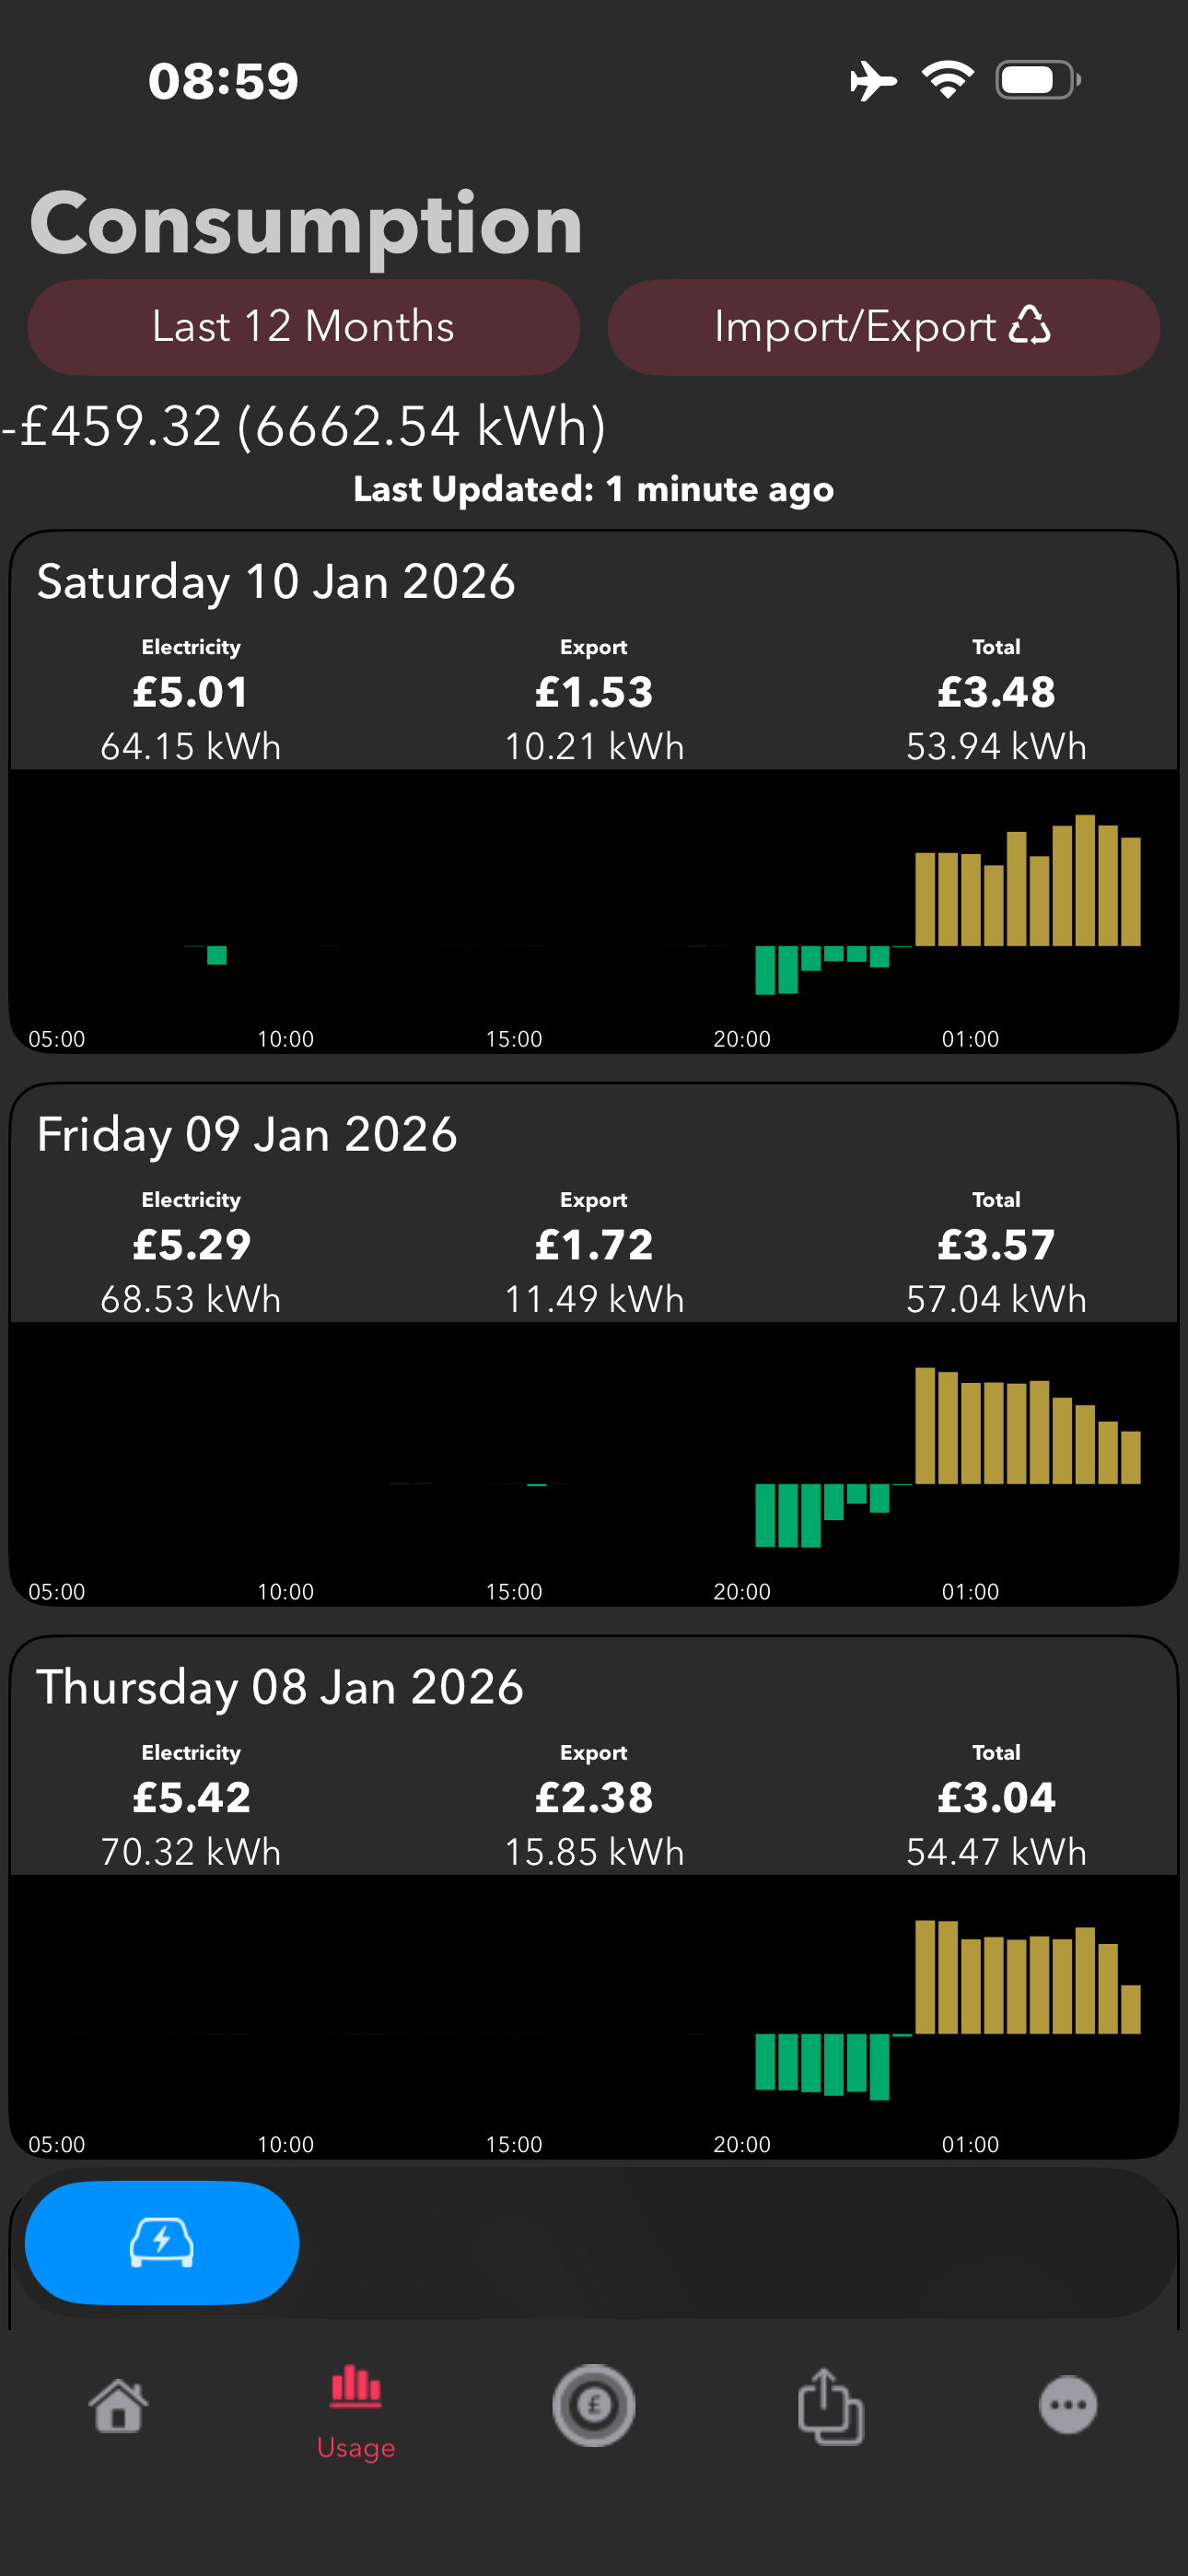
Here are my figures so far (just over 3 years) from my own app. Produced on a Teclast P60 with default display (font size) settings.

P
#12 Pete UK

Just under 6,000kWh for me in 2025.

Elec bill: -£460
Gas bill: +£2,000


#13 Windy Miller

6.7kWp array
2x 5.2kWh batteries.

Electric import cost £893
Electric export gain -£507
Net £386
Annual savings £1170
Payback time 12.5 years
Gas cost £720