
No solar production on Energy Graphs??

18 comments started 2025-11-13 last 2025-12-14
Mobile AppGivEnergy ProductsHybrid
A
#1 Arron

Got an odd one this week, in the app and on the portal our solar array appears to be producing no energy under the energy graph section despite there clearly being some throughout the day in the power graph tab/page.

I can see that we've had production in other monitoring locations such as Home Assistant, just not the native app and web portal??

Weather has been poor, but not 0.0kwh poor. 5 days now the app says 0.0 in the energy graph tab, any ideas anyone? I've tried clearing cache/data on the app and signing back in again.
T
#2 TimHutchings

My app a couple of days ago was showing a spike of double my solar array at 8am (impossible) and virtually nothing rest of the day. Today, the portal is showing 0.7kw solar - app showing 6.17kw! It's been raining all day! Last month the app Energy graph is missing around 10 days of data. At the moment the app is useless!
They need to sort it out!

#3 26Left

Same here ie opposite problem to the post title - from the 5th to 10th Nov my app energy graph is showing increasing, erroneous spikes of solar generation in mid morning and grid export spikes in the small hours, making the data presented useless and unreliable.

A
#4 Arron

Such erratic reporting is infuriating. I just can't think what's causing it, the data is clearly there as it's logging fine elsewhere, just not in their own platform!

B
#5 BobB

Hi Folks,

Not wishing to cause any rancor here, but I'm not convinced it's the app that's at issue. Many instances of the app are working properly. I think we'd hear a lot more if the app was as broken as you guys indicate.

@TimHutchings I suspect it's something else. (connection? glitch in the harvesting of data? server issues?) I'm not saying GE is perfect. But you might get answers sooner if you look at other problem sources than the app.

A
#6 arboretum

I'm having the same opposite problem, app is showing up to 12kwh solar usually at 8-8:30am from a 1.5kwh south west array and when I go to the app energy graph and tap on the grid export tab it says I've exported 12kwh from the battery to the grid which is happening while the battery is charging, the cloud portal is doing the same thing, the energy graph shows 12kwh generation but the power flow chart shows the correct generation. The app seems to be making up information out of thin air making it useless.

T
#7 TimHutchings

arboretum Exactly the same with me! Some sections in the portal are correct, while others in the portal are showing just plain wrong figures, and it's those that are wrong that are showing in the app also.
I have contacted GE, and sent screen prints of the differences and they said they would look into it. That was a week ago, and nothing back since unfortunately!

T
#9 TimHutchings

BobB Had my GE system 3 years, since Nov '22, and I know it inside out. There are no connection issues this end, and they have the correct data in some parts of the portal. But other parts of the portal are missing bits they should have. Somewhere, on their system are problems they need to sort out, because it's making the portal and app useless. Everything was fine till the end of September, but since October it's all been going pear shaped. The weekly and monthly reports are now completely inaccurate.

A
#10 Arron

TimHutchings I agree, same experience. Our system is a little over 2 years and the app/portal has generally been ok. It's gone off the rails last month and particularly this month. Makes it very difficult to know what to trust, or whether there's a fault with out installation for example.

Given Home Assistant is taking it's figures direct from the inverter I do not understand how these can be different! Someone is mis-reporting.

T
#11 TimHutchings

Arron
They do have the data! If you go to the Portal and edit the page to show the 'Legacy' Energy graph, you'll find all the data is there. Problem is that the GE App seems to use the same source of data that the new version of the Energy graph uses to get it's data, which is well adrift. It also appears to use the same data to produce the weekly and monthly reports, hence the reason they're all useless.
I have contacted GE with the screenshots from both graphs over the October period which are wildly different.
Hopefully GE can get it sorted out!

A
#12 Arron

TimHutchings OMFG I've just turned the legacy energy on in the portal... you are absolutely correct. The legacy figures are much more in accordance with what I'm seeing in HA and my Tigo optimizer summaries.

What on earth are they doing?? I'll log a support ticket accordingly.

B
#13 Bernadette

I am having the same issue. Notified that my firmware had been updated 2 days ago. Since then app info is complete rubbish, am currently using 7.3 kW power despite nothing other than fridge etc being on. Fortunately my electricity meter disagrees with this!

A
#14 Arron

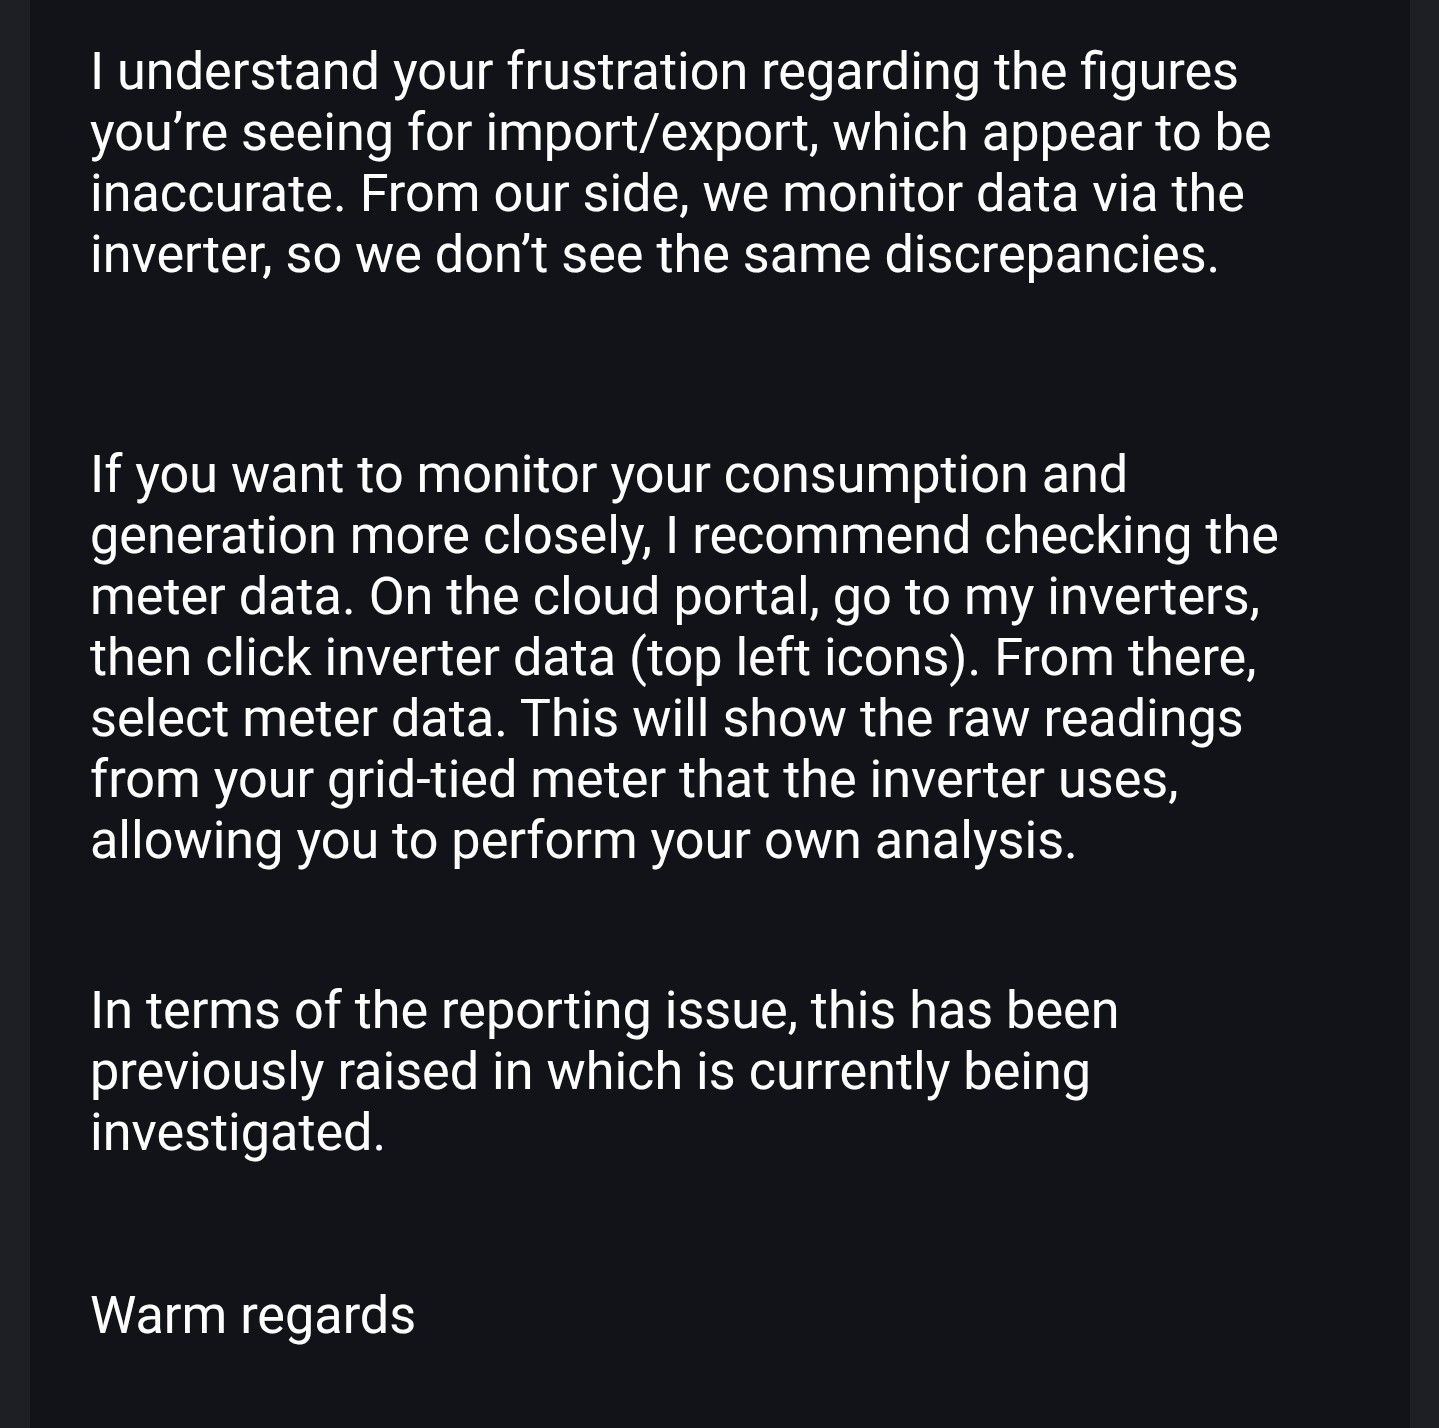
No joy getting hold of GE via WhatsApp or email yet, data from the app still garbage. Has anyone managed to talk to GE about this yet?

L
#15 Lincs_Will

I take that to mean 'yeah we know, we just don't care'.

S
#16 SteveCook

Well you had WARM Regards

A
#17 Arron

What a great response... looking at my grid data it looks to align with the legacy energy graphs which proves the point that the app and portal data is off. GE customer support is in a sad state of affairs.

N
#18 NormC

I take your point about the state of customer support but I doubt if they have anything to do with the development of the app and portal.
It is perhaps not suprising that there is a disconnect about the data that is returned in the app and certain parts of the portal. It might help if the naming conventions were consistent on both platforms. In the app you can set a timed discharge which actually sets a the battery to pause on the portal! The timed export in the app sets a timed discharge on the portal!